Step-by-Step Guide: Monitor Scheduled Events for Azure Windows Virtual Machines
In this post we will see how we can monitor scheduled events to get notified per Email about upcoming maintenance events that could affect our virtual machines running in Azure and how to build some basic automation that can help with monitoring and analysis.
Scheduled Events is available as part of the Azure Instance Metadata Service (aka IMDS), which is available on every Azure virtual machine.
Besides instance metadata and identity tokens, IMDS also exposes Scheduled Events. These are notifications Azure sends to your VM before planned actions like reboots, redeployments, or host maintenance.
Scheduled Events for all virtual machines (VMs) in an entire Availability Set or a Placement Group for a Virtual Machine Scale Set are delivered to all other VMs in the same group or set regardless of Availability Zone usage.
Scheduled events are delivered to and can be acknowledged by:
- Standalone Virtual Machines.
- All the VMs in an Azure cloud service (classic).
- All the VMs in an availability set.
- All the VMs in a scale set placement group.
Introduction
Updates are applied to different parts of Azure every day, to keep the services running on them secure, and up-to-date. In addition to planned updates, unplanned events may also occur.
For example, if any hardware degradation or fault is detected, Azure services may need to perform unplanned maintenance.
Using live migration, memory preserving updates and keeping a strict limit on the impact of updates, allow these events to be almost transparent to customers. At most, they can cause a few seconds of virtual machine freeze.
For some applications however, even a few seconds of virtual machine freeze could cause an impact.
Knowing in advance about upcoming Azure maintenance is important to ensure the best experience for those applications.
Scheduled Events service provides you with a programmatic interface to be notified about upcoming maintenance, and enables you to gracefully handle the maintenance.
Source: https://learn.microsoft.com/en-us/azure/virtual-machines/windows/scheduled-event-service
Monitor scheduled events for your Windows VMs
Scheduled Events is available as part of the Azure Instance Metadata Service, which is available on every Azure virtual machine.
Customers can write automation to query the endpoint of their virtual machines to find scheduled maintenance notifications and perform mitigations, like saving the state and taking the virtual machine out of rotation.
Microsoft recommends building automation to record the Scheduled Events so you can have an auditing log of Azure maintenance events.
Prerequisites
For this example, you need to create a Windows Virtual Machine in an Availability Set. Scheduled Events provide notifications about changes that can affect any of the virtual machines in your availability set, Cloud Service, Virtual Machine Scale Set or standalone VMs.
A service is run that polls for scheduled events on one of the VMs that act as a collector, to get events for all of the other VMs in the availability set.
You also need to create a Log Analytics workspace that we use to aggregate information from the VMs in the availability set.
Source: https://learn.microsoft.com/en-us/azure/virtual-machines/windows/scheduled-event-service
Set up the environment
We need two virtual machines in an availability set which we finally will monitor for upcoming maintenance events.
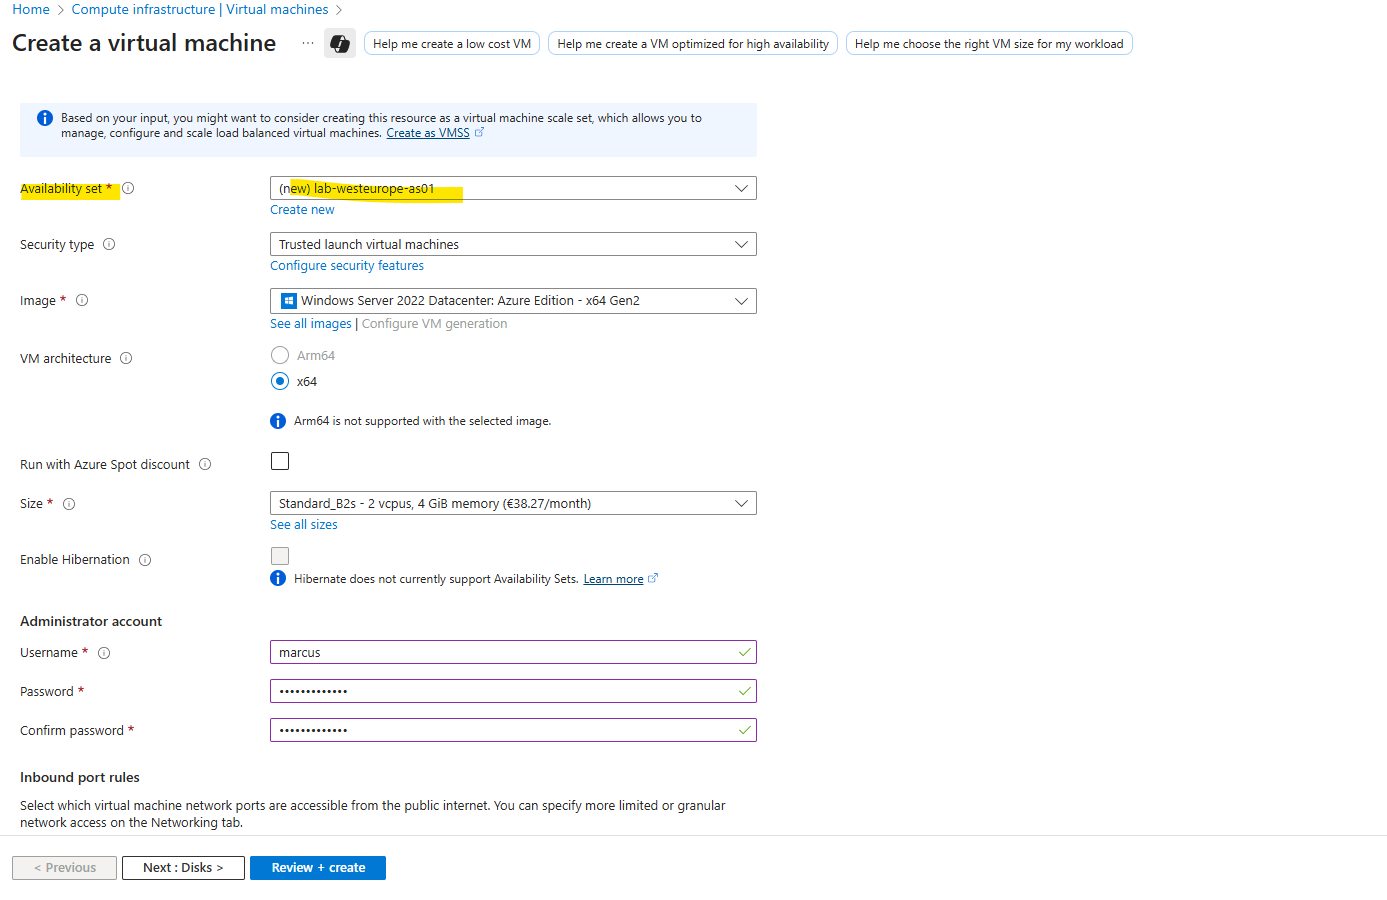
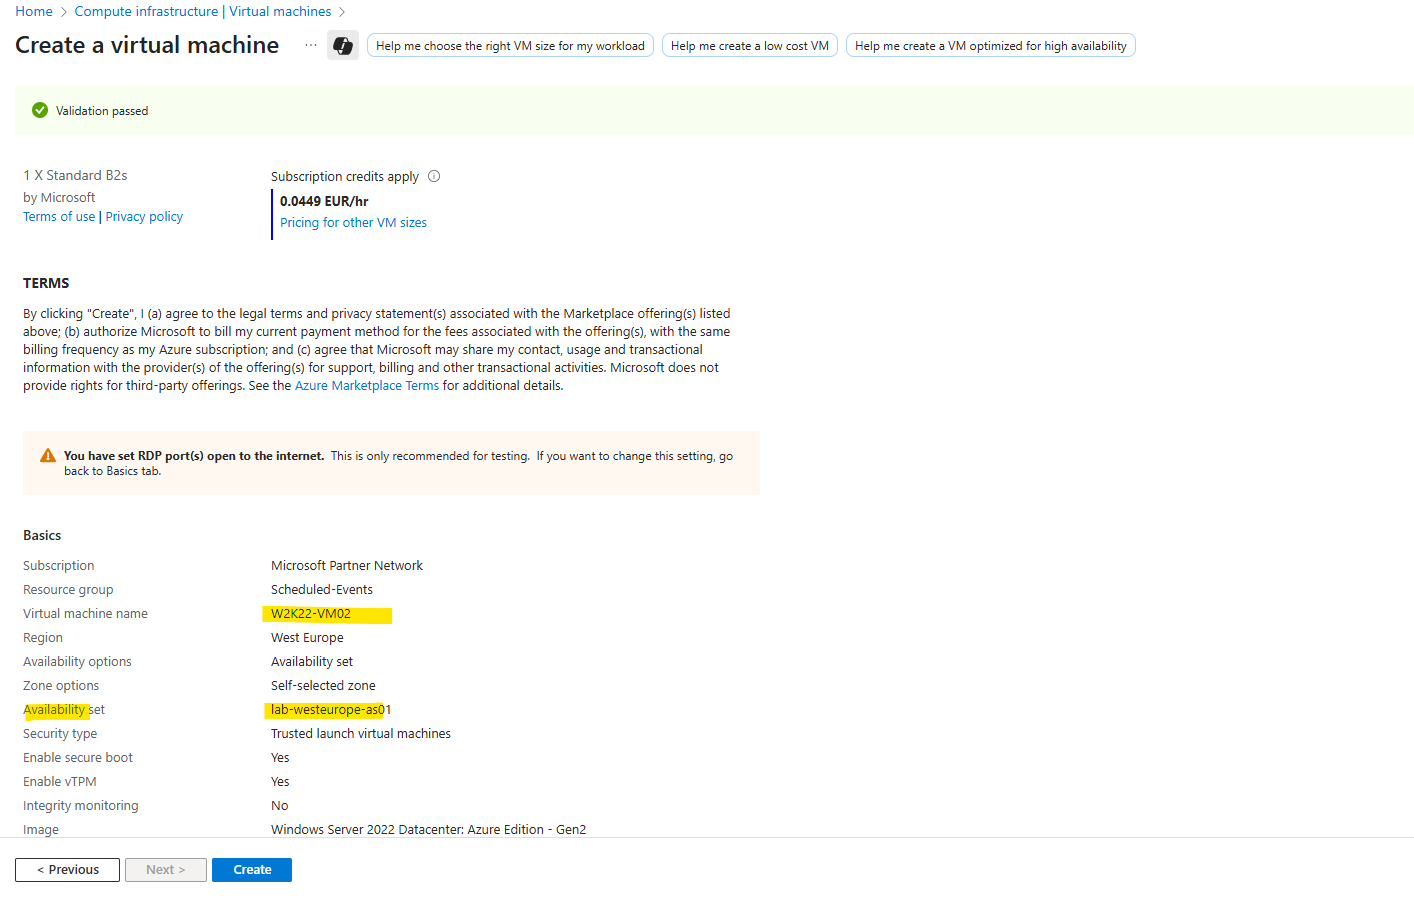
Below I will create the first virtual machine (W2K22) and a new availability set.
Next I will create a second virtual machine (W2K22) which I will also place in the newly created availability set.
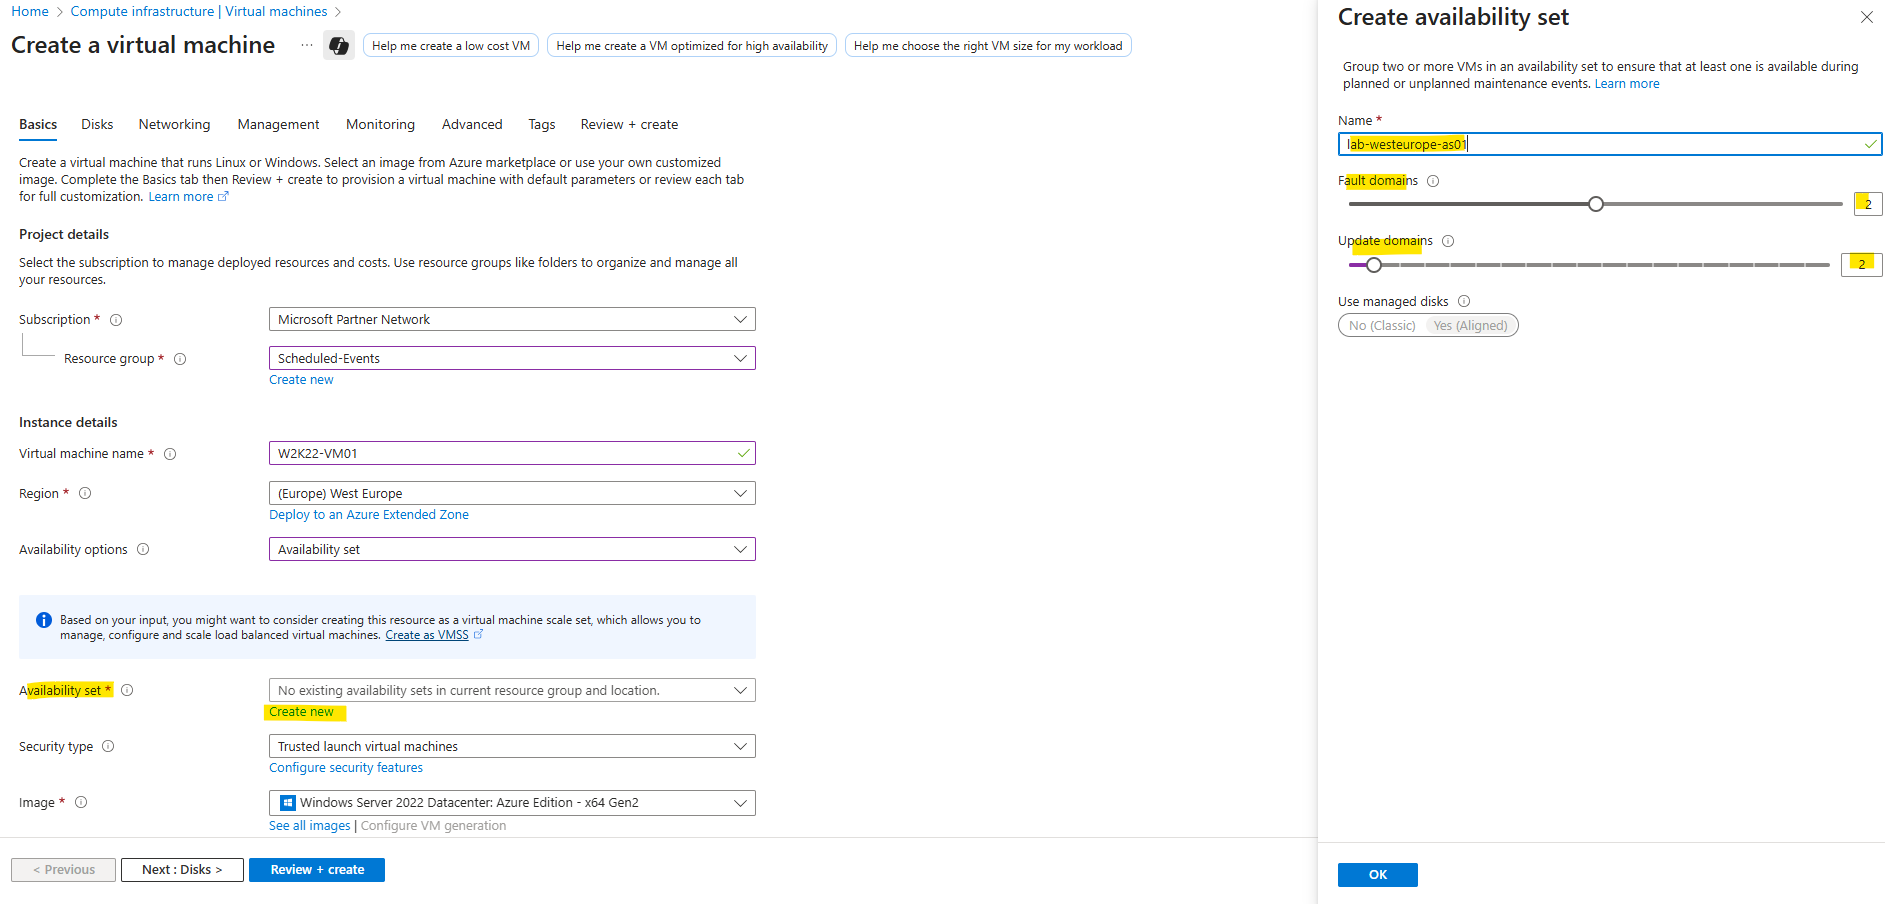
The machine is placed into the newly created availability set.
Now I will create the second virtual machine (W2K22) as mentioned and place it also in the previously above created availability set.
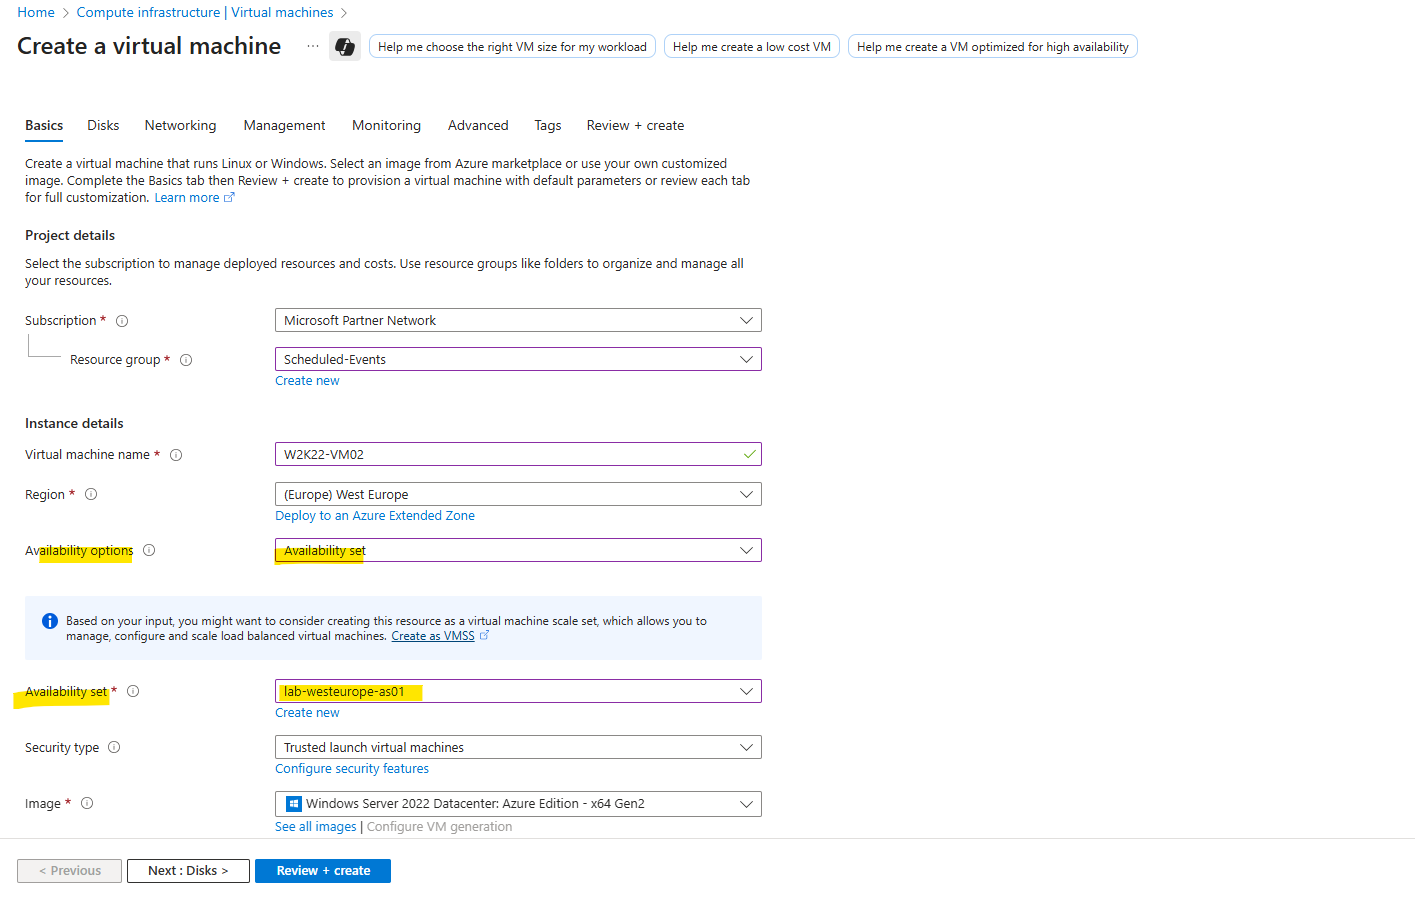
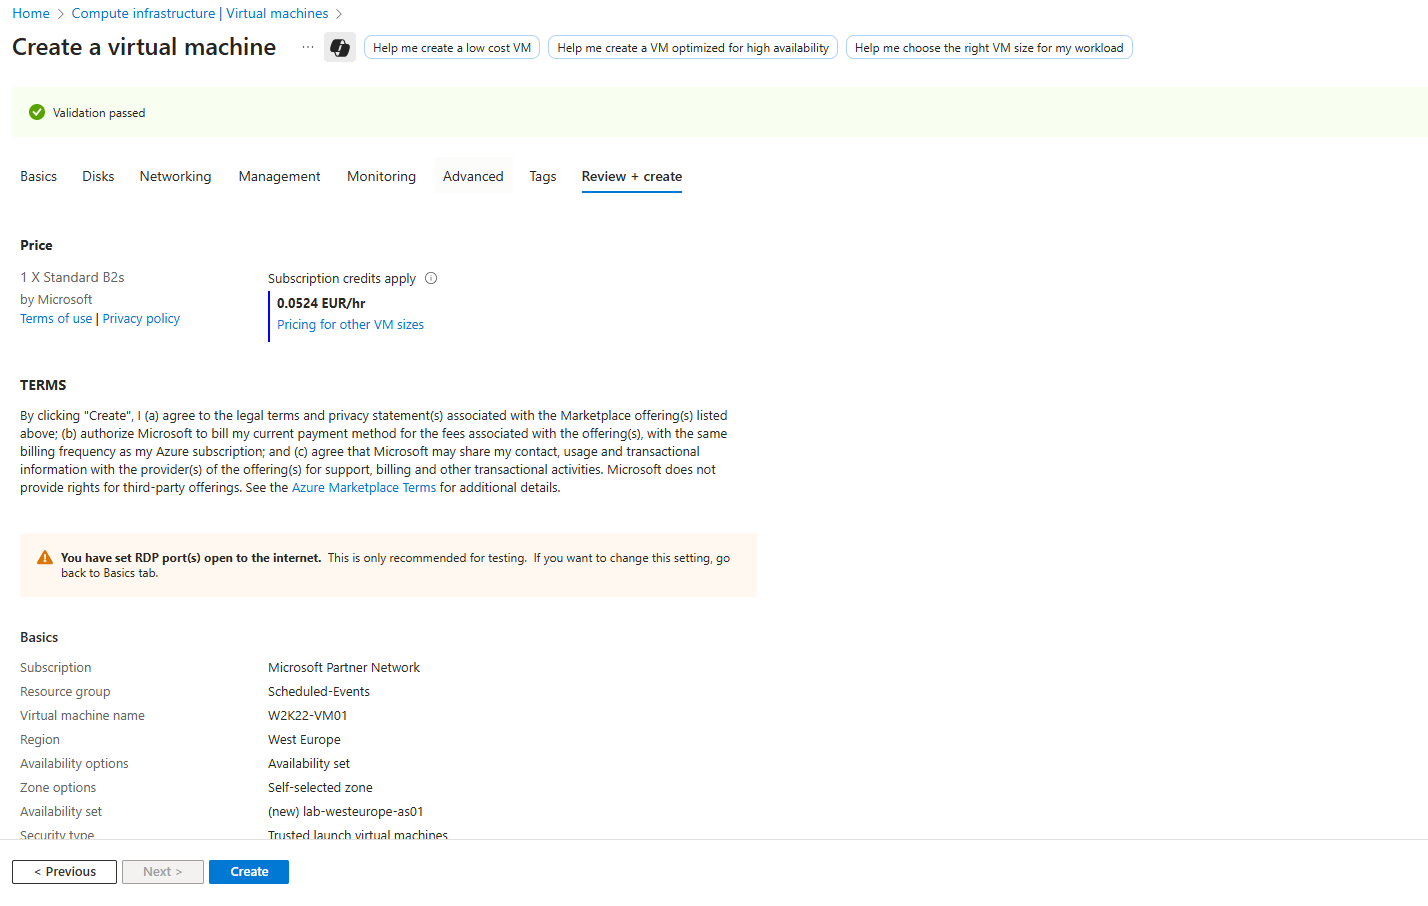
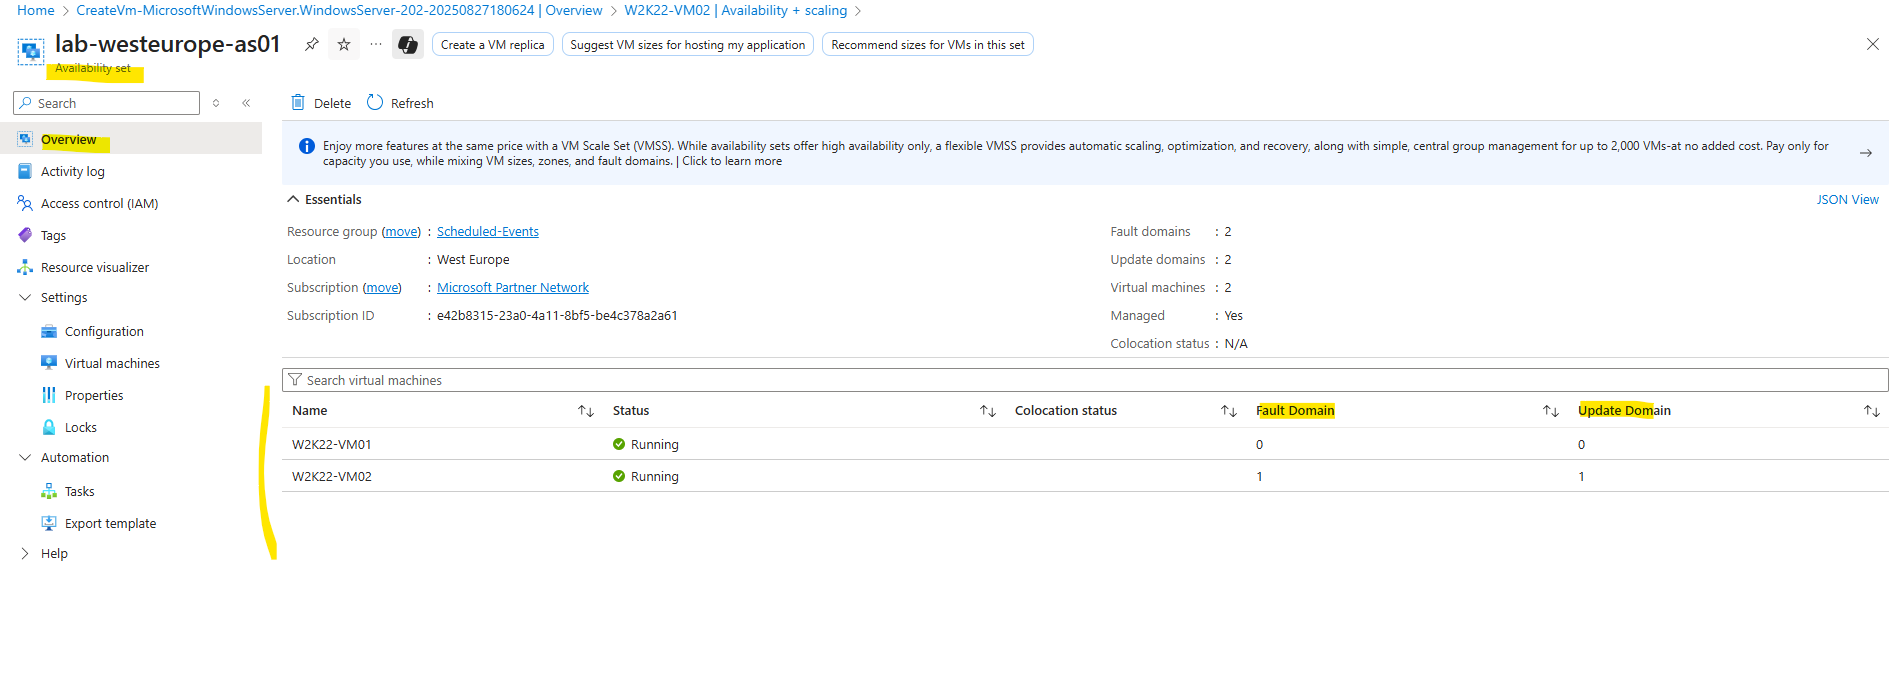
Finally we have two virtual machines running in an availability set.
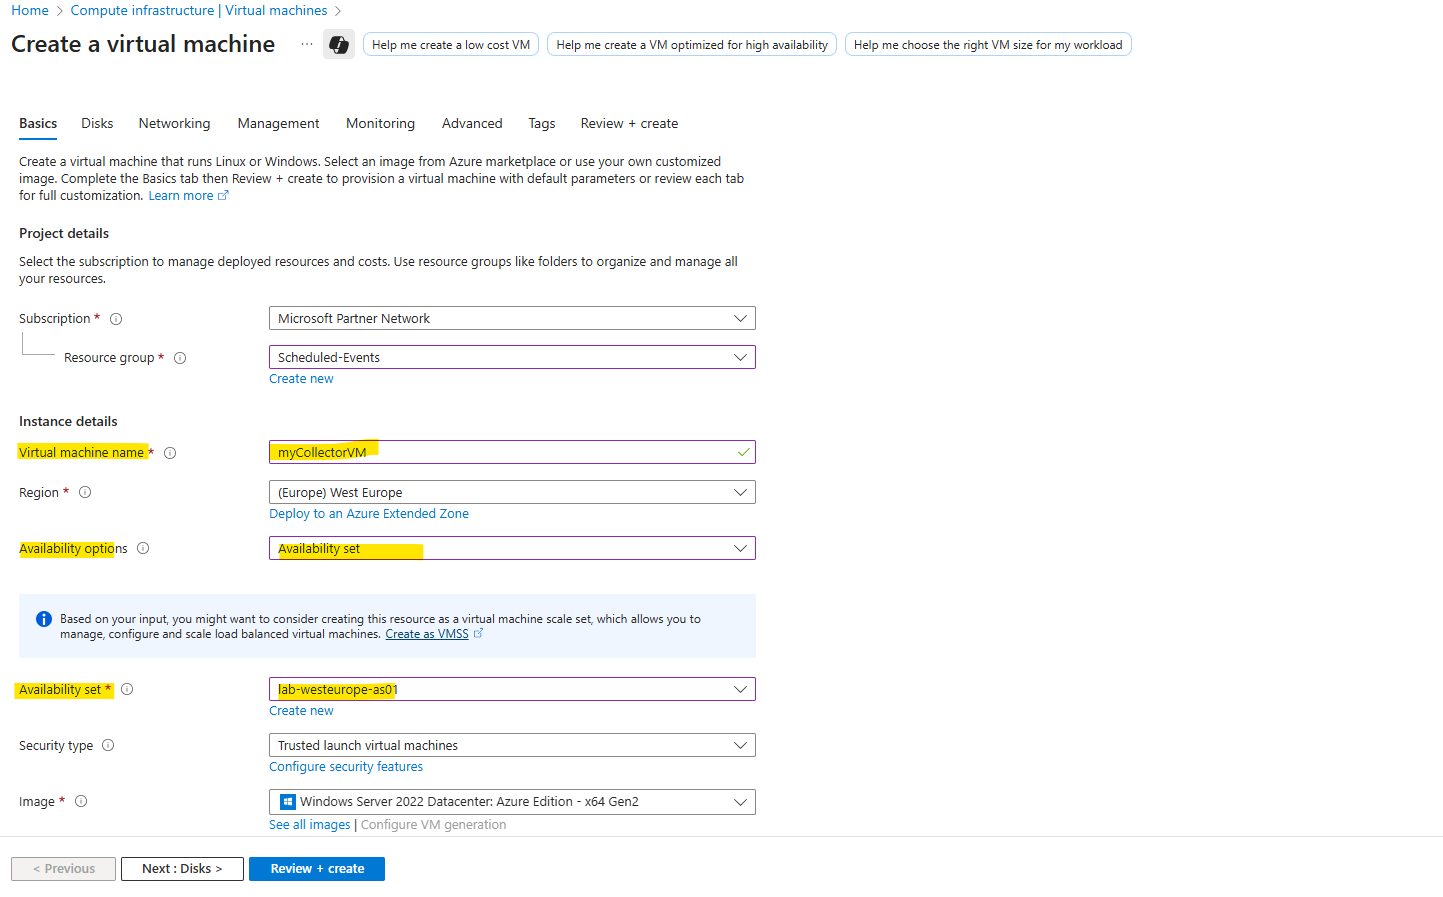
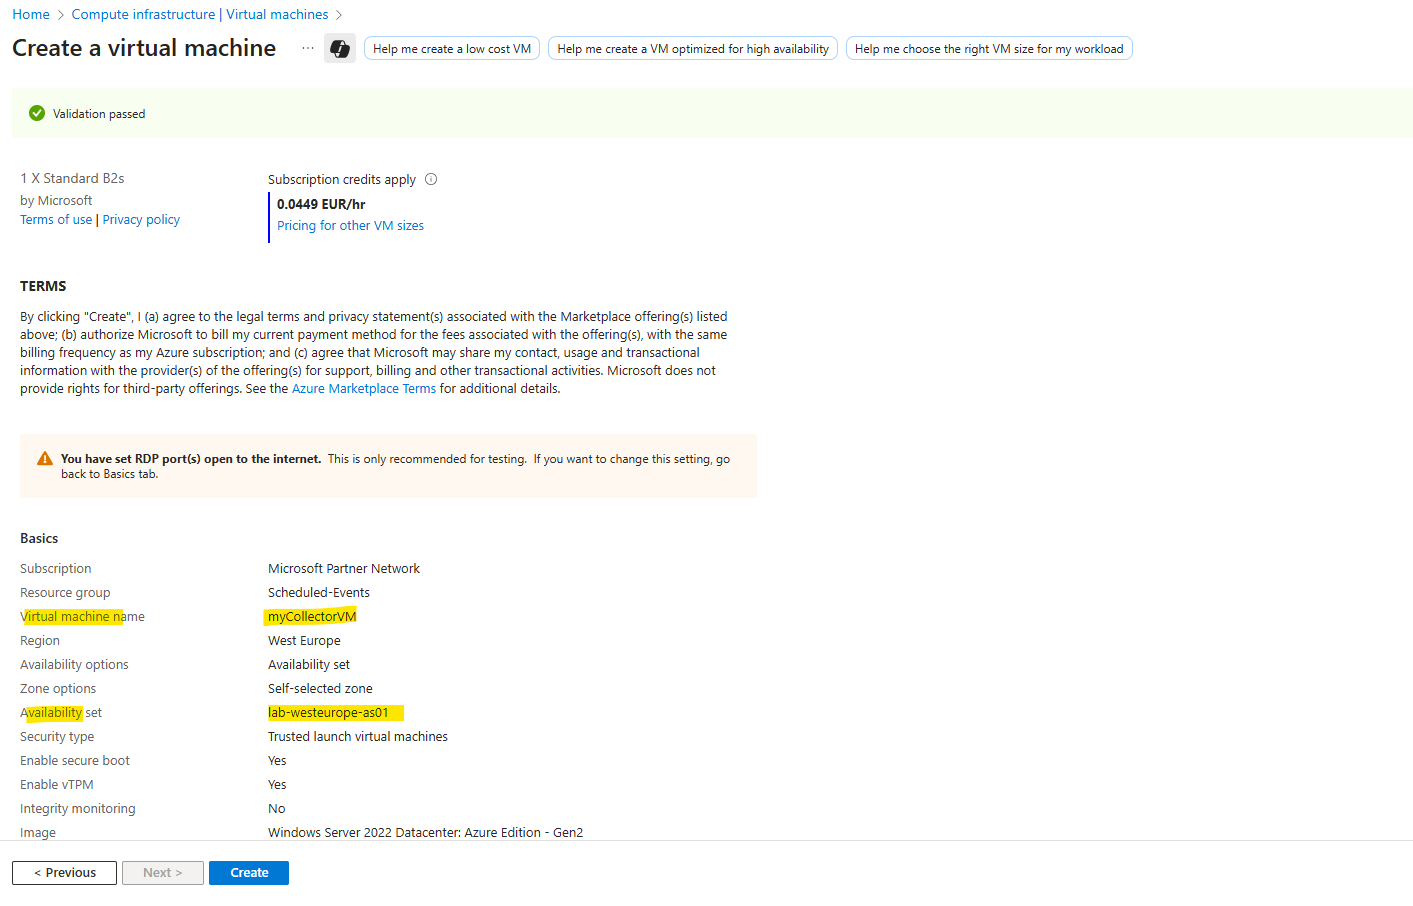
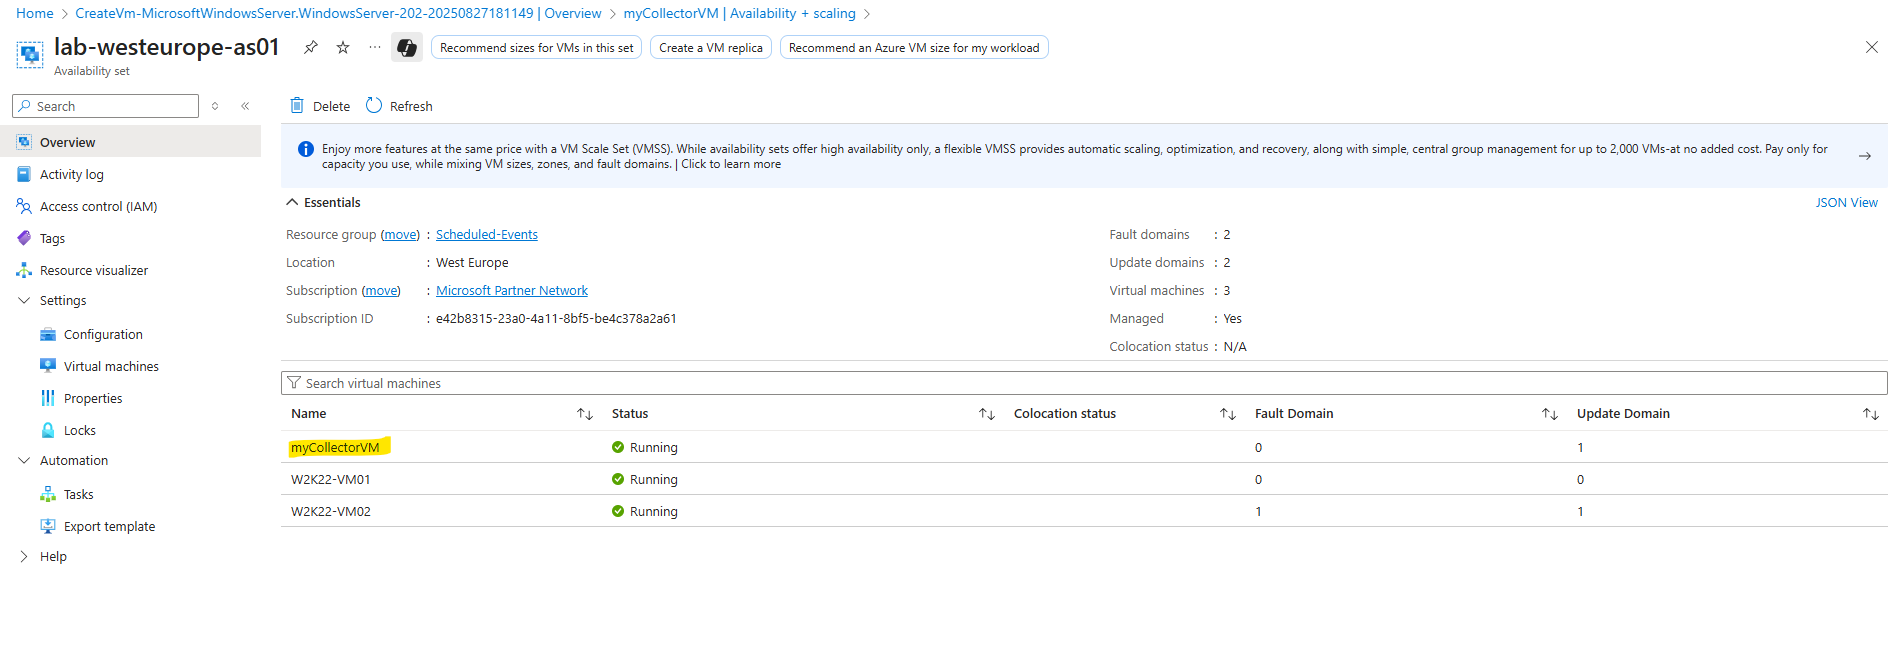
We also need to create a 3rd VM, called myCollectorVM, in the same availability set.
On this virtual machine a service is run that polls for scheduled events and act as a collector as mentioned, to finally get events for all of the other VMs in the availability set.
Scheduled Events for all virtual machines (VMs) in an entire Availability Set or a Placement Group for a Virtual Machine Scale Set are delivered to all other VMs in the same group or set regardless of Availability Zone usage.
This allows your “collector VM” to monitor other VMs’ events simply by polling the local IMDS endpoint.
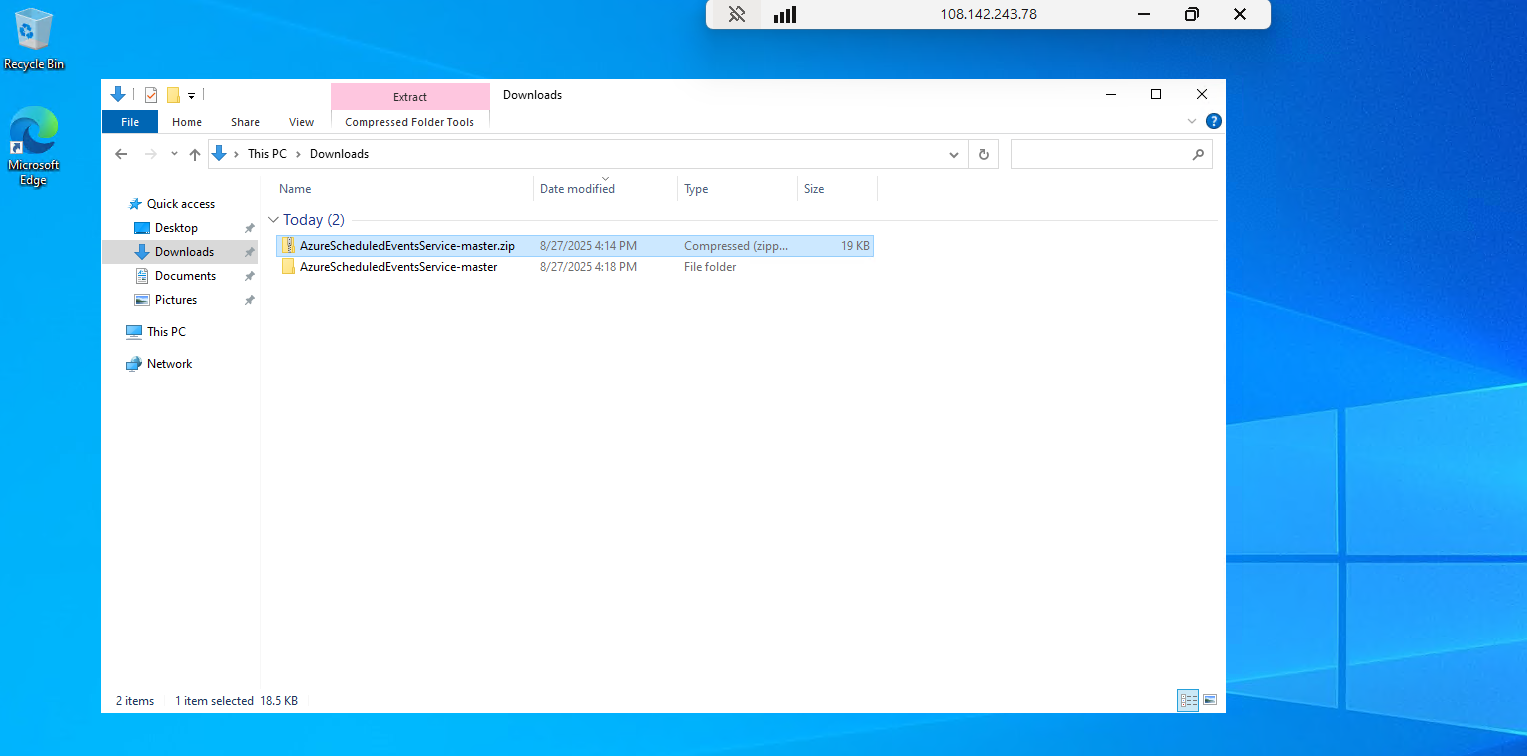
Download the installation .zip file of the project from GitHub which contains our service that polls for scheduled events
This project enables your Azure Virtual Machines to subscribe to Scheduled Events which informs your application about upcoming Azure Maintenance. The project is for Windows Virtual Machines and contains a powershell script that listens and logs the events to Windows Event logs. These logs can be then exported to Azure Monitor to then build alerting.
Source: https://github.com/microsoft/AzureScheduledEventsService
Next I will connect to myCollectorVM, copying the .zip file to and extracting all of the files.
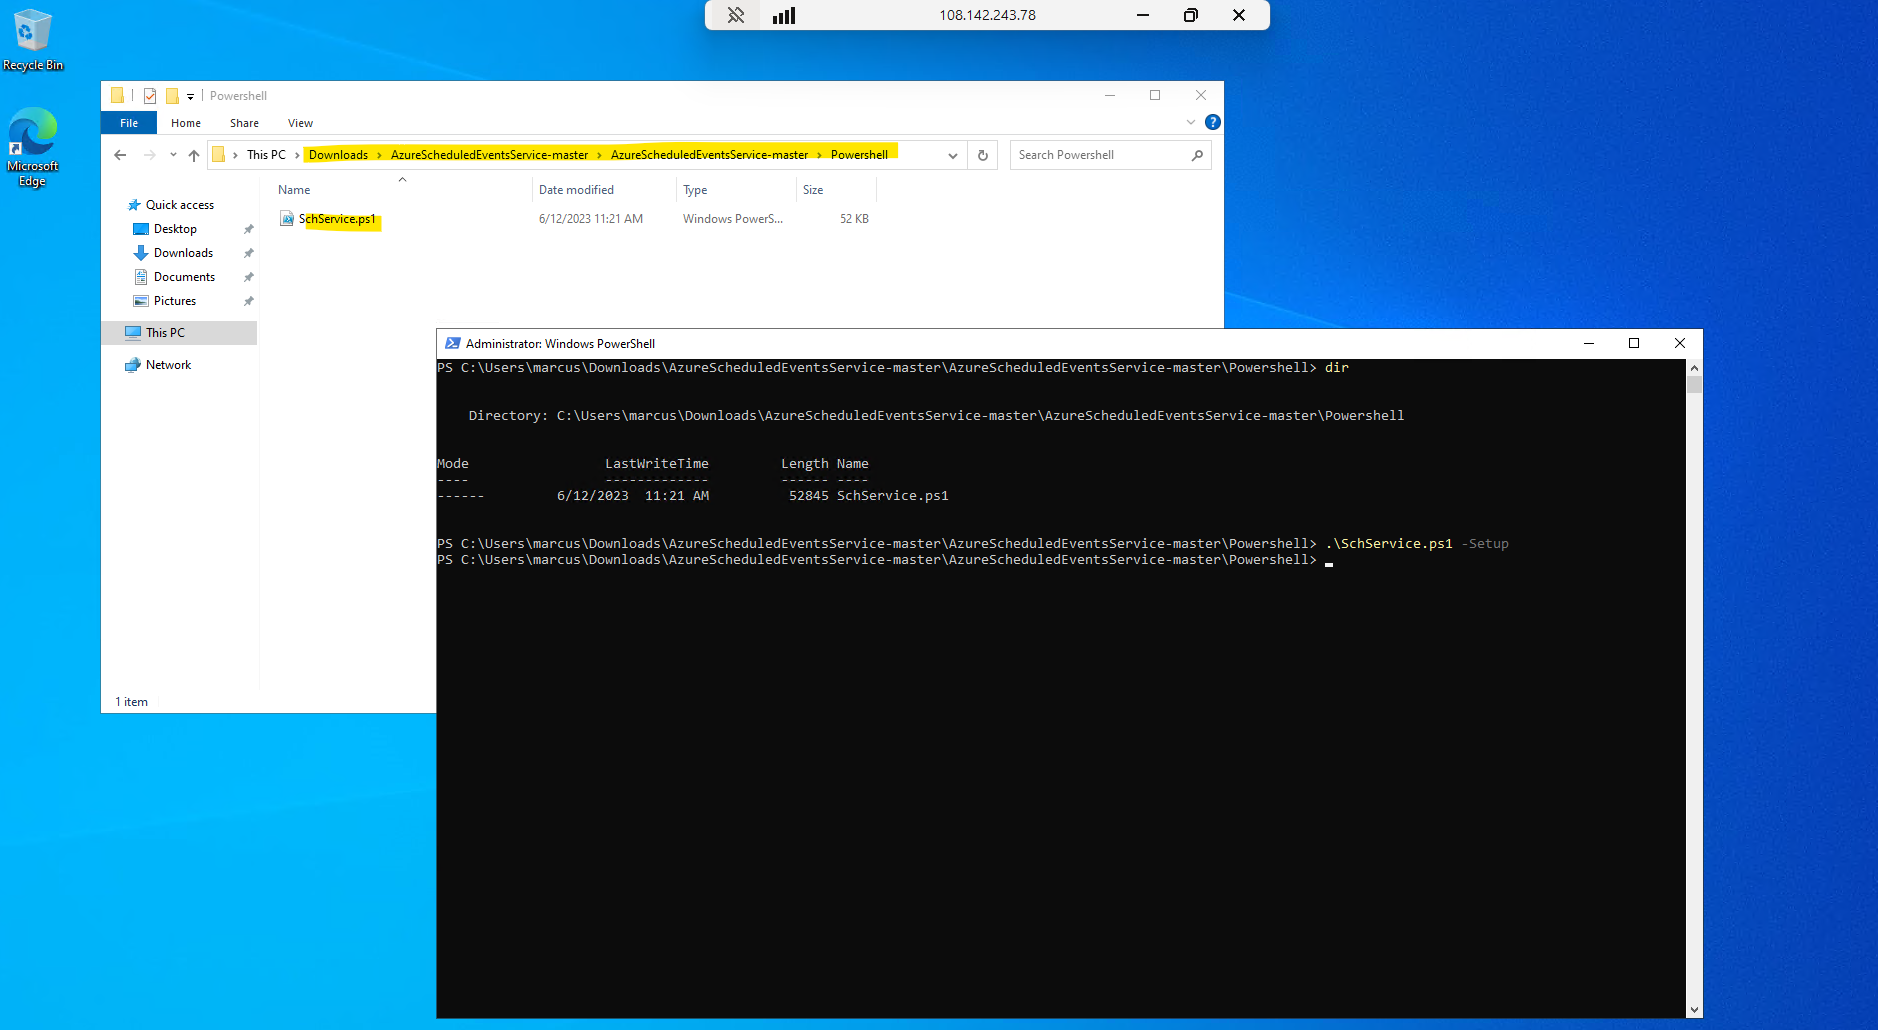
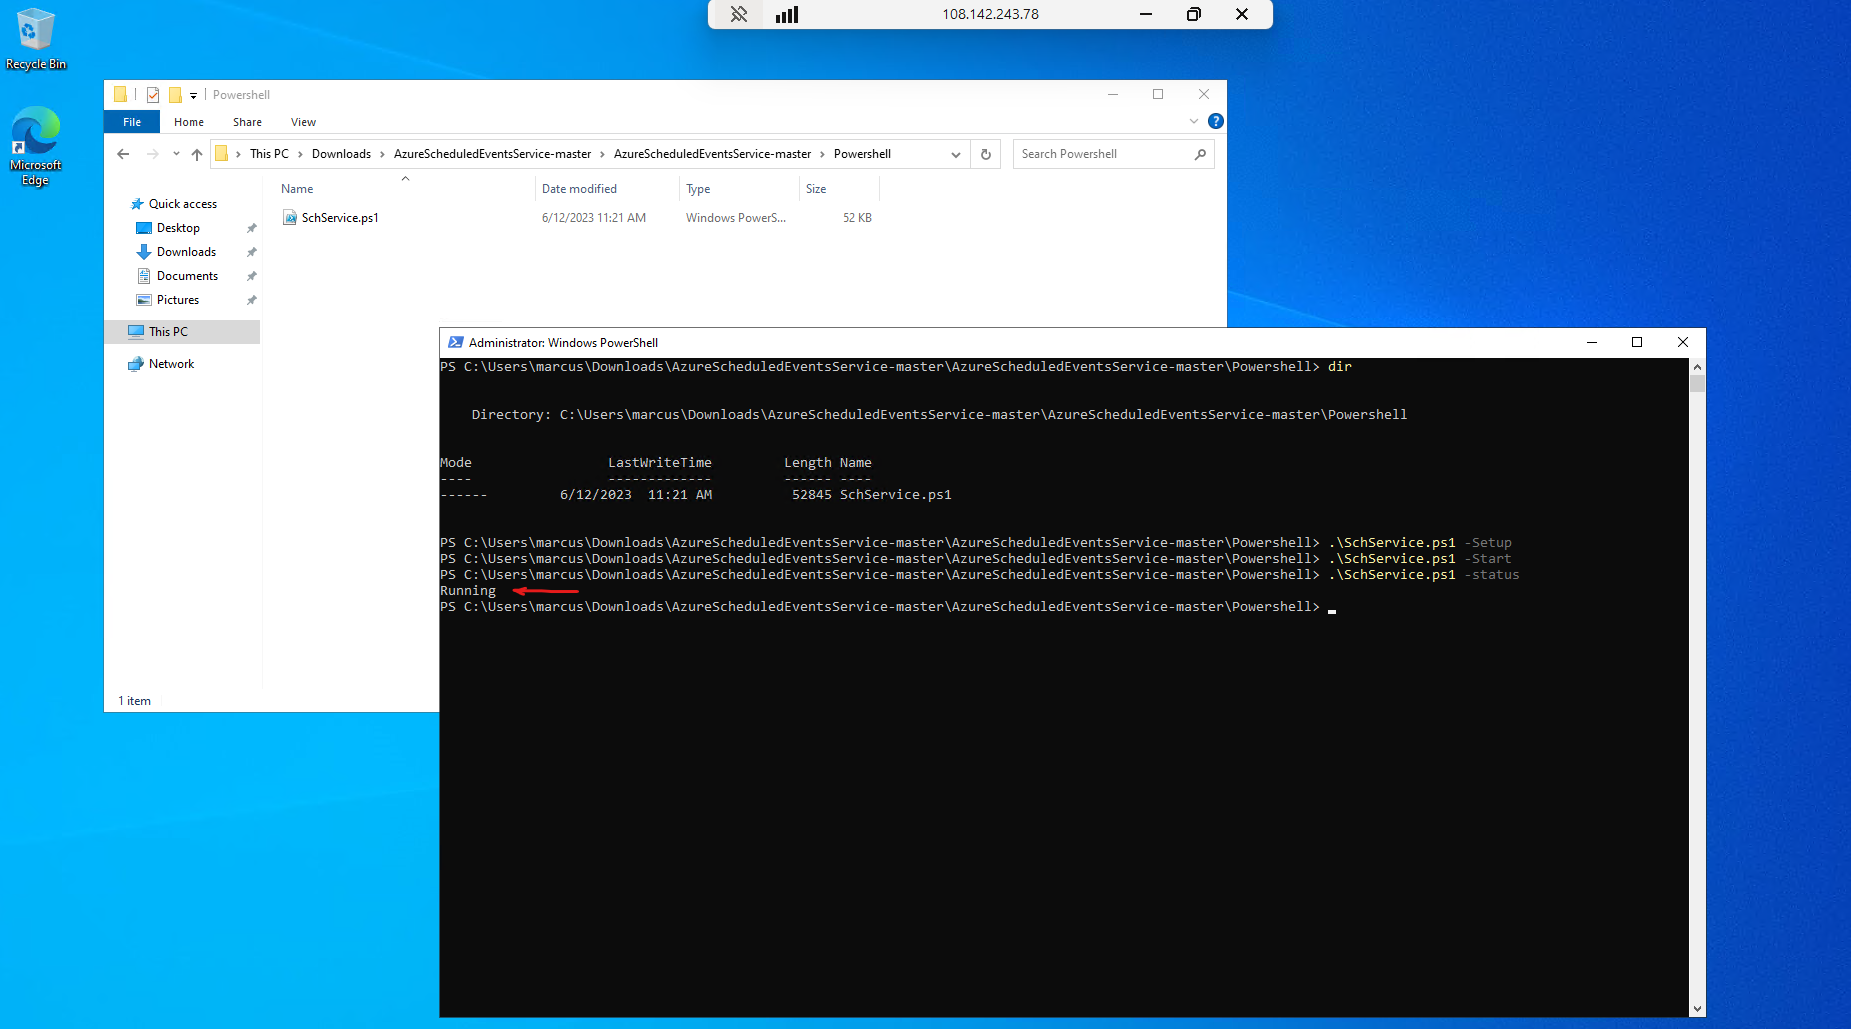
To install the service run the PowerShell script by using the -Setup flag.
.\SchService.ps1 -Setup
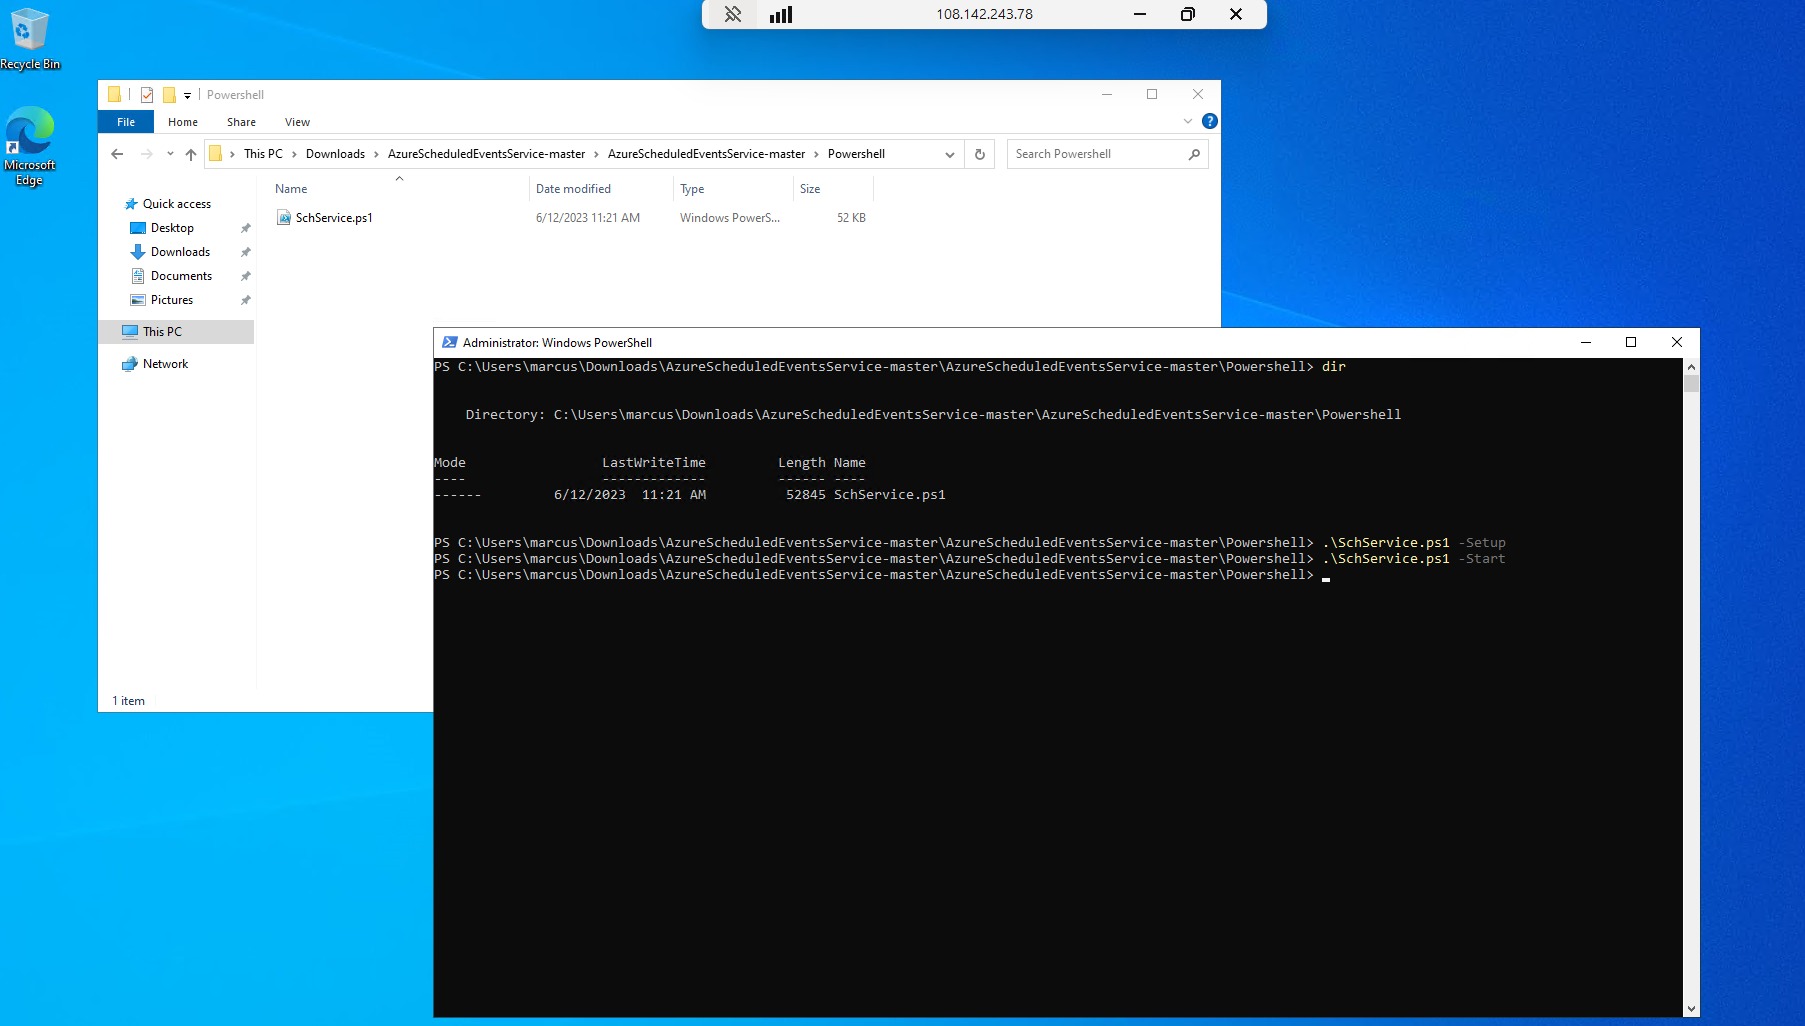
Start the service by using the -Start flag.
.\SchService.ps1 -Start
Validate the service status and make sure it is running by using the -Status flag.
.\SchService.ps1 -Status
The validation command should return Running.
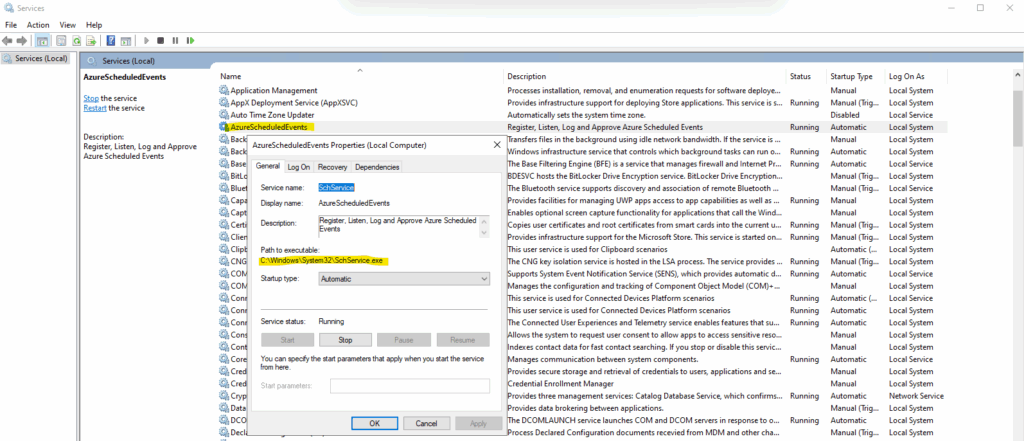
We can determine the corresponding Windows service name by directly by checking the PowerShell script which is AzureScheduledEvents.
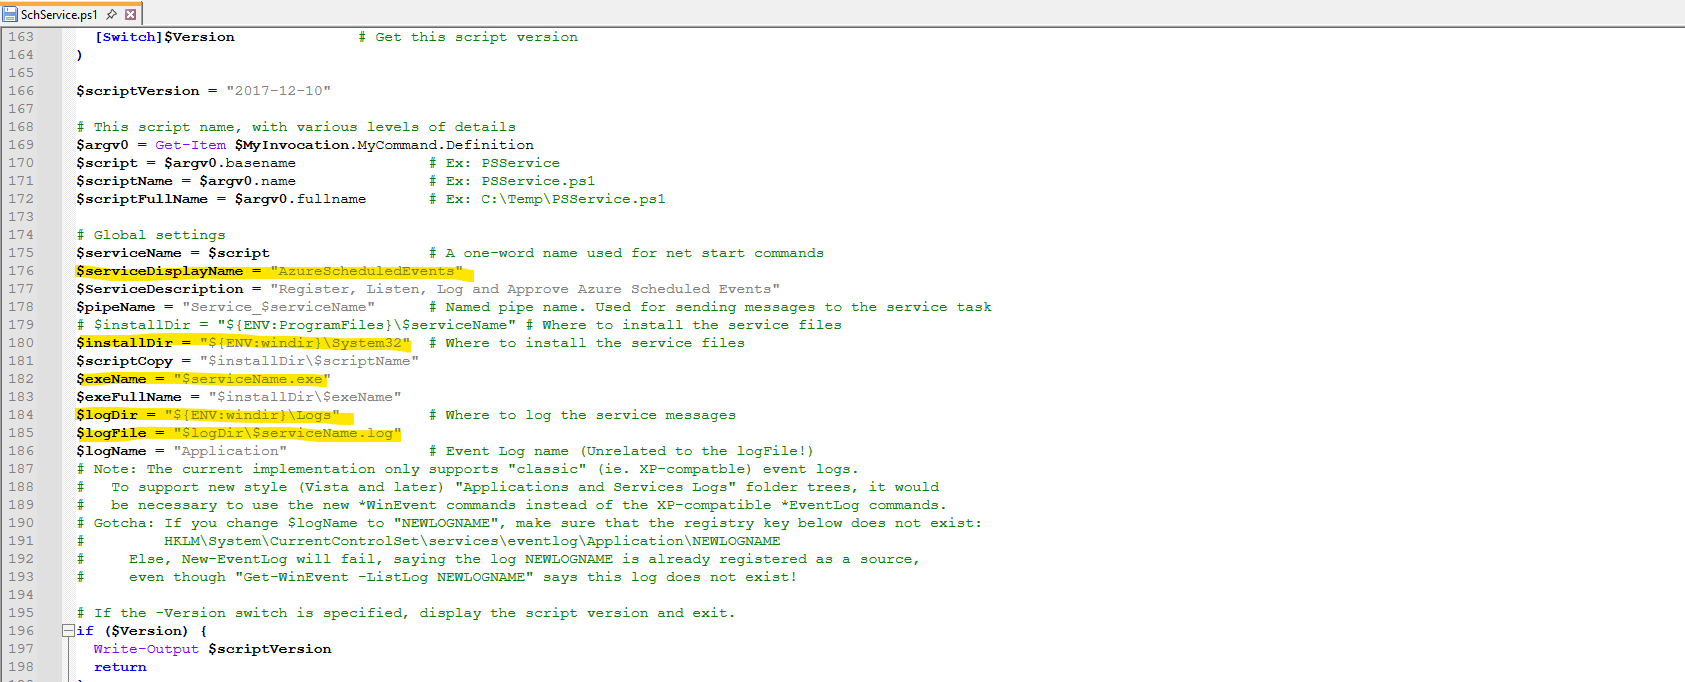
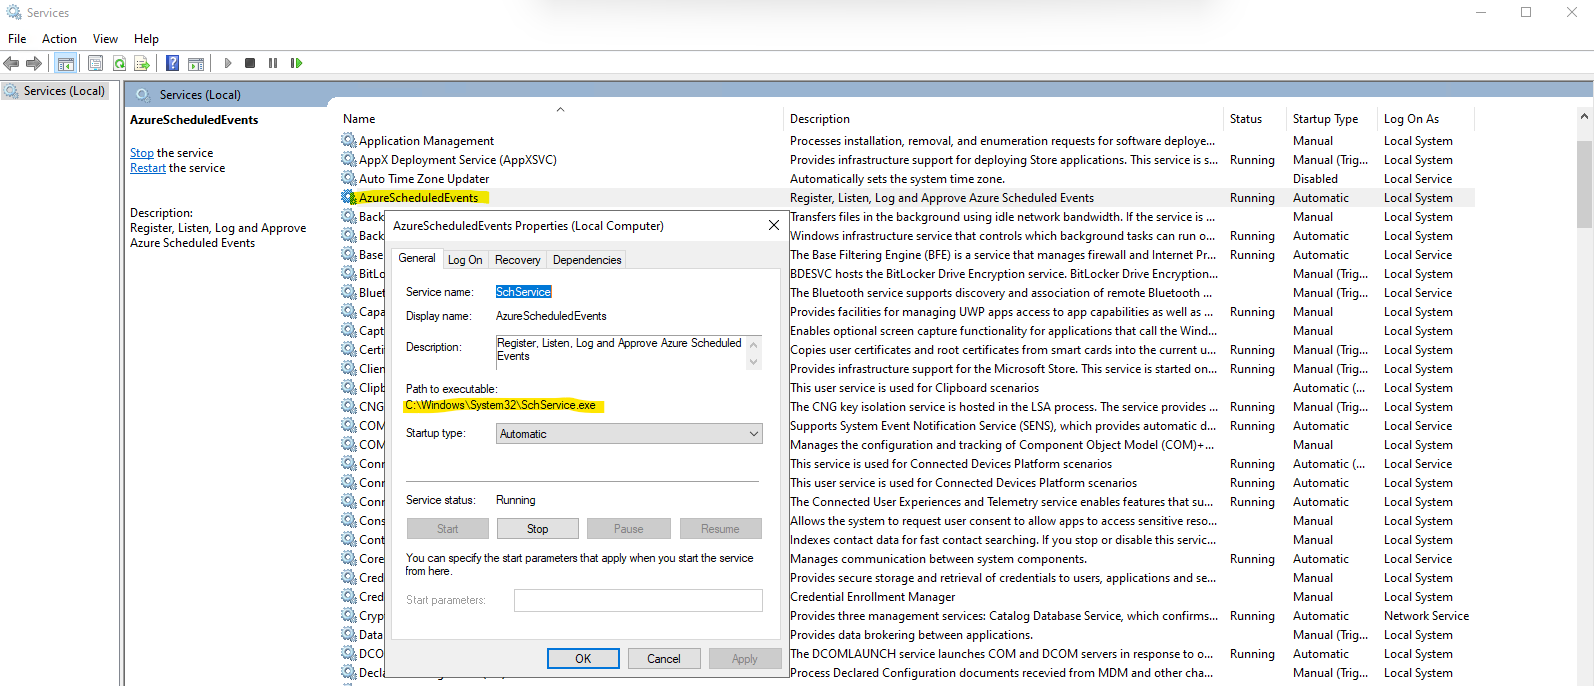
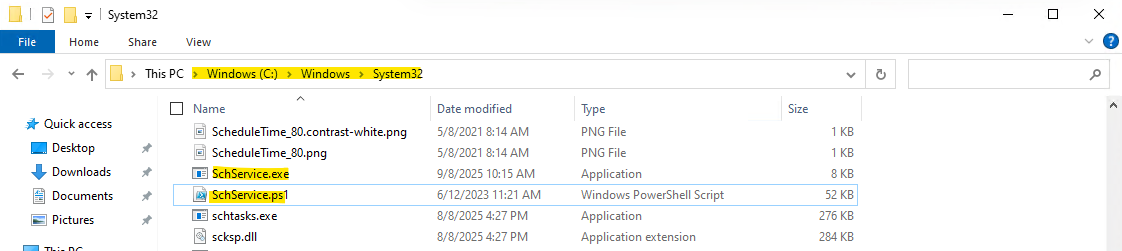
The executable files for the service are placed into C:\Windows\System32.
We will also find the section about polling the scheduled events from the corresponding Azure Instance Metadata Service (IMDS) URL.
We can trigger this URL also directly on the machine and from PowerShell by running:
PowerShell 6 or later required to support -NoProxy flag.
PS> Invoke-RestMethod -Headers @{"Metadata"="true"} -Method GET -NoProxy -Uri "http://169.254.169.254/metadata/scheduledevents?api-version=2017-03-01" | ConvertTo-Json -Depth 64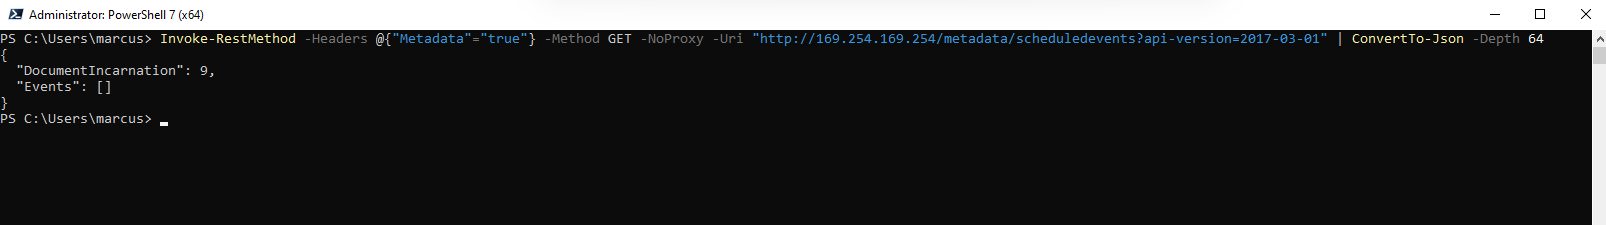
The service will now start polling every 10 seconds for any scheduled events and auto approve the events to expedite the maintenance.
Freeze, Reboot, Redeploy, and Preempt are the events captured by Schedule events. You can extend the script to trigger some mitigations prior to approving the event.
For events in the EventStatus:”Scheduled” state, you need to take steps to prepare your workload. Once the preparation is complete, you should then approve the event using the scheduled event API. Otherwise, the event is automatically approved when the NotBefore time is reached.
If the VM is on shared infrastructure, the system will then wait for all other tenants on the same hardware to also approve the job or timeout.
Once approvals are gathered from all impacted VMs or the NotBefore time is reached, then Azure generates a new scheduled event payload with EventStatus:”Started” and triggers the start of the maintenance event.
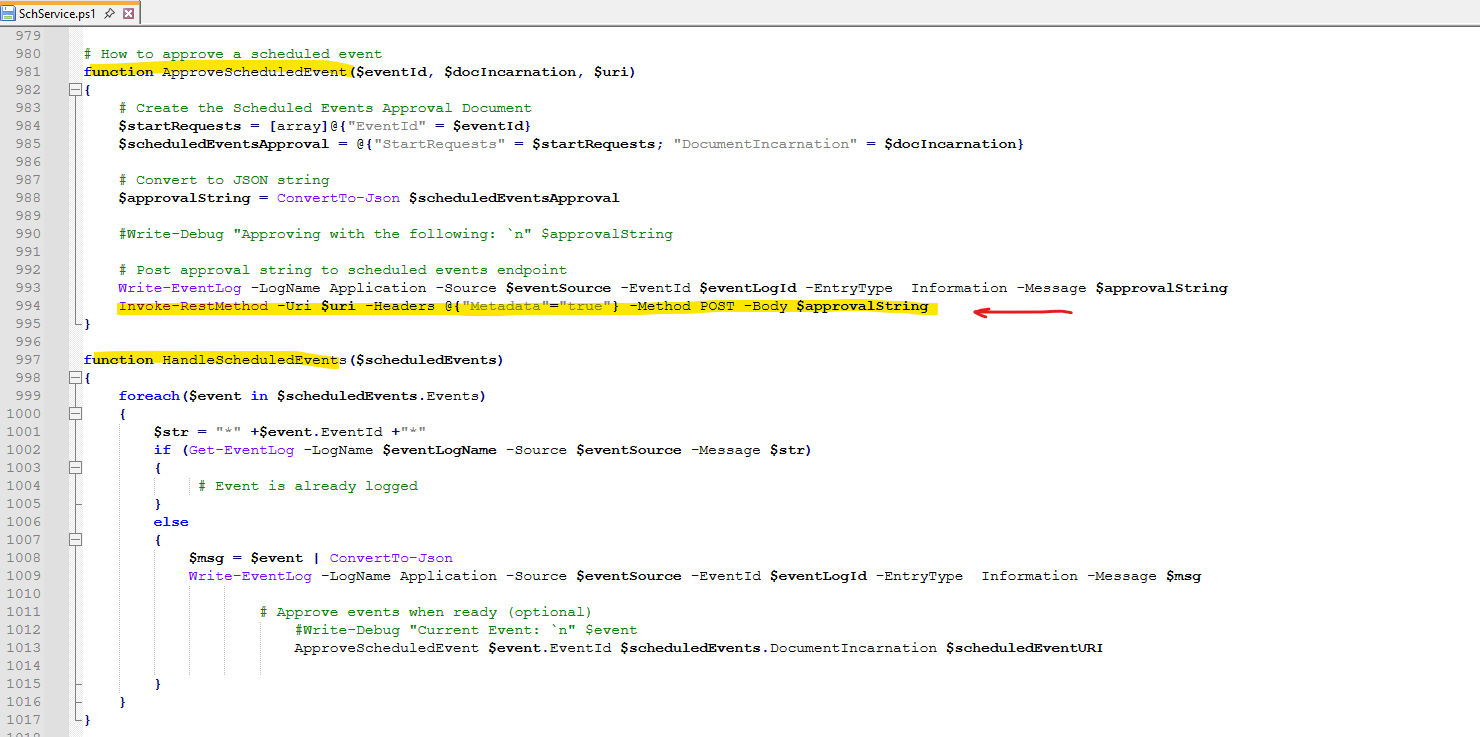
The auto approve finally will be executed by the function ApproveScheduledEvent and its Invoke-RestMethod -Uri $uri method marked with the red arrow below.
$approvalString contains the JSON payload with “StartRequests”: [ { “EventId”: “…” } ].
That POST goes to the IMDS scheduled events endpoint http://169.254.169.254/metadata/scheduledevents?…
By doing so, the VM signals to Azure: “I approve, you can start the maintenance now.”Polling loop calls the IMDS endpoint (/metadata/scheduledevents) every 10 seconds. When the response contains events, they’re passed into function HandleScheduledEvents($scheduledEvents) {
foreach($event in $scheduledEvents.Events) …. Inside HandleScheduledEvents, for each scheduled event it constructs the $approvalString and then calls the approval function.
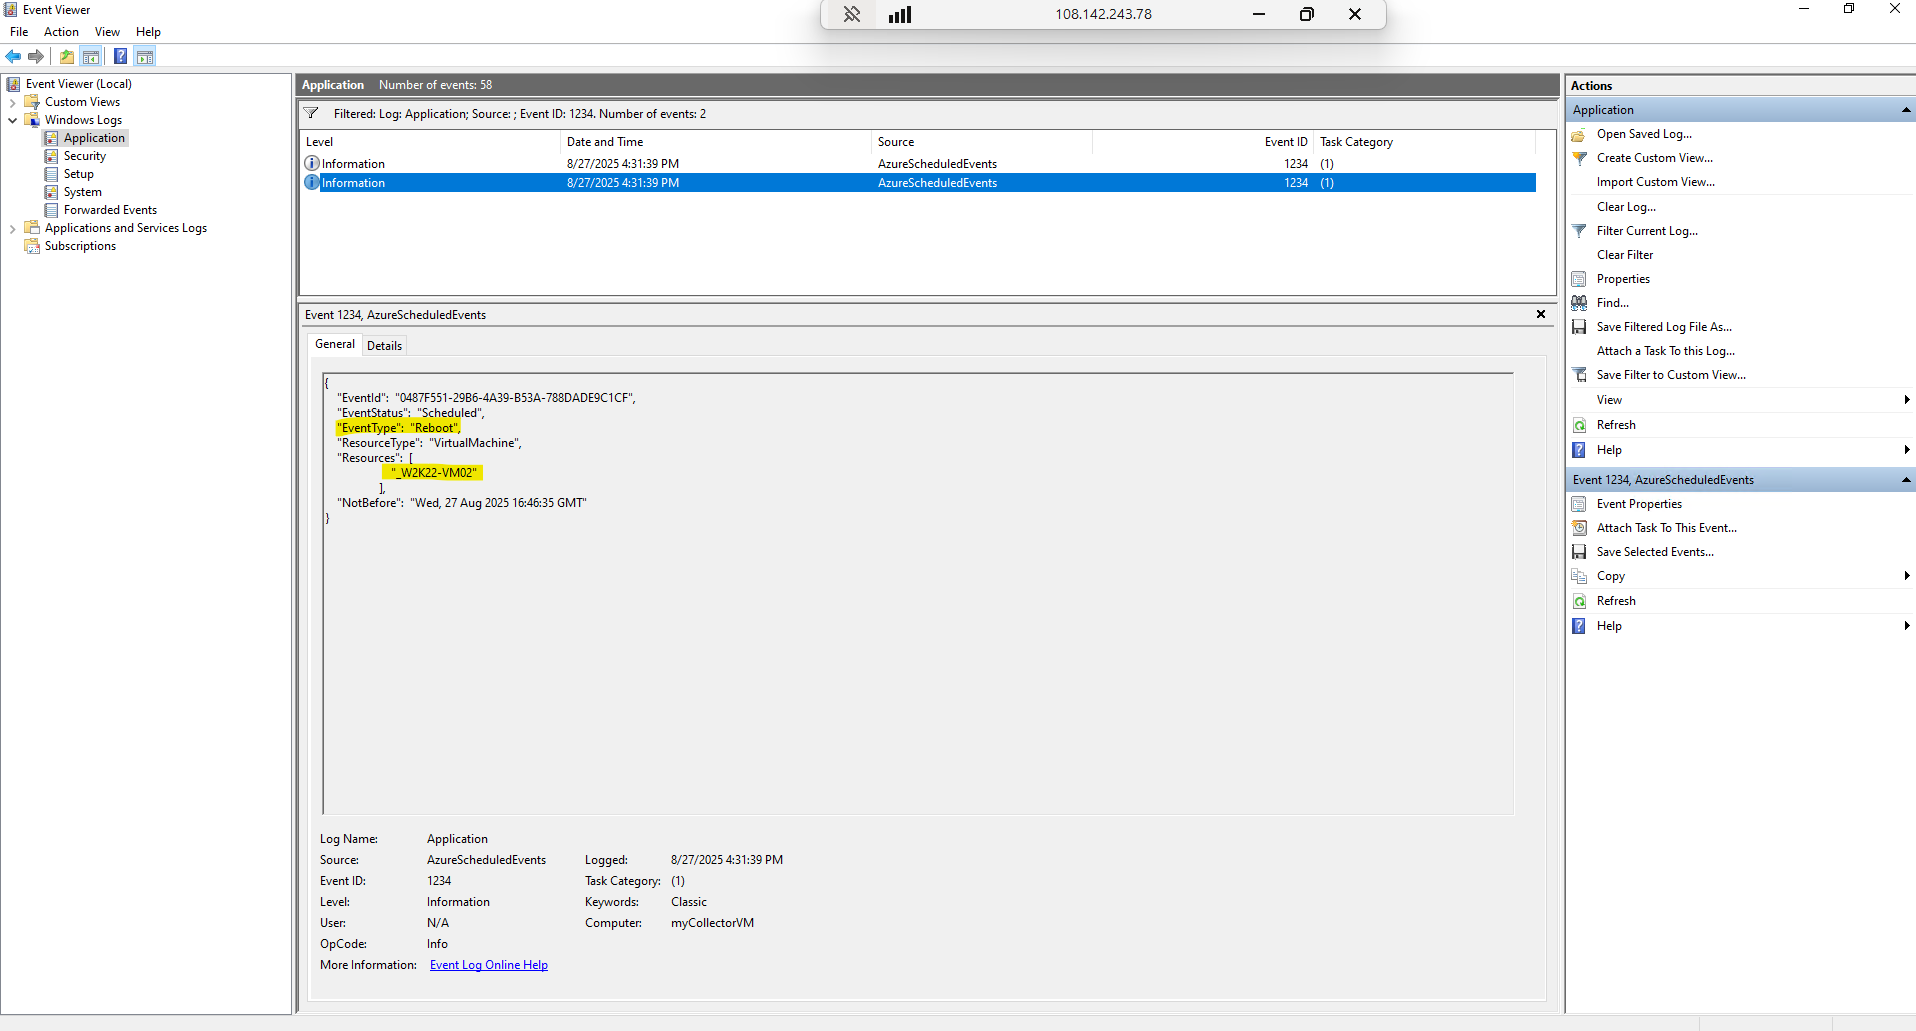
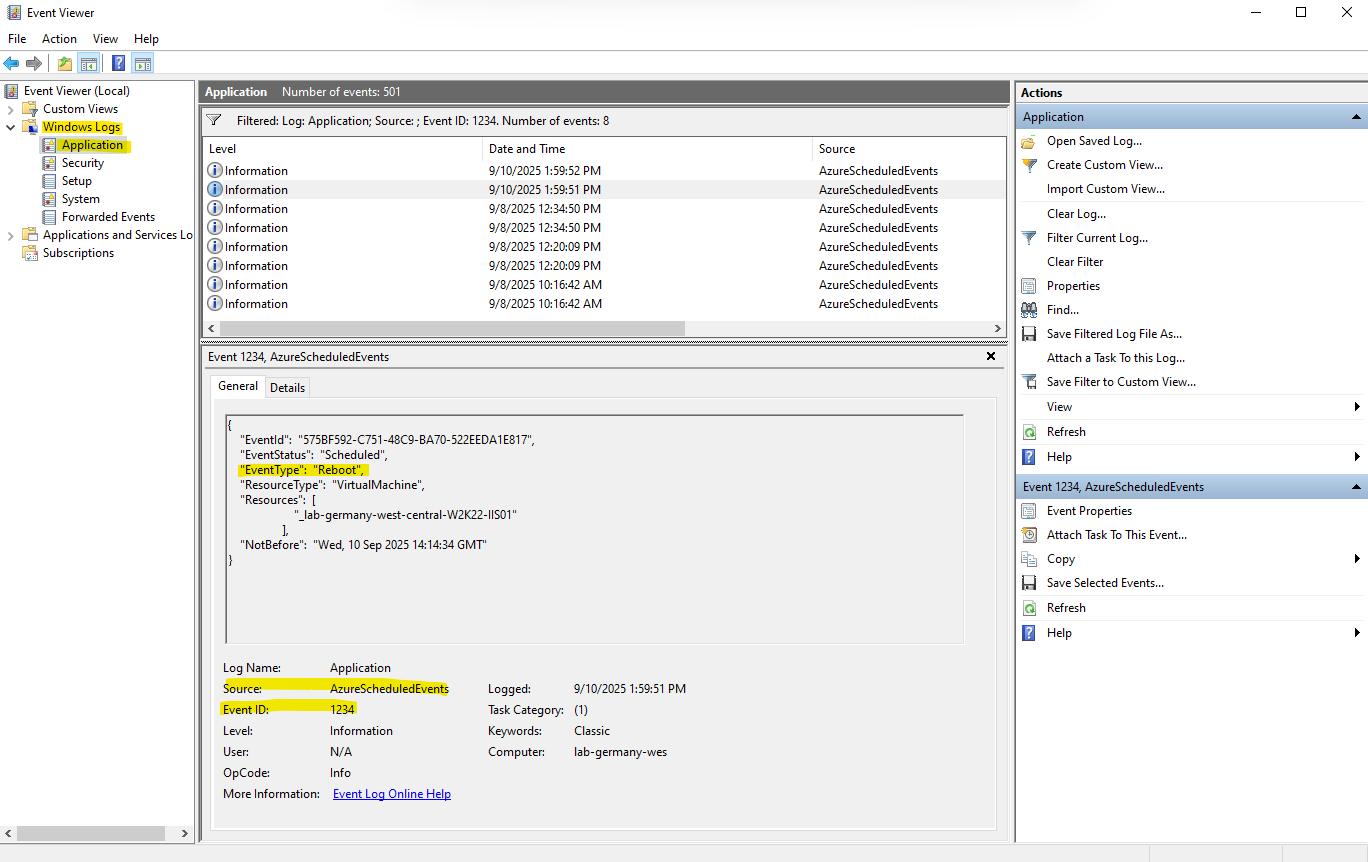
When any of the above events are captured by Schedule Event service, it will get logged in the Application Event Log Event Status, Event Type, Resources (Virtual machine names) and NotBefore (minimum notice period). You can locate the events with ID 1234 in the Application Event Log.
Once the service is set up and started, it will log events in the Windows Application logs.
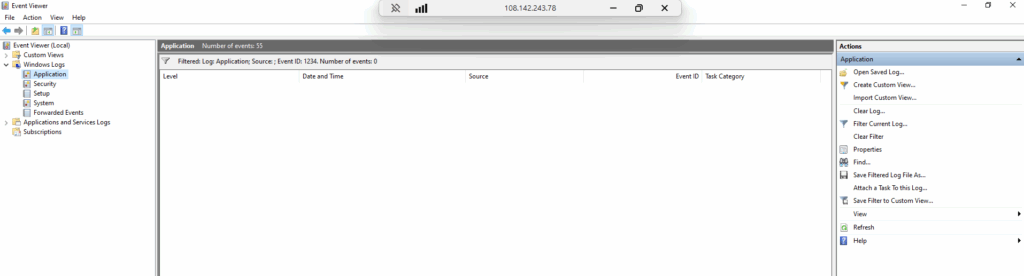
To verify this works, restart one of the virtual machines in the availability set and you should see an event being logged in Event viewer in Windows Logs > Application log showing the VM restarted.
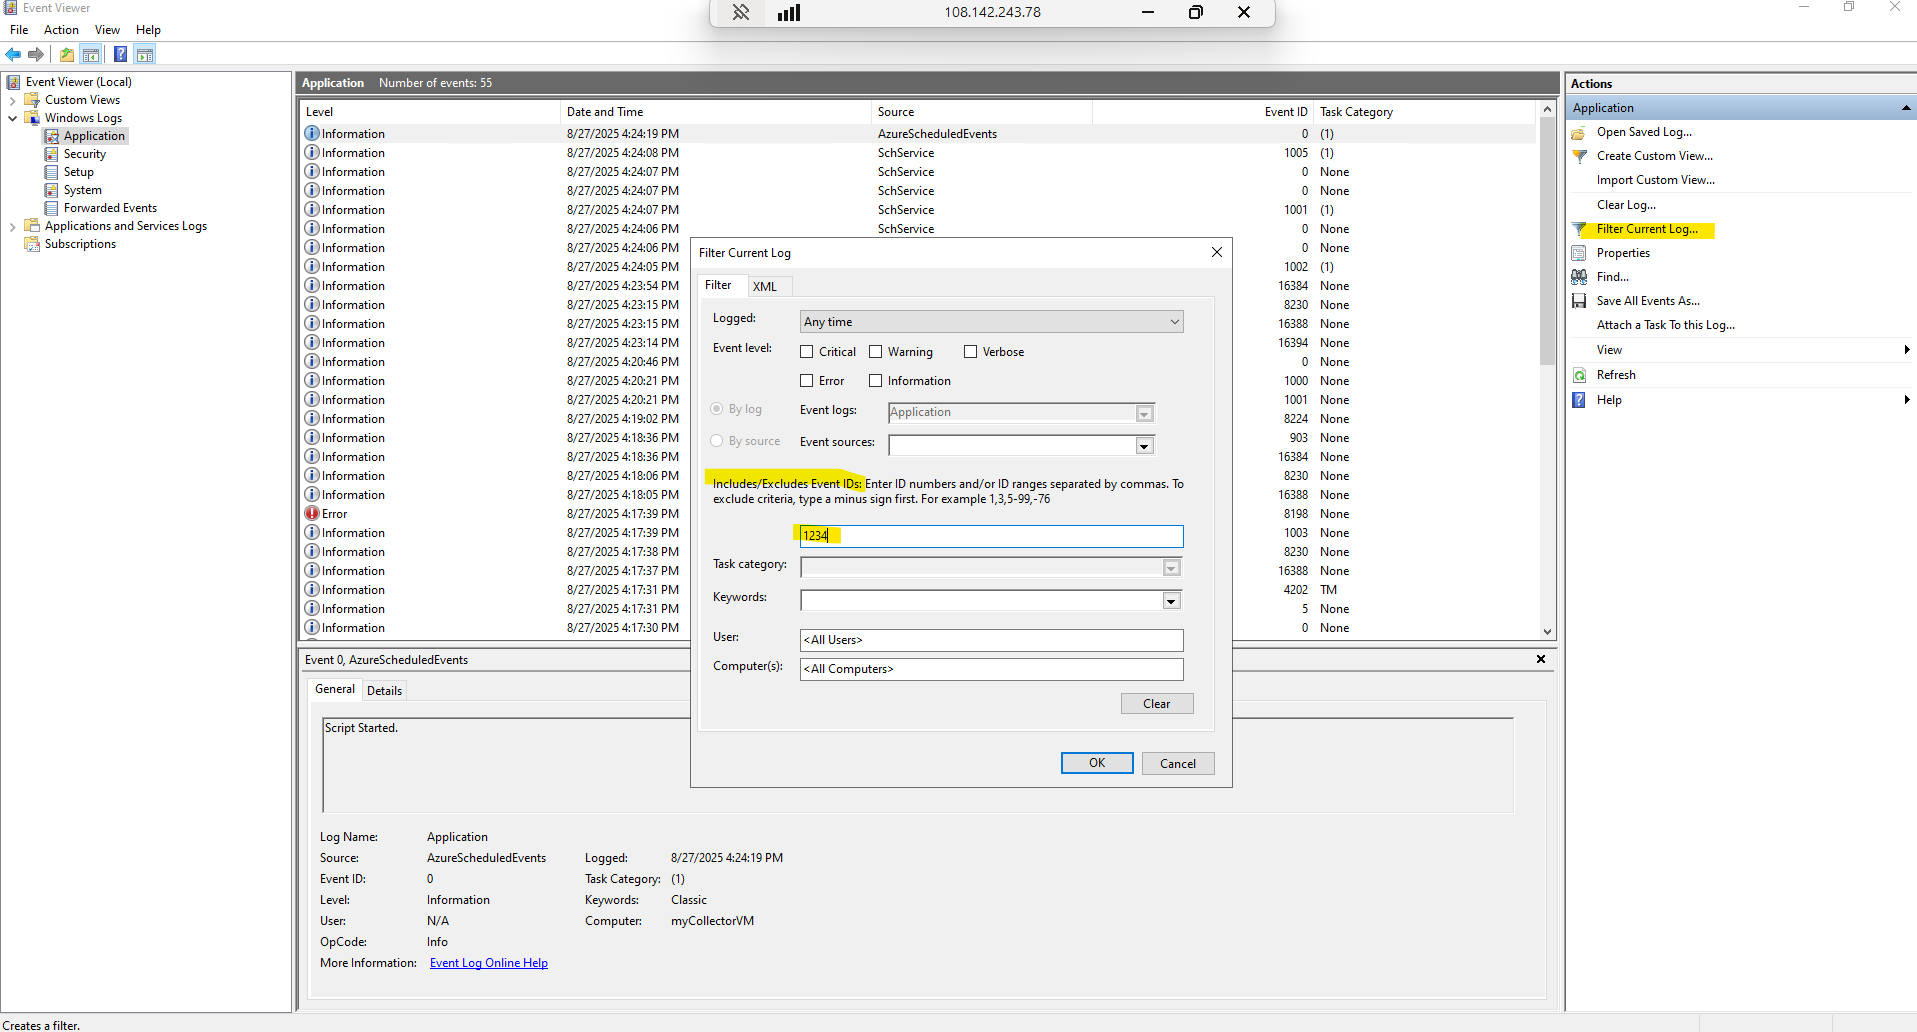
So far no events are logged.
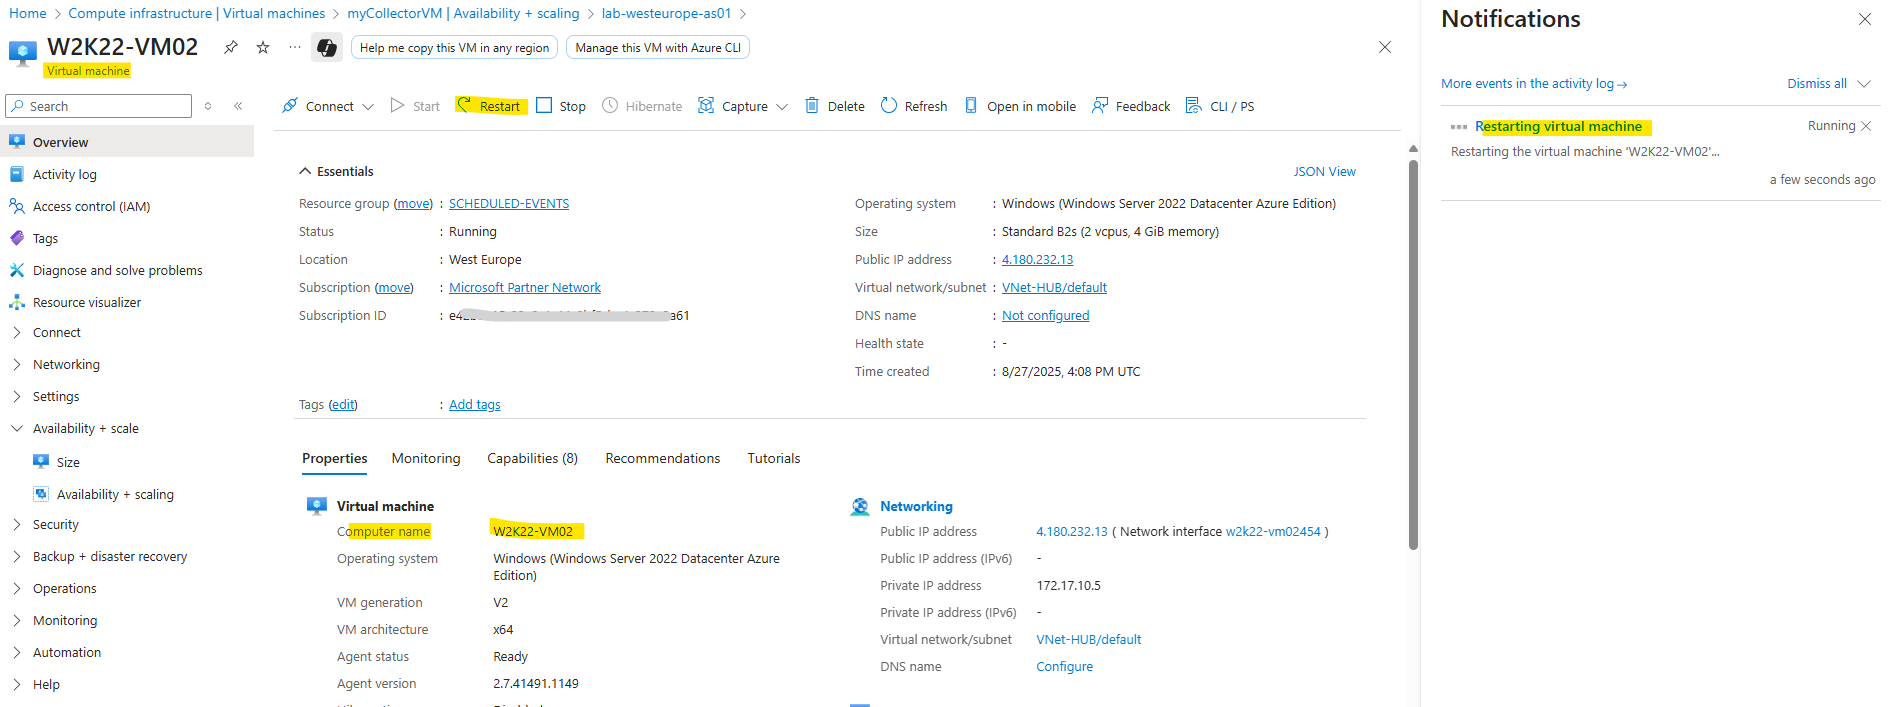
I will now restart the W2K22-VM02.
When events are captured by the Schedule Event service, it will get logged in the application event log with Event Status, Event Type, Resources (VM name) and NotBefore (minimum notice period). You can locate the events with ID 1234 in the Application Event Log.
In this example, the virtual machines are in an availability set, which enabled us to designate a single virtual machine as the collector to listen and route scheduled events to our log analytics works space.
If you have standalone virtual machines, you can run the service on every virtual machine, and then connect them individually to your log analytics workspace.
For our set up, we chose Windows, but you can design a similar solution on Linux.
At any point you can stop/remove the Scheduled Event Service by using the switches –stop and –remove.
Connect to the Log Analytics Workspace
We now want to connect a Log Analytics Workspace to the collector VM. The Log Analytics workspace acts as a repository and we will configure event log collection to capture the application logs from the collector VM.
To route the Scheduled Events to the Events Log, which is saved as Application log by our service, you will need to connect your virtual machine to your Log Analytics workspace.
Set up data collection
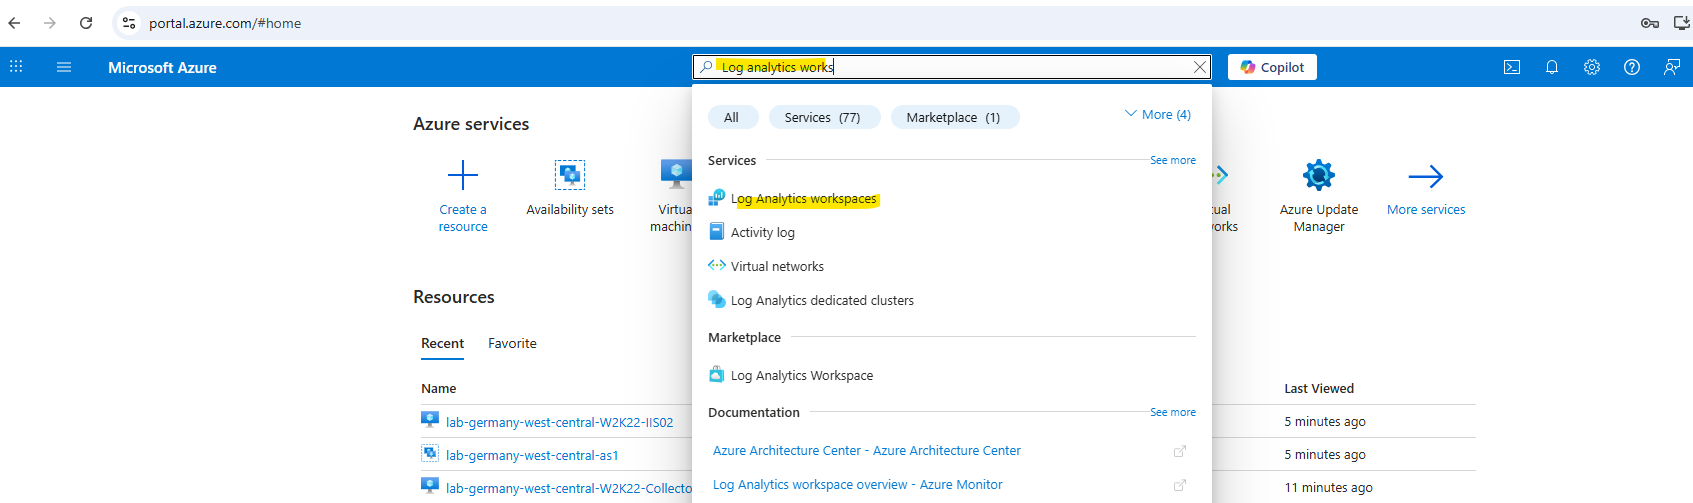
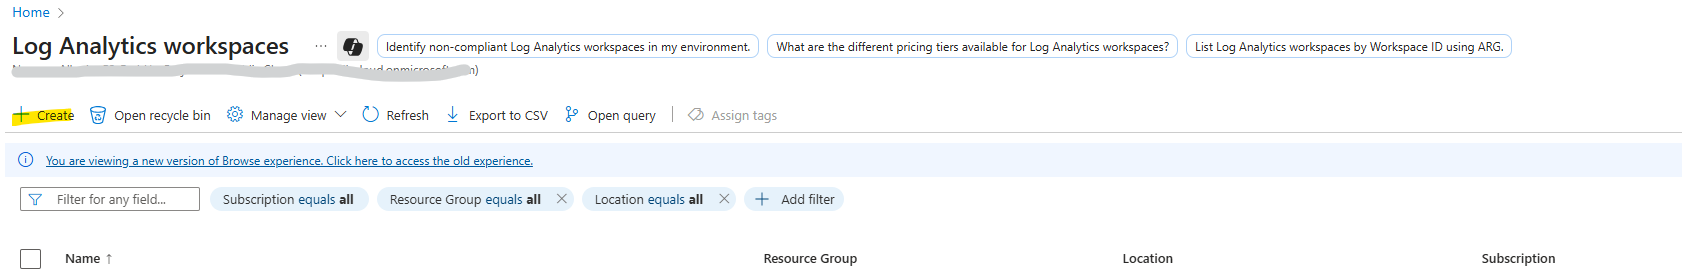
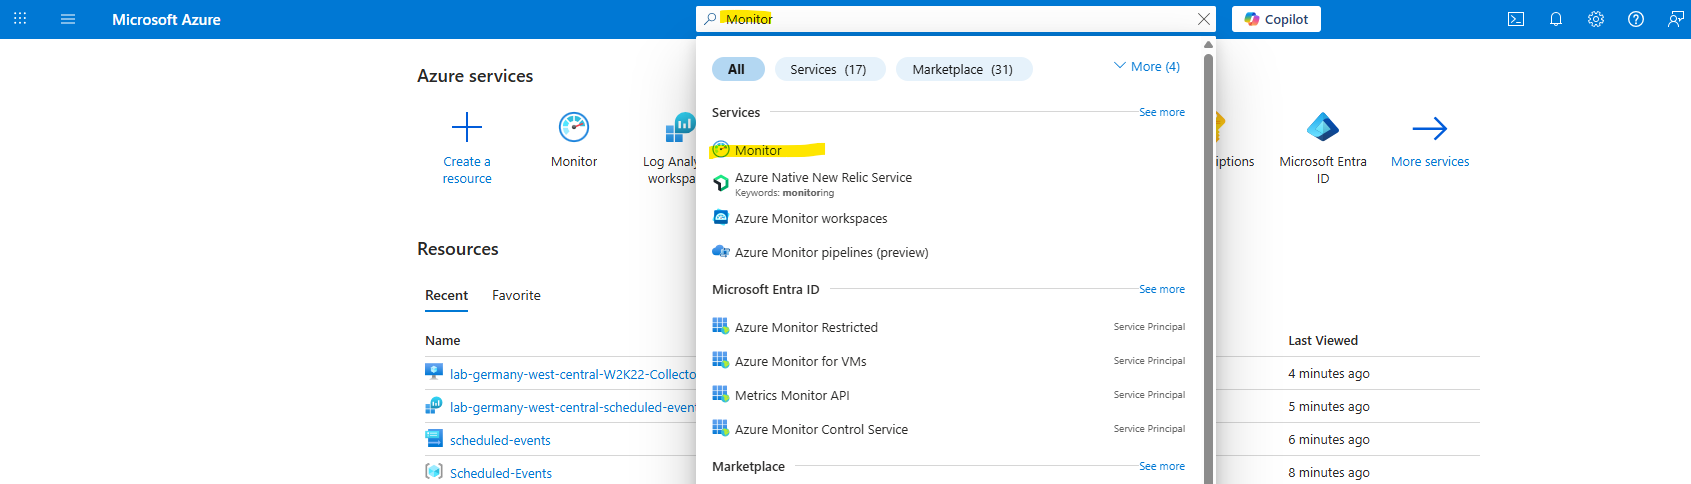
In the Azure portal search for Log Analytics Workspaces.
We also need to create a new Log Analytics workspace for.
Create a Log Analytics workspace
https://learn.microsoft.com/en-us/azure/azure-monitor/logs/quick-create-workspace
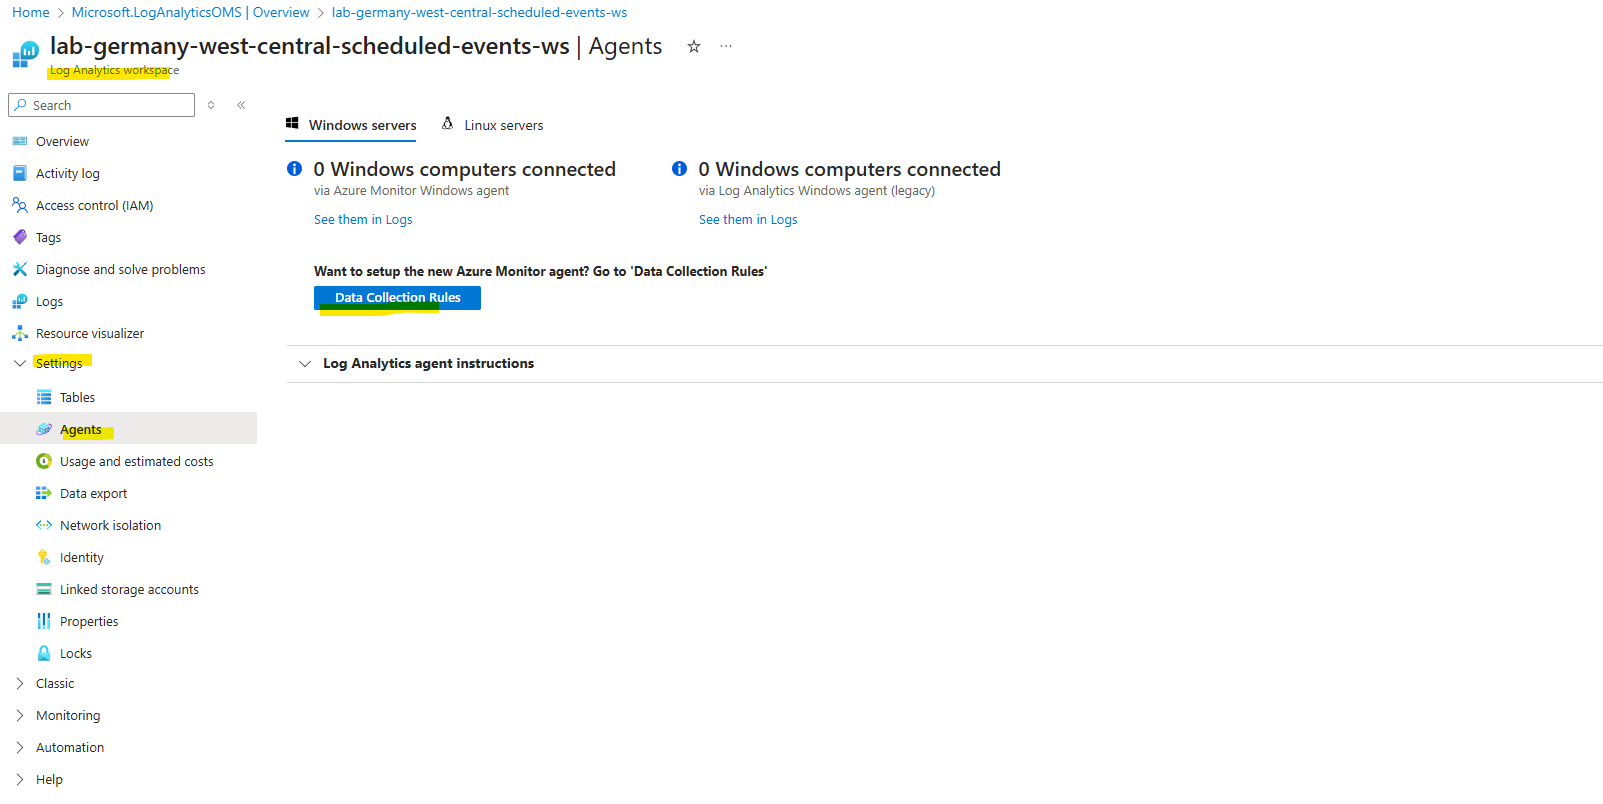
Under Settings -> Agents -> Windows servers tab click on Data Collection Rules.
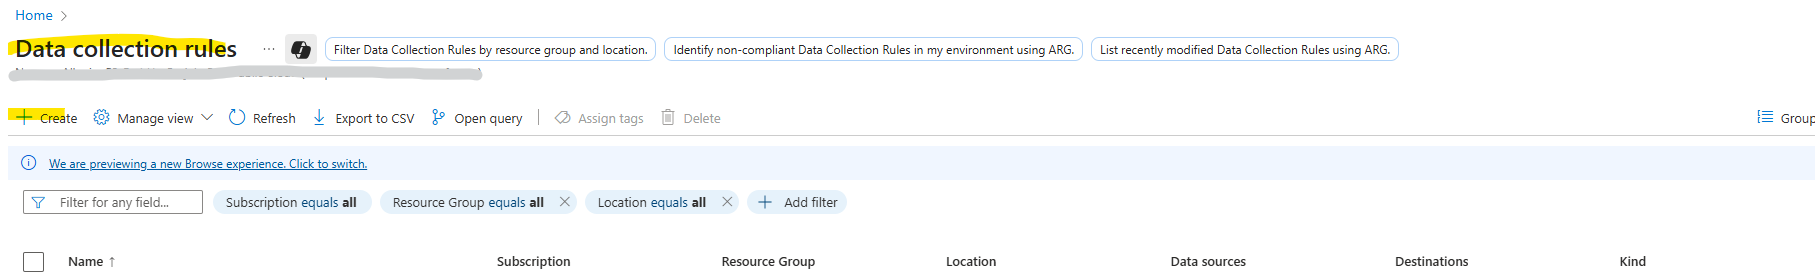
Click on Create.
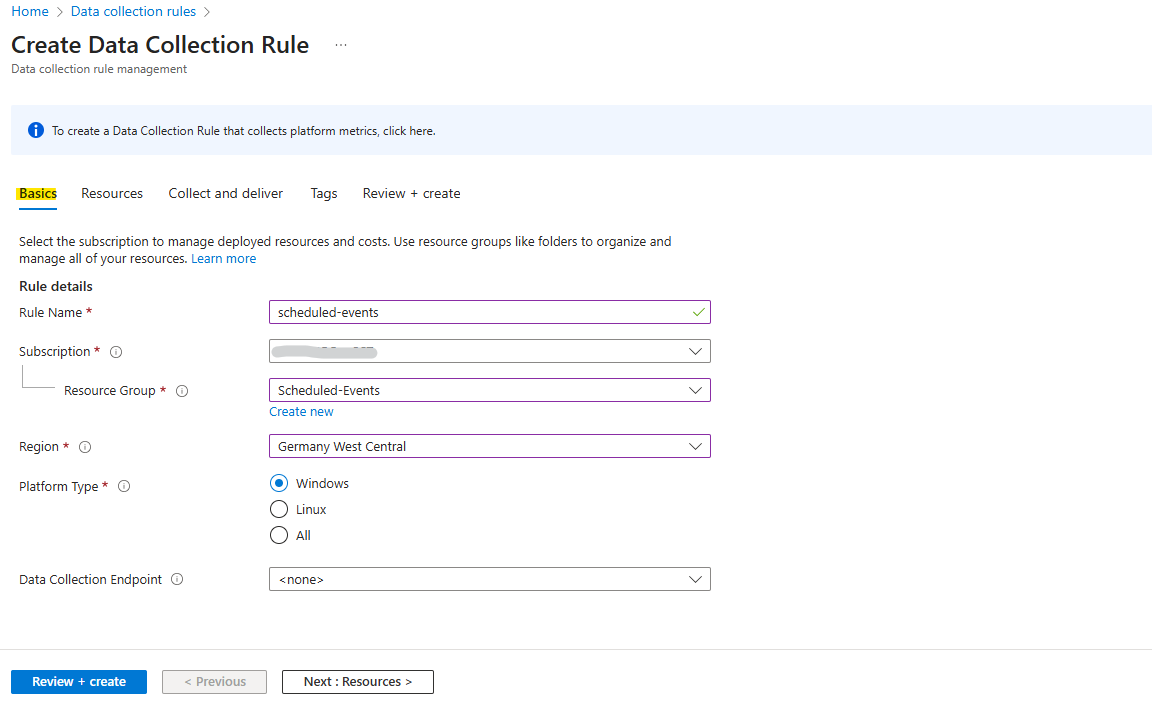
For the scope select our collector VM.
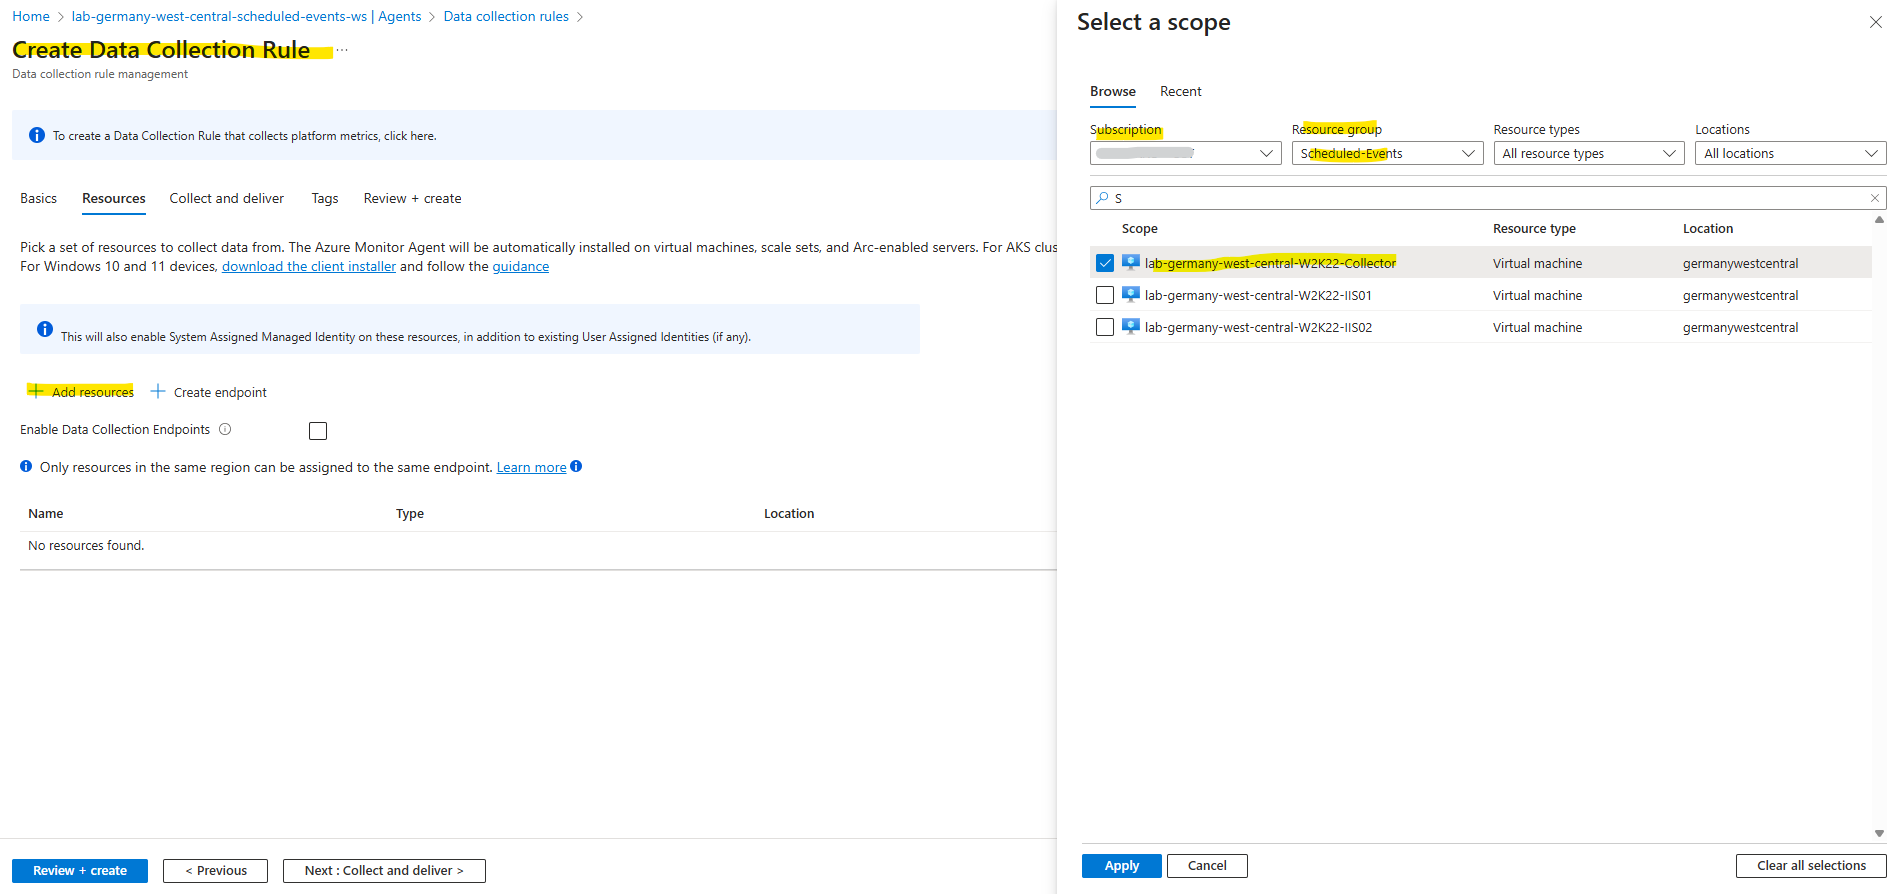
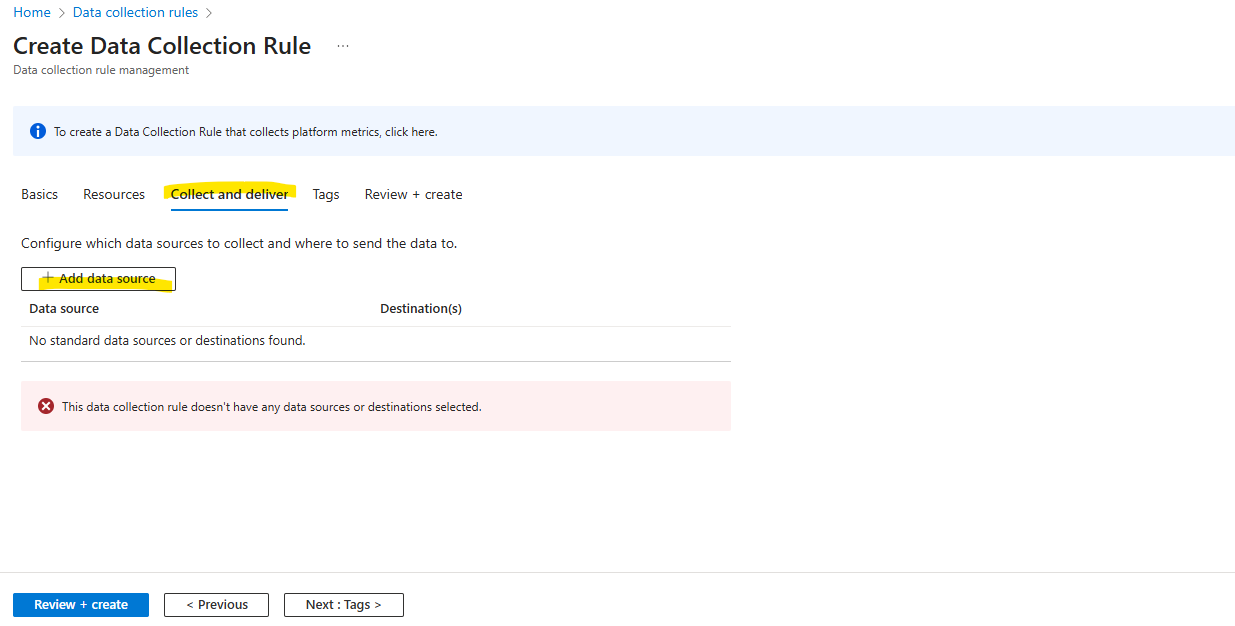
Click on + Add data source.
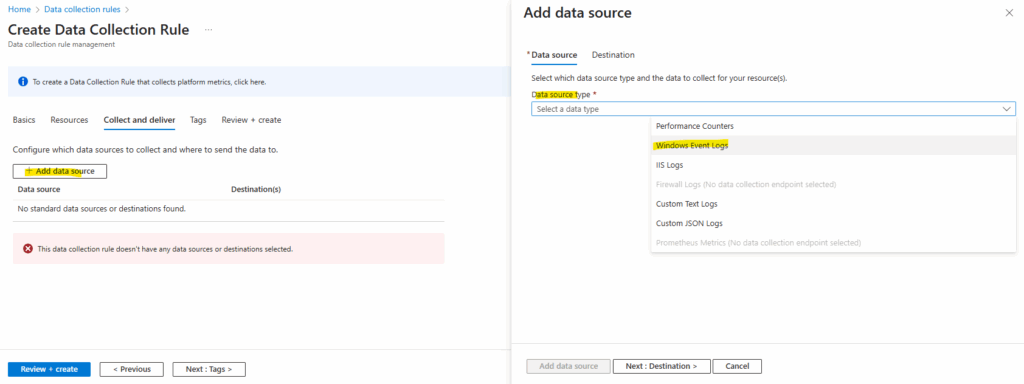
Select Windows Event Logs.
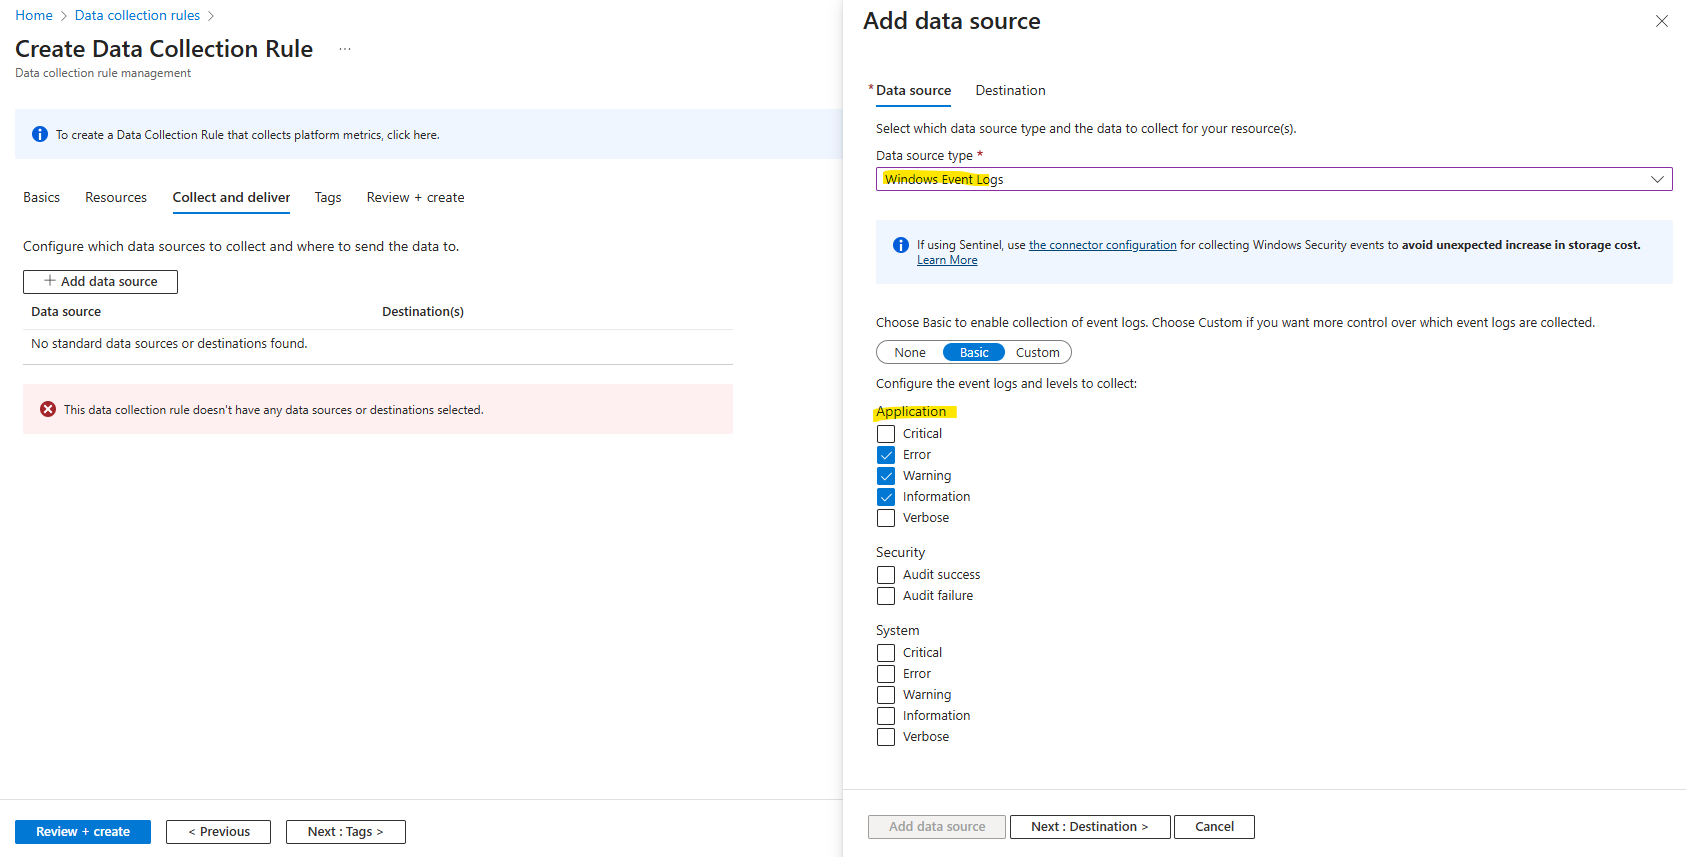
Select the event logs you’d like to collect. Ensure that ERROR, WARNING, and INFORMATION are selected.
Click Next : Destination >
Under the Destination tab, click Add destination.
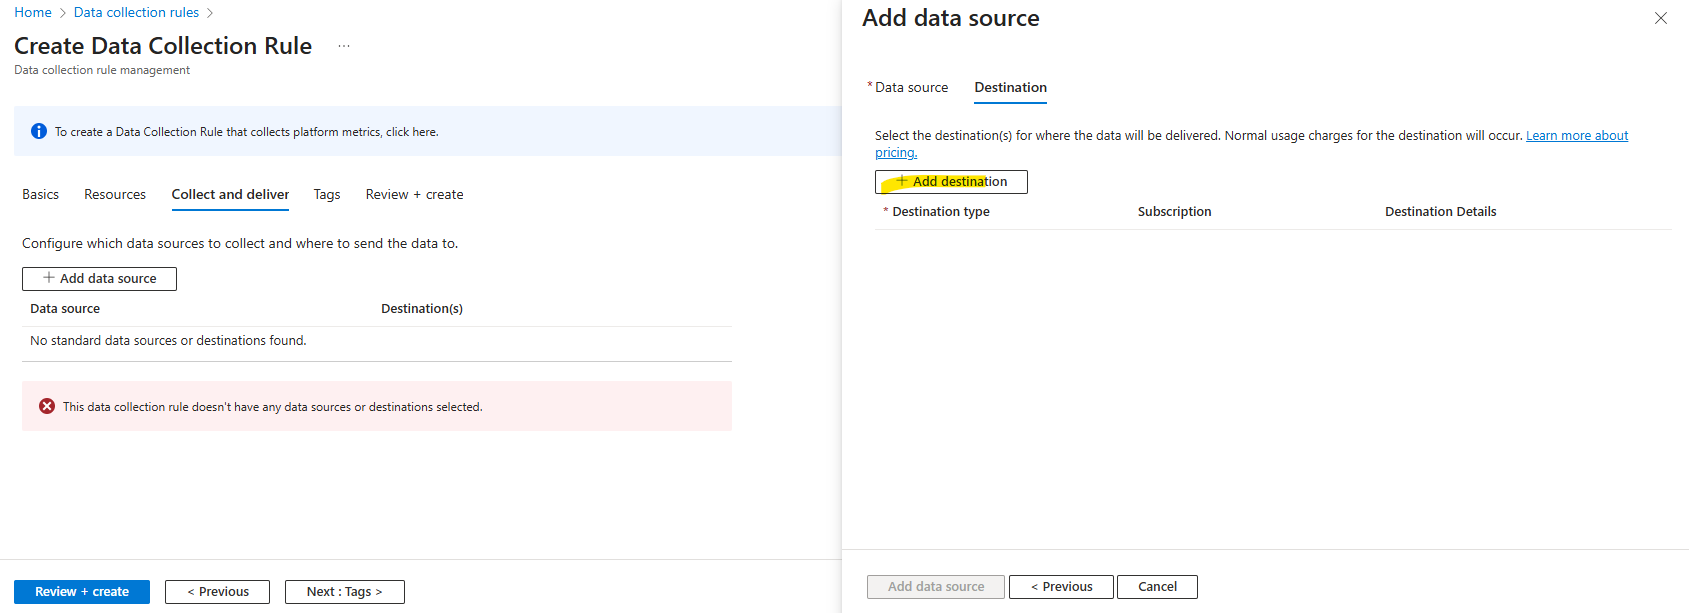
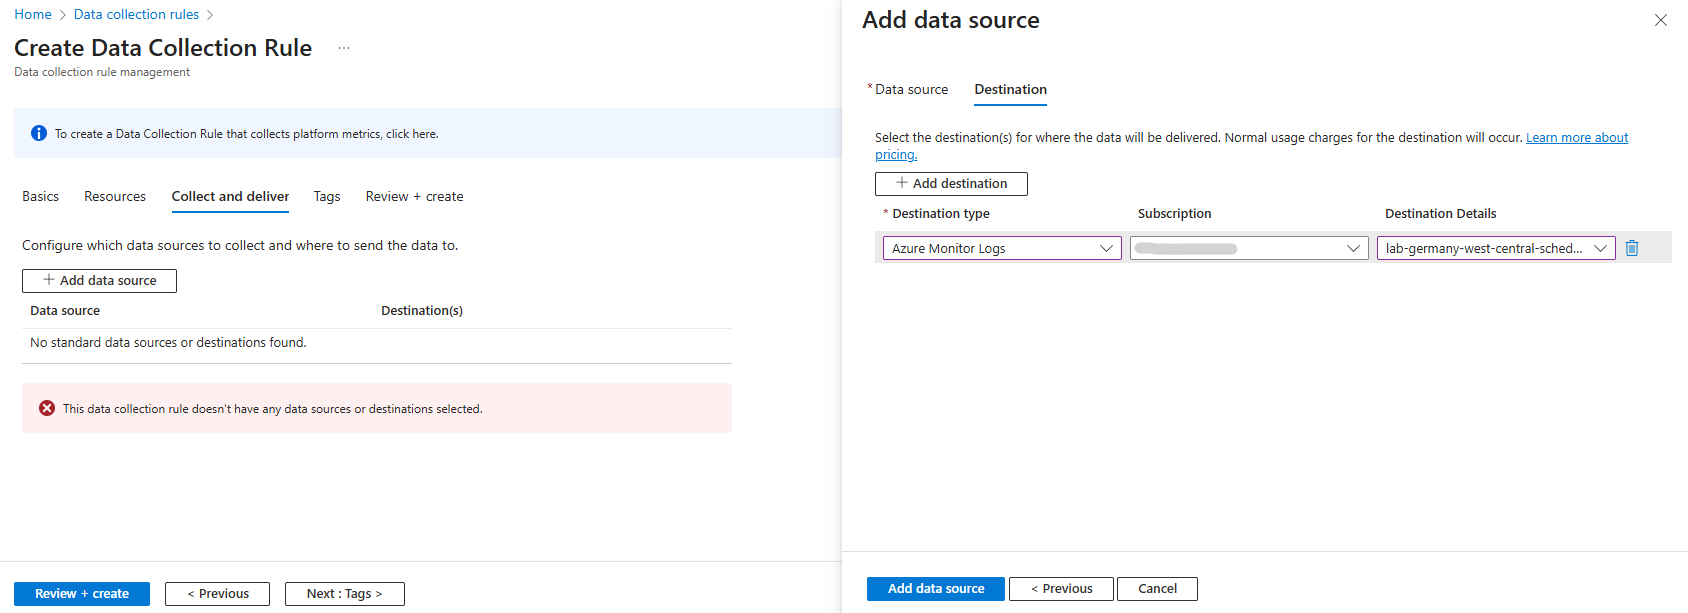
Fill out the Destination Type, Subscription, and Destination Details sections with your collector VM and its subscription’s details.
Click on Add data source.
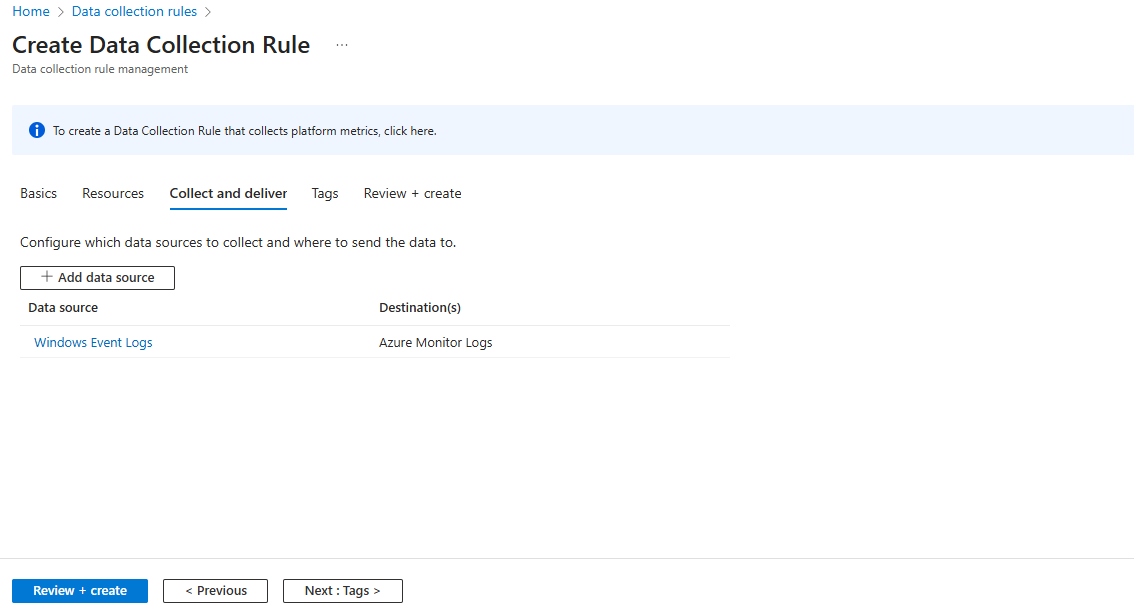
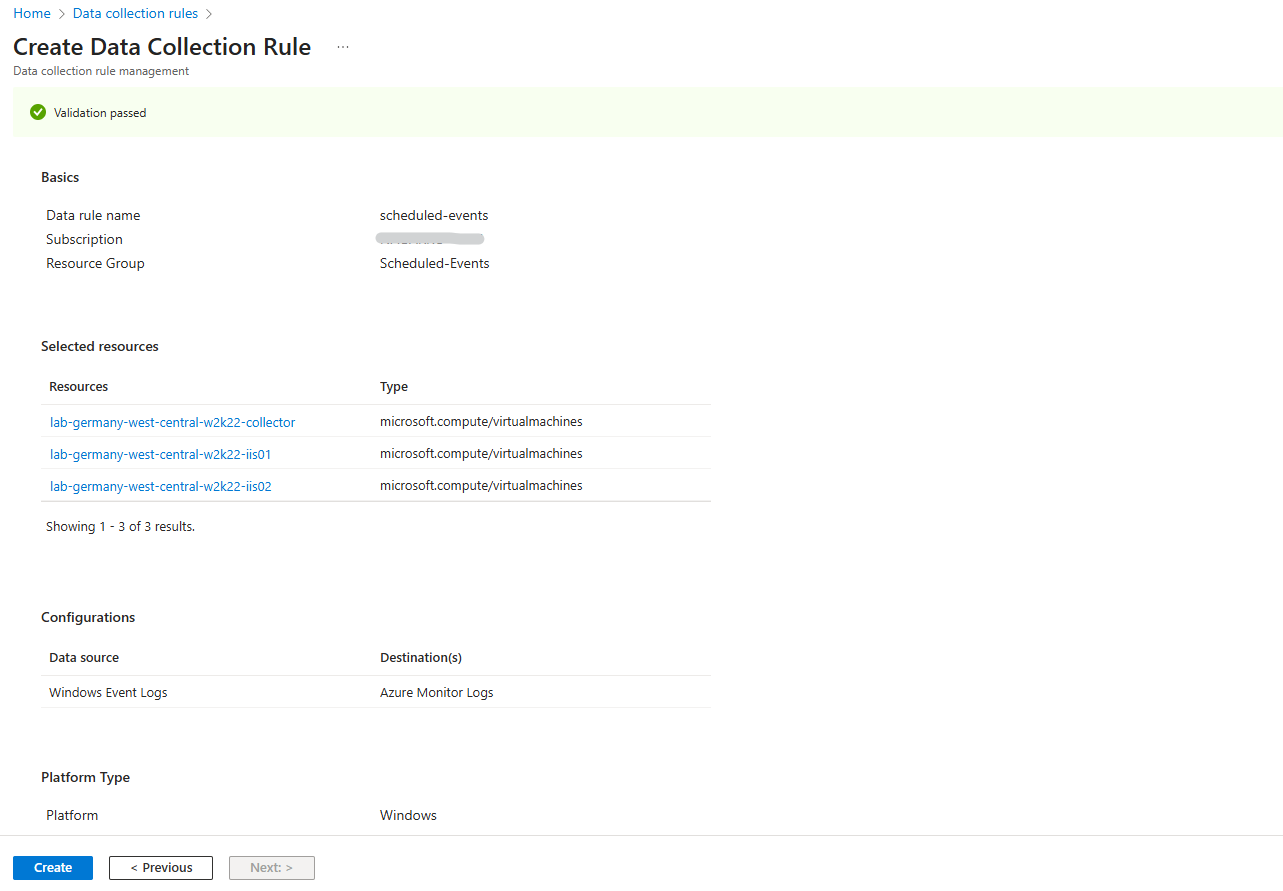
Finally click on Create.
Once you’ve selected the correct VM, the Microsoft Monitoring agent will be automatically installed on your virtual machine. It will take a few minutes to connect your VM to the workspace and install the extension.
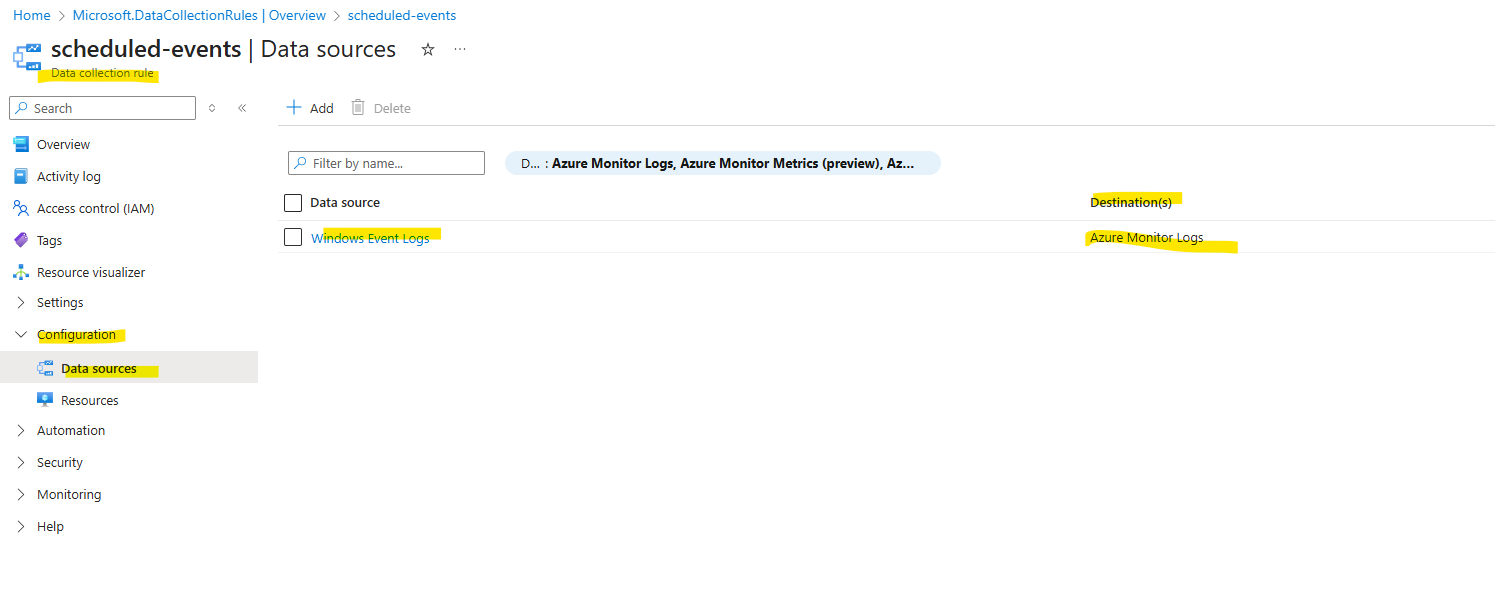
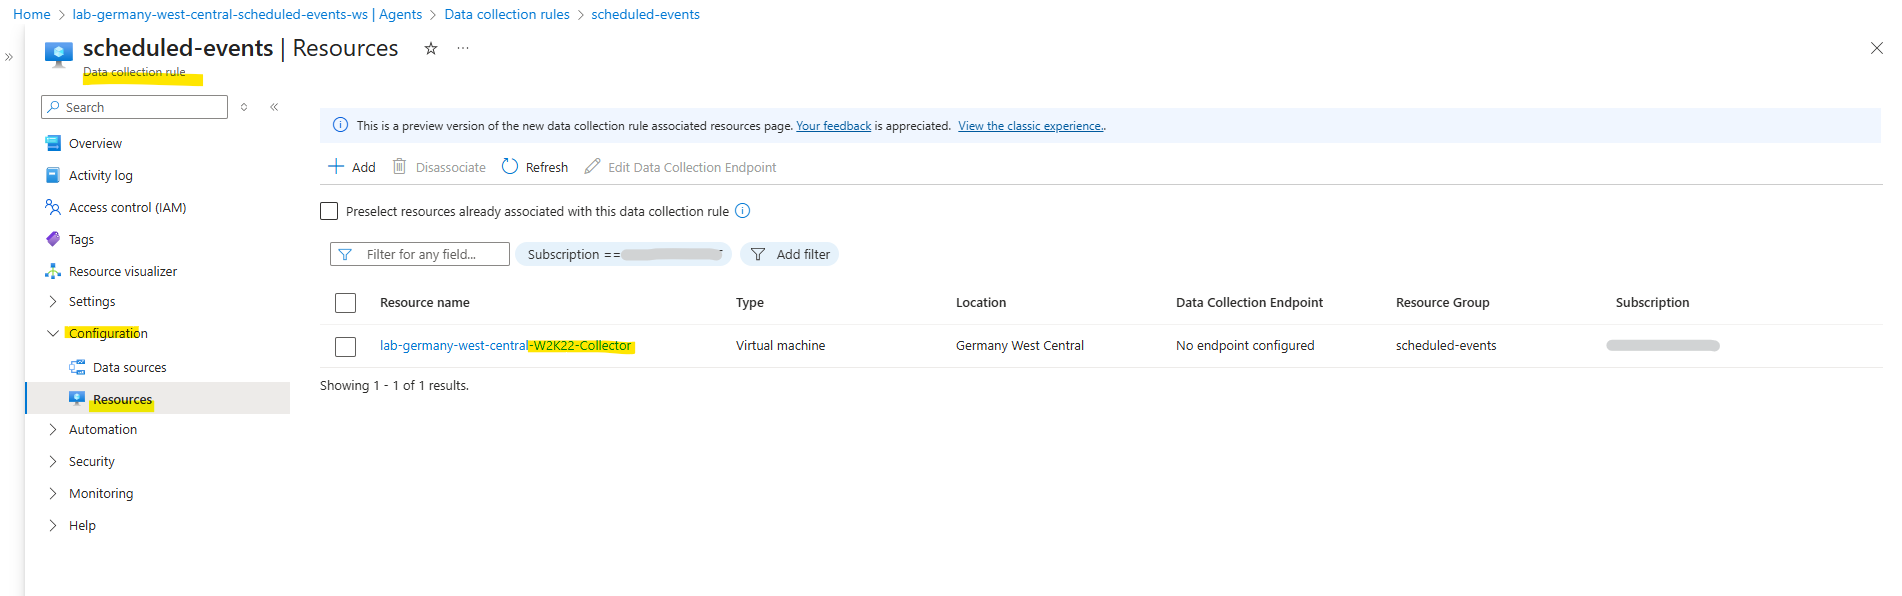
For the data collection rule we can also anytime associate or disassociate other virtual machines under Configuration -> Resources.
Creating an alert rule with Azure Monitor
Once the events are pushed to Log Analytics, you can run the following query to look for the schedule Events.
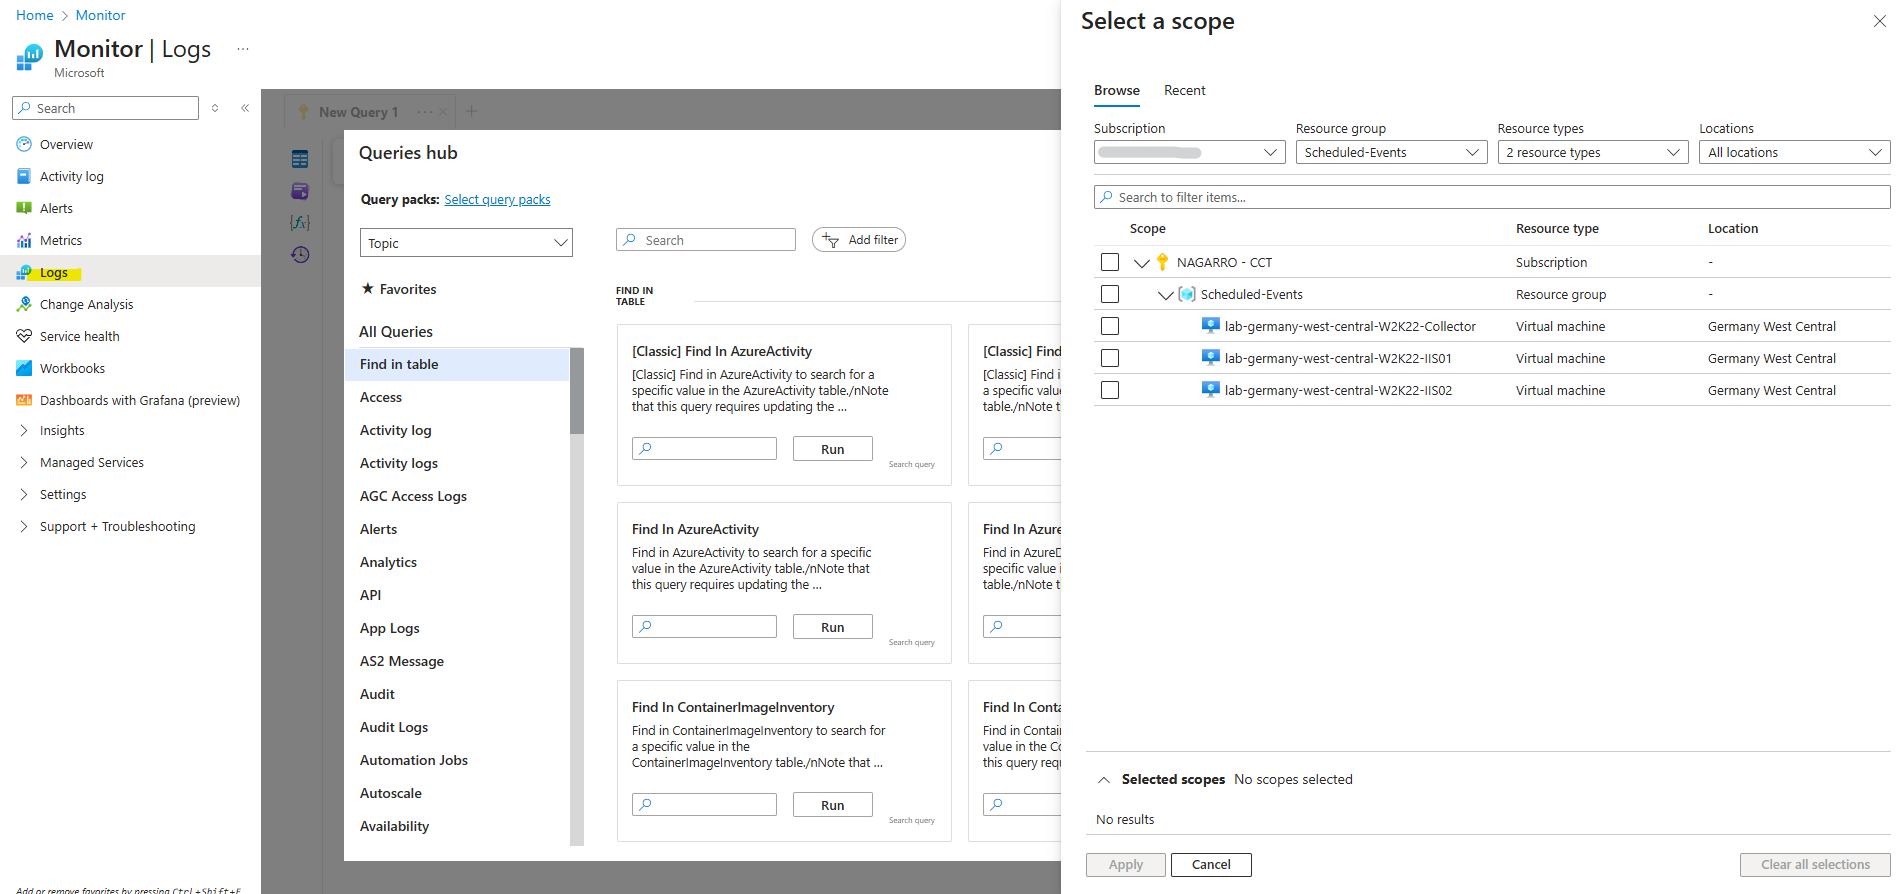
Open the Log Analytics demo environment, or select Logs from the Azure Monitor menu in your subscription.
This step sets the initial scope to a Log Analytics workspace so that your query selects from all data in that workspace. If you select Logs from an Azure resource’s menu, the scope is set to only record from that resource. For more information, see Log query scope.
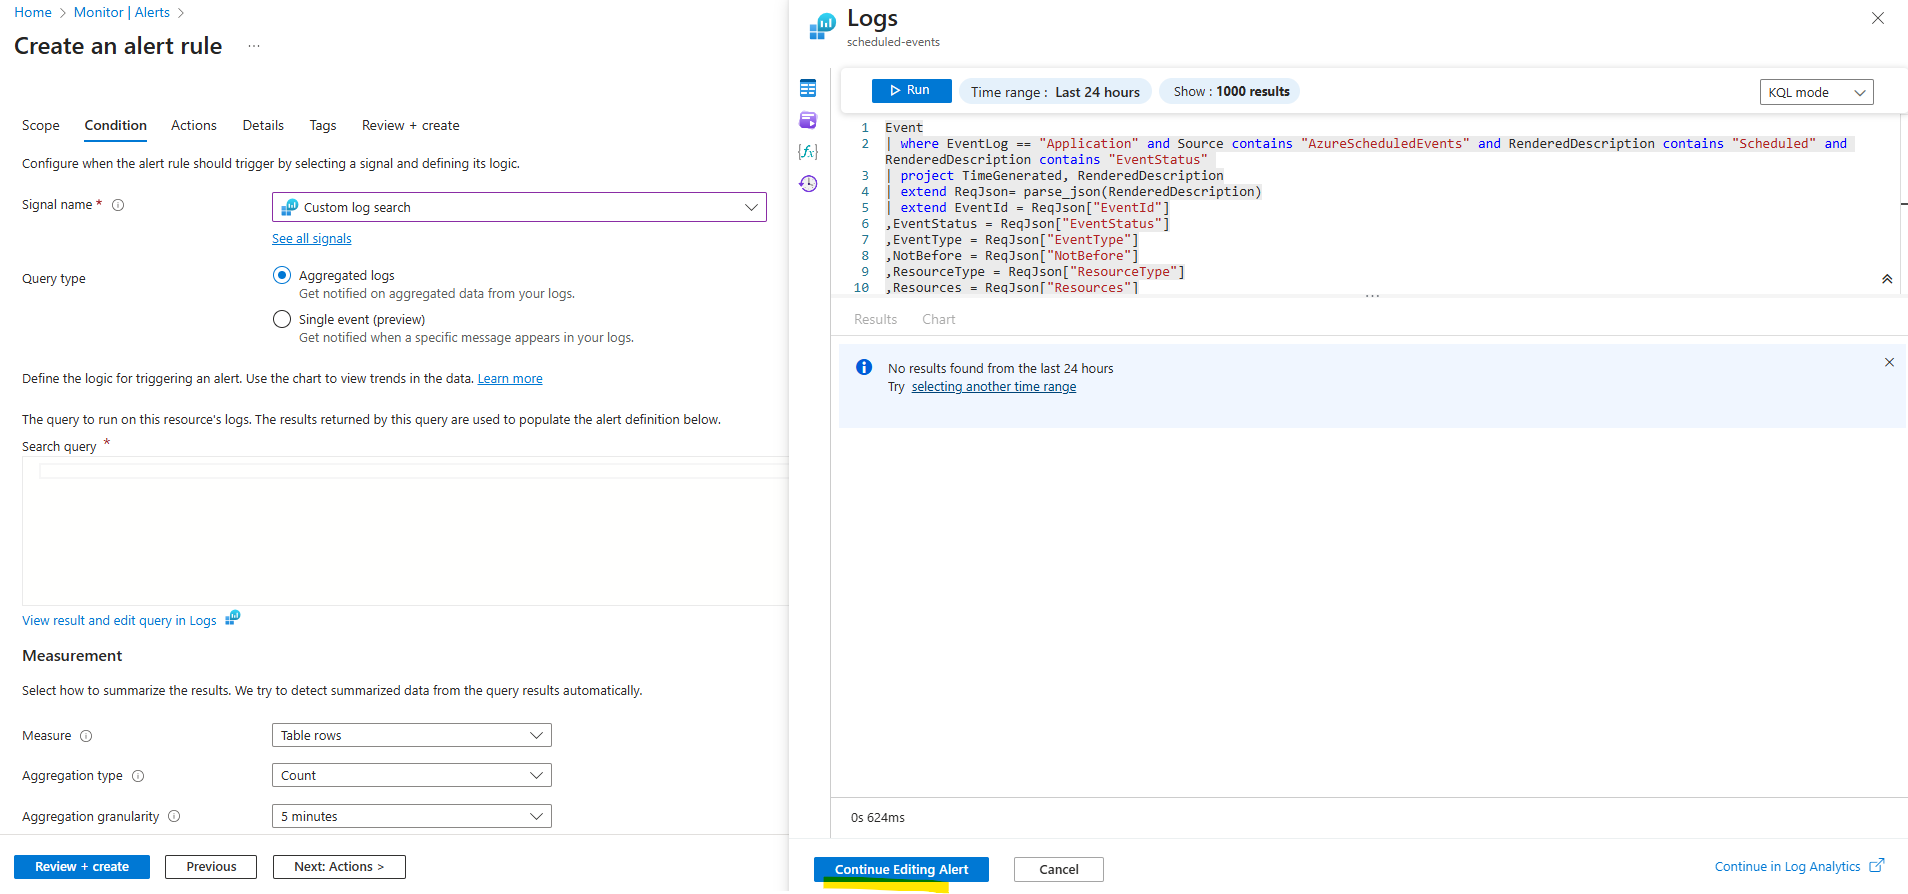
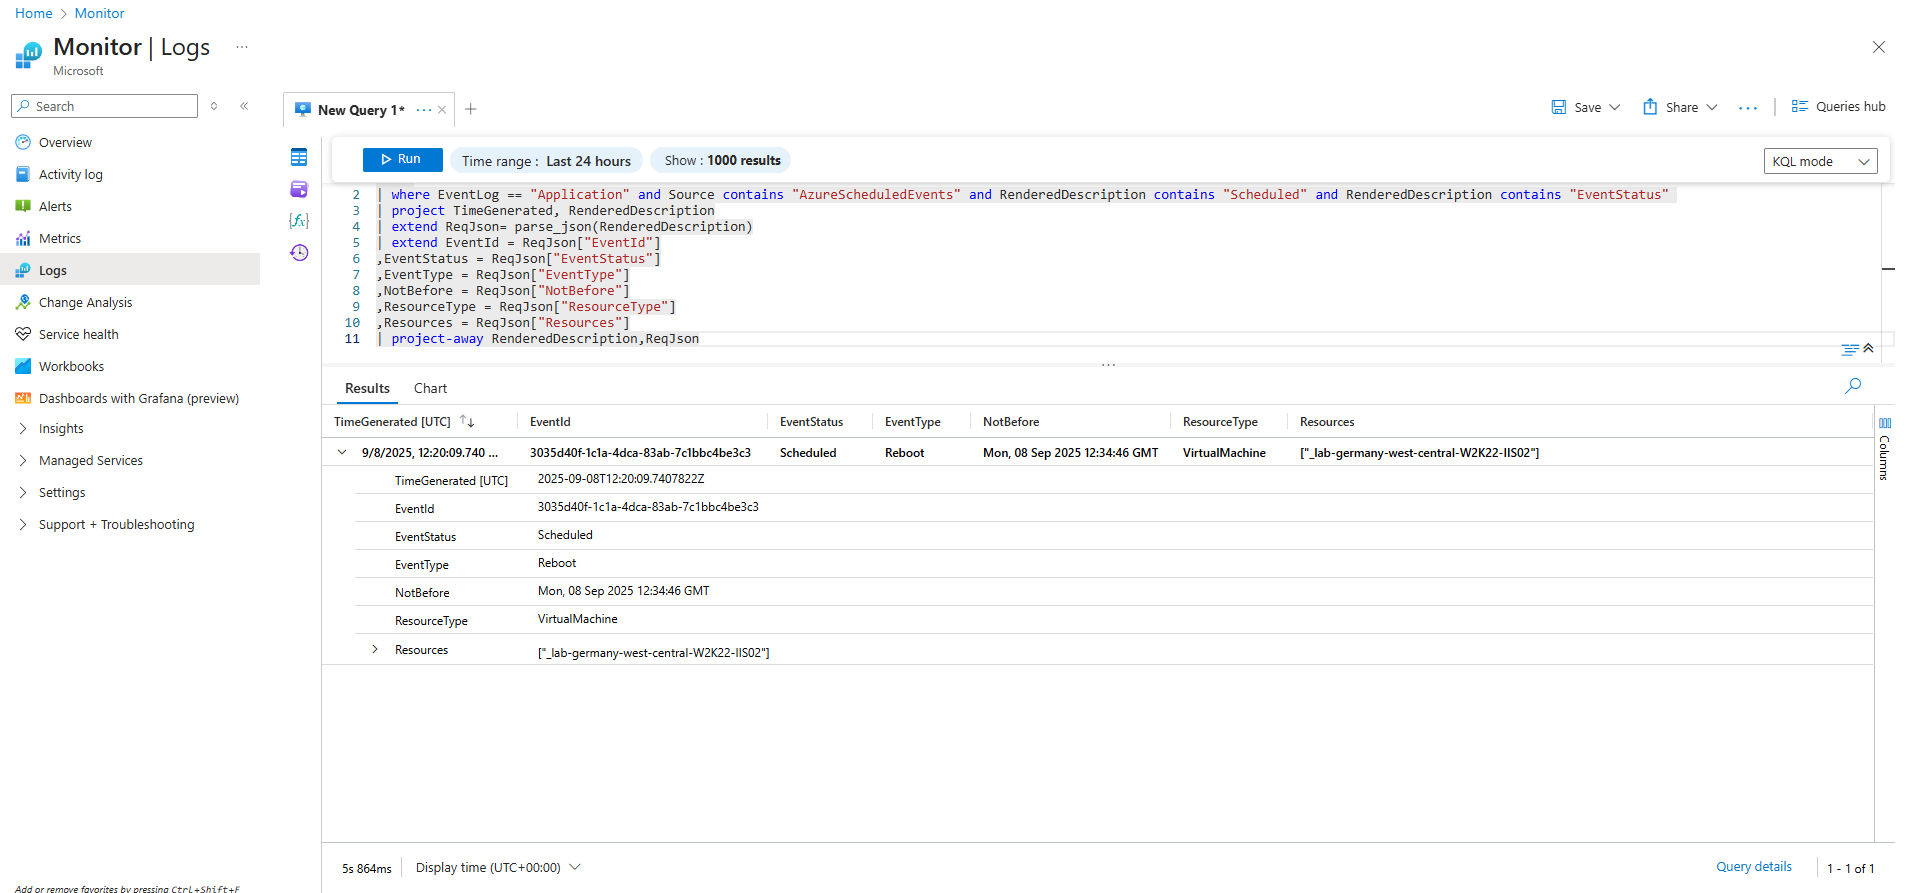
At the top of the page, select Logs and paste the following into the text box. (but first we need to switch on the right side to KQL mode.)
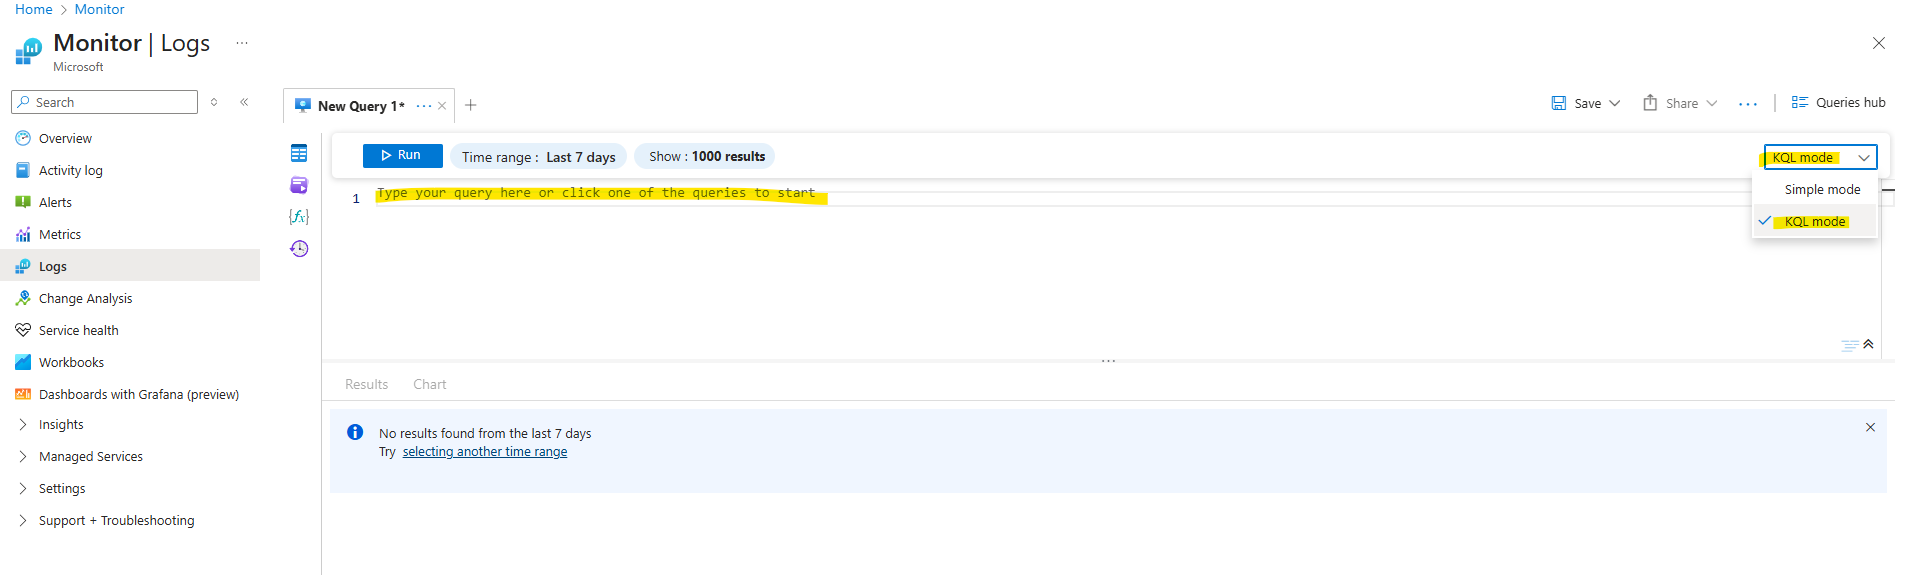
Event
| where EventLog == "Application" and Source contains "AzureScheduledEvents" and RenderedDescription contains "Scheduled" and RenderedDescription contains "EventStatus"
| project TimeGenerated, RenderedDescription
| extend ReqJson= parse_json(RenderedDescription)
| extend EventId = ReqJson["EventId"]
,EventStatus = ReqJson["EventStatus"]
,EventType = ReqJson["EventType"]
,NotBefore = ReqJson["NotBefore"]
,ResourceType = ReqJson["ResourceType"]
,Resources = ReqJson["Resources"]
| project-away RenderedDescription,ReqJson
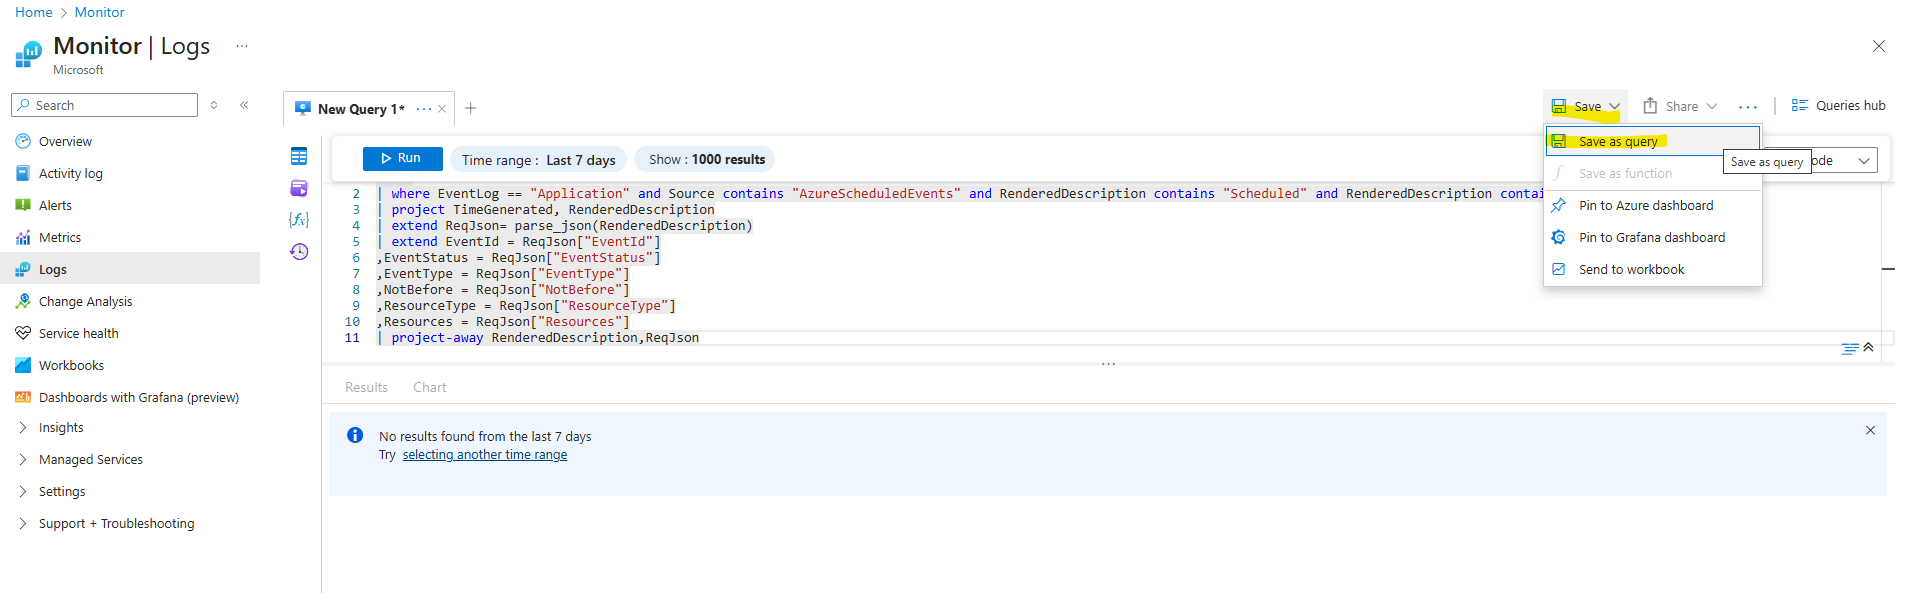
Select Save as query.
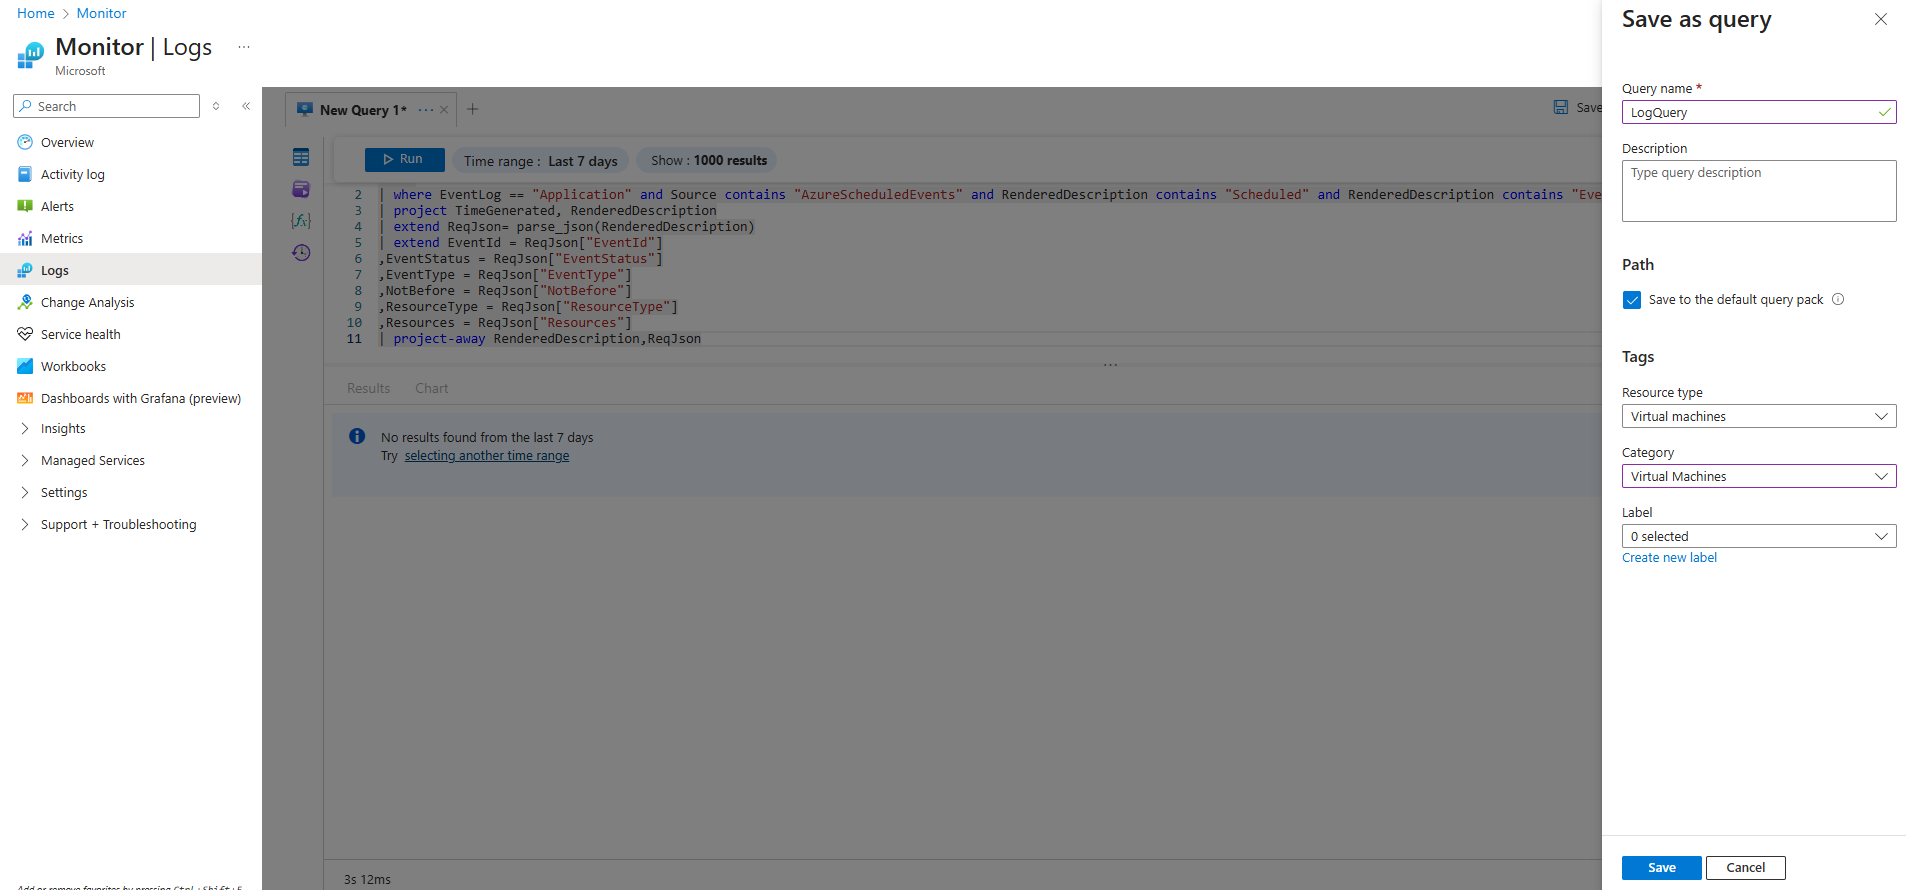
Enter LogQuery for the name and Virtual Machine for resource type and category, select Save.
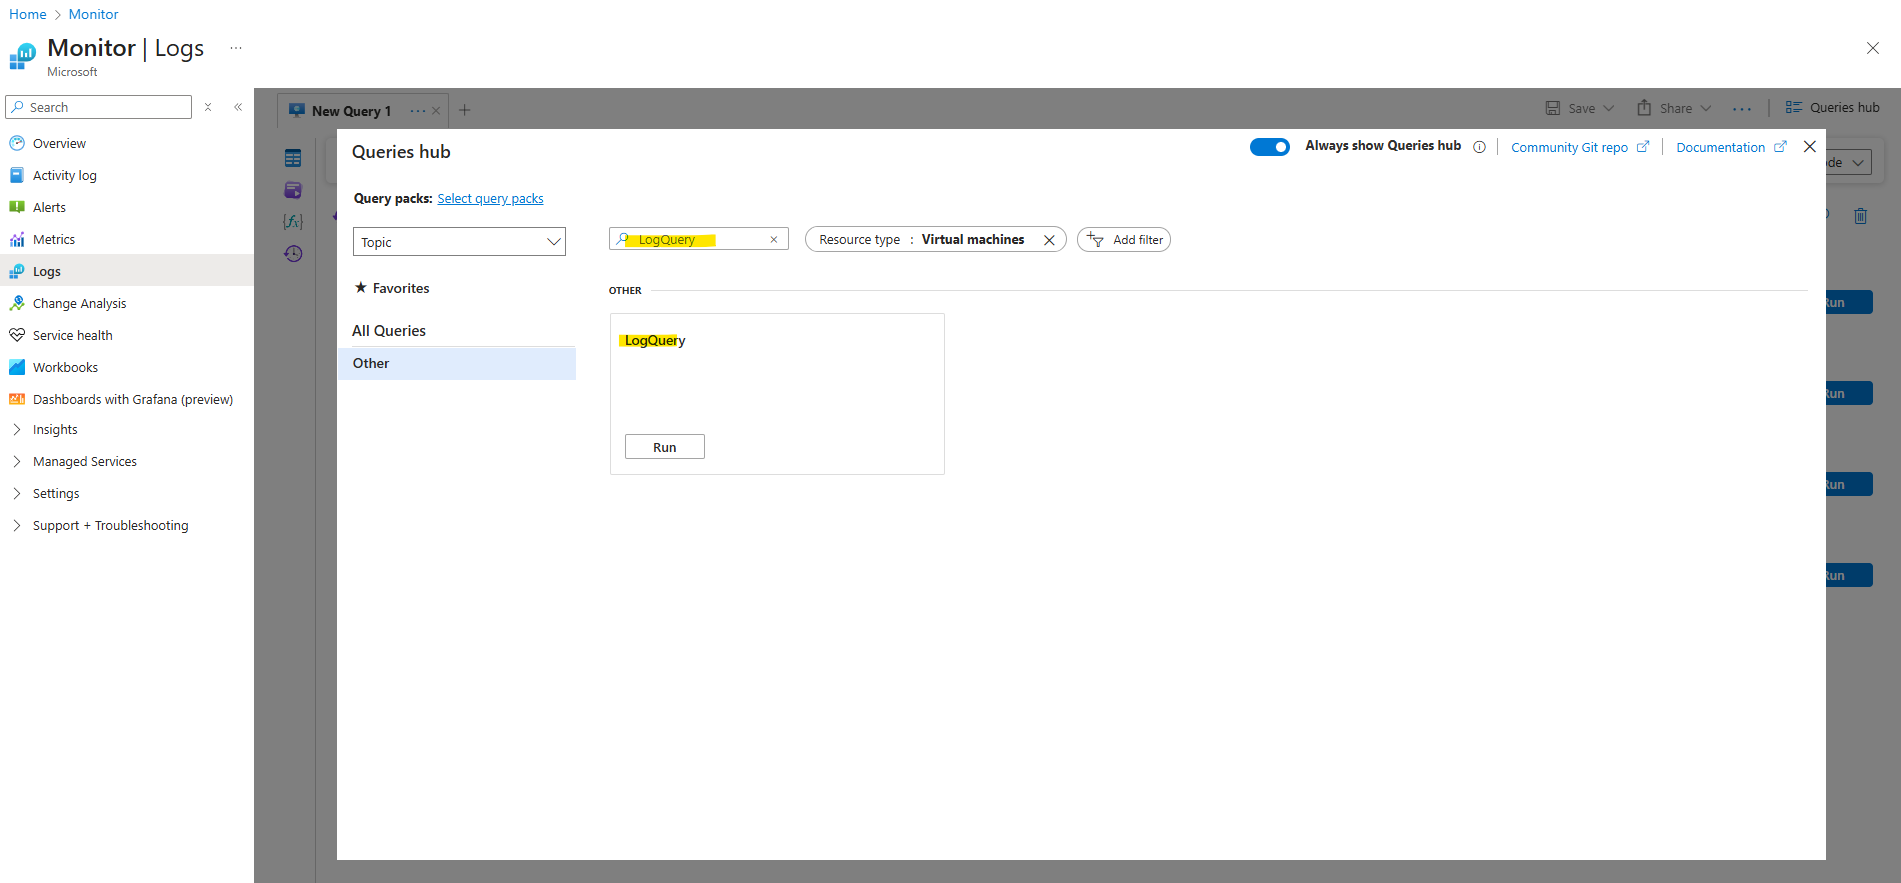
We will now find this query directly under Logs.
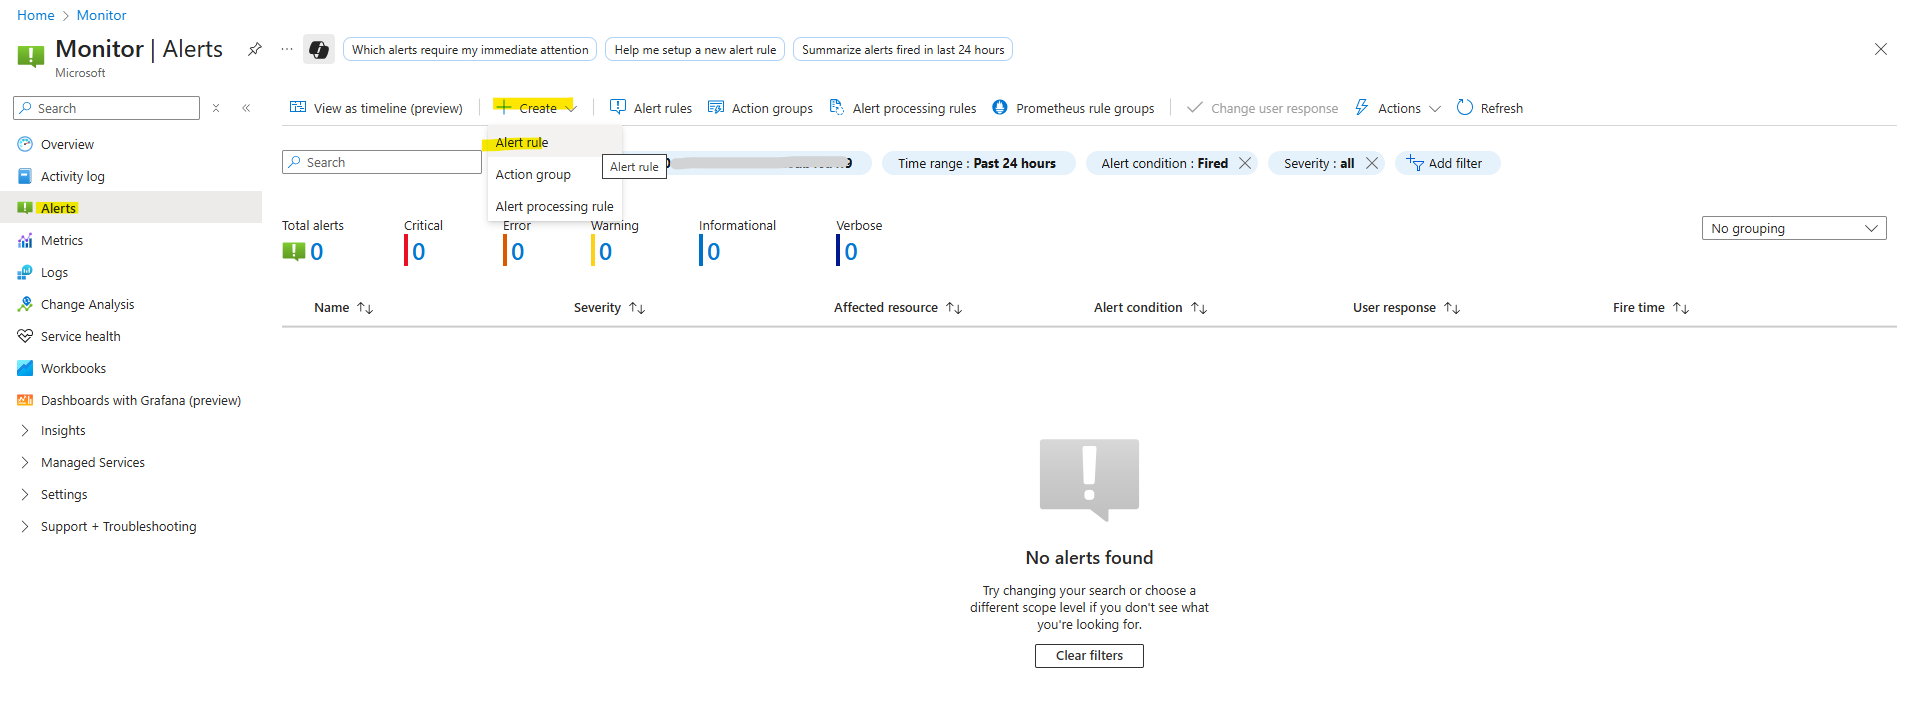
Next we will create a new alert rule.
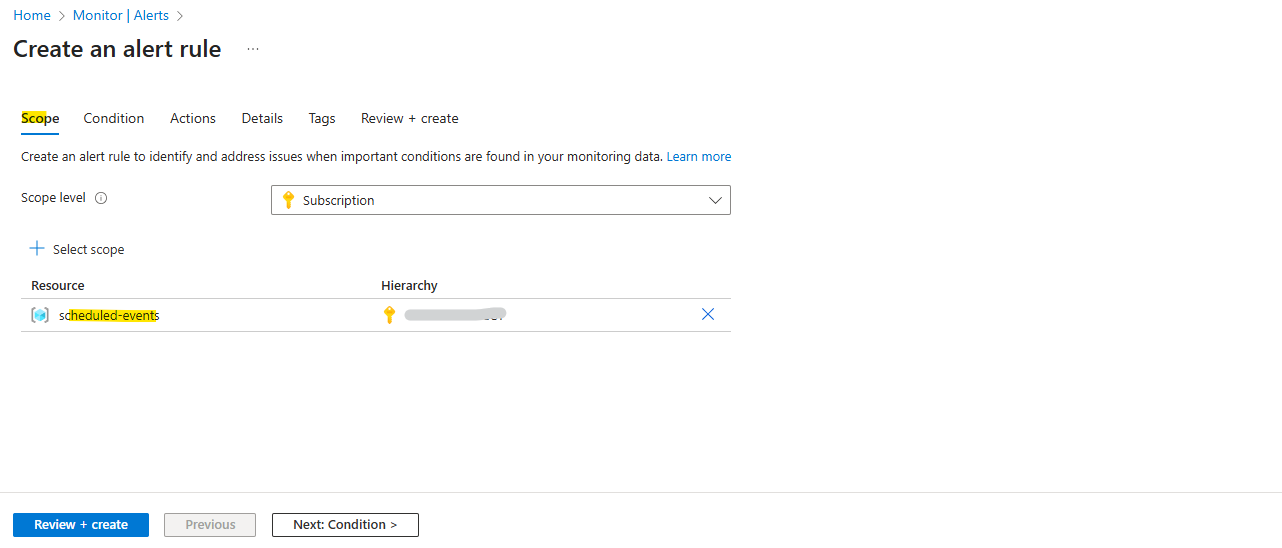
For the scope I will select my resource group including the virtual machines and Log Analytics Workspace.
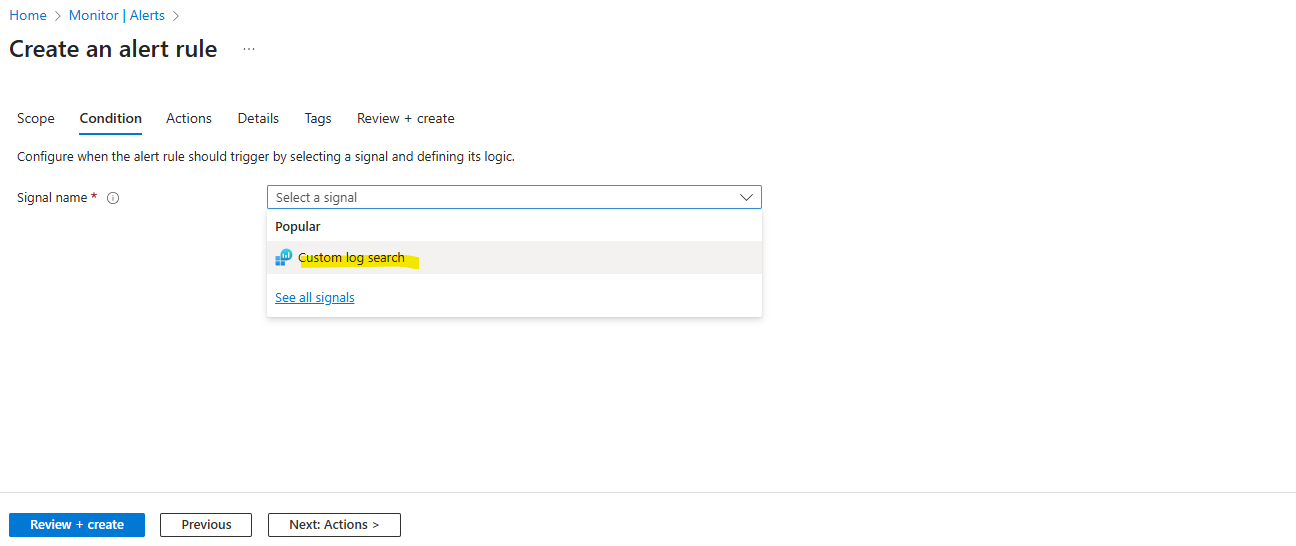
Under Condition select Custom log search.
Enter the query and click on Run.
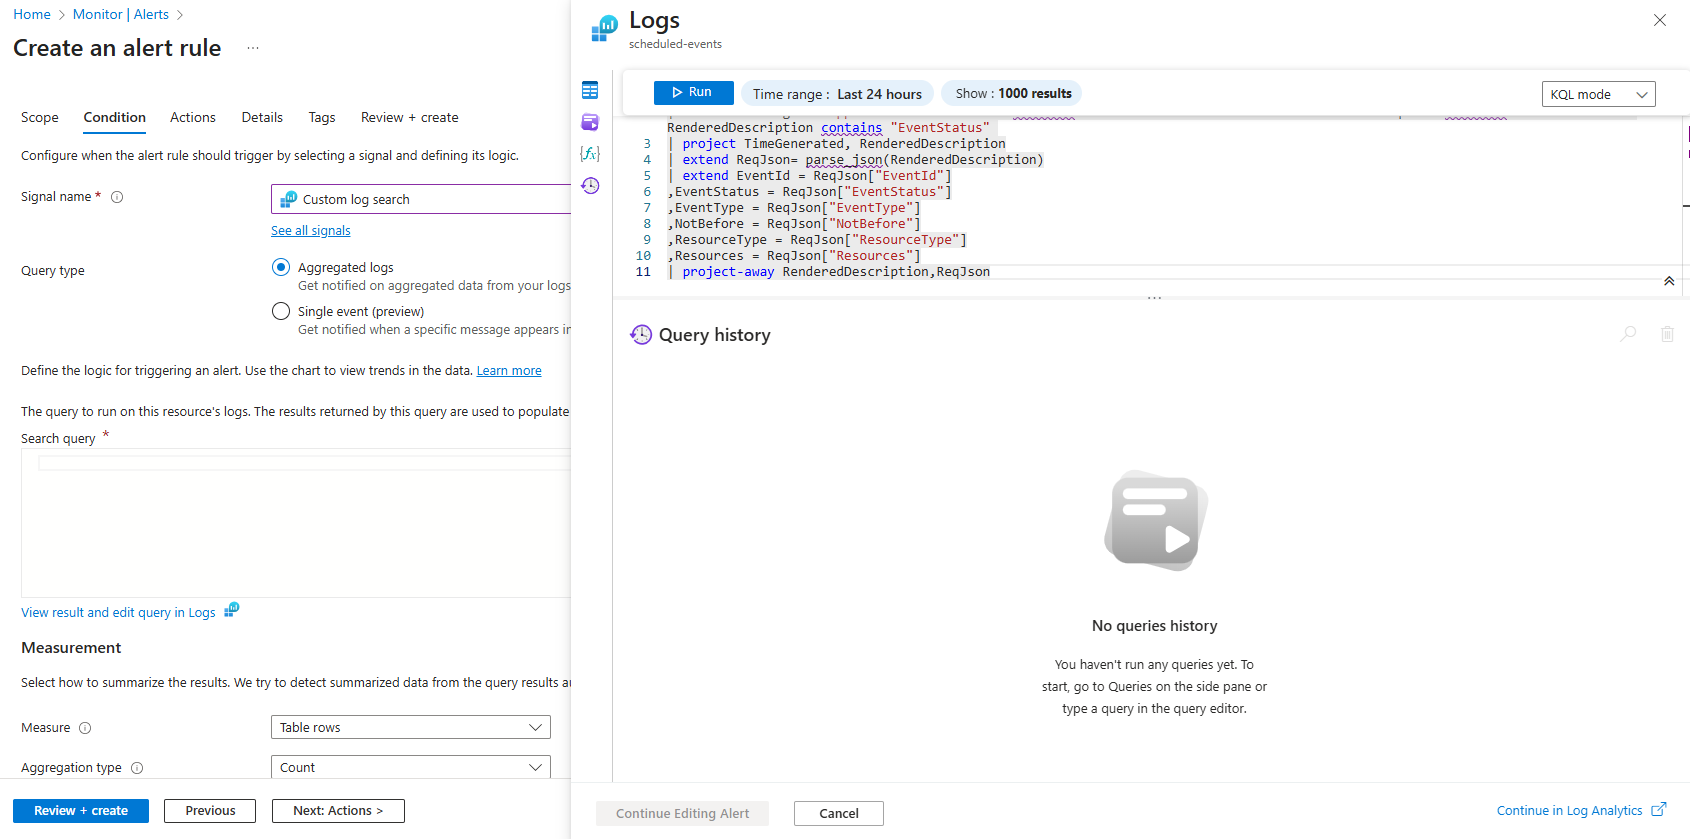
Click on Continue Editing Alert.
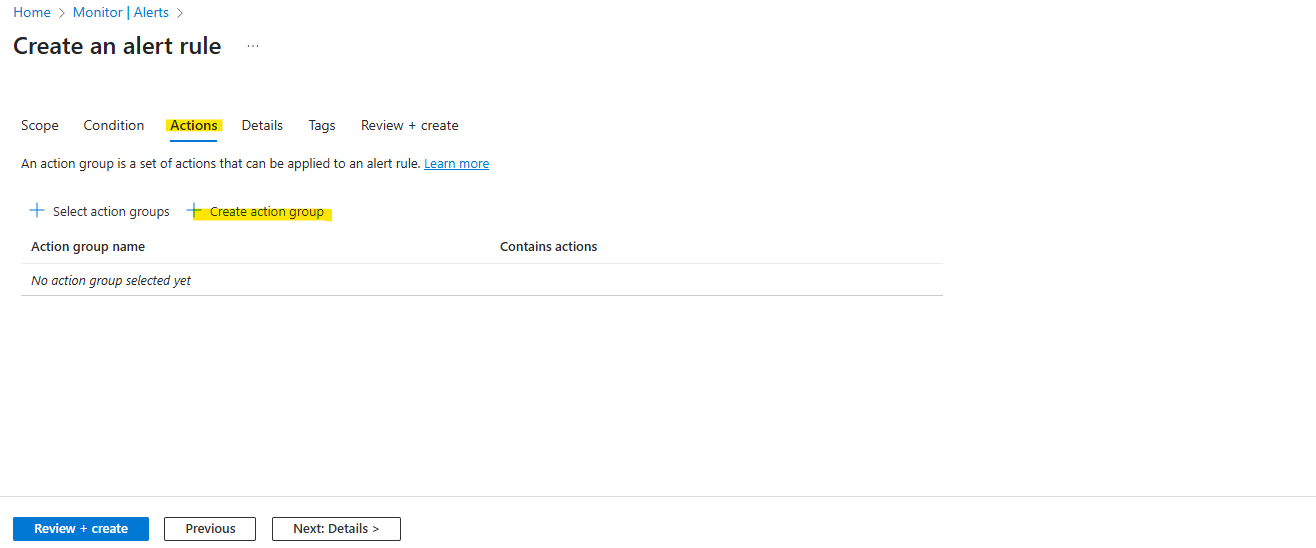
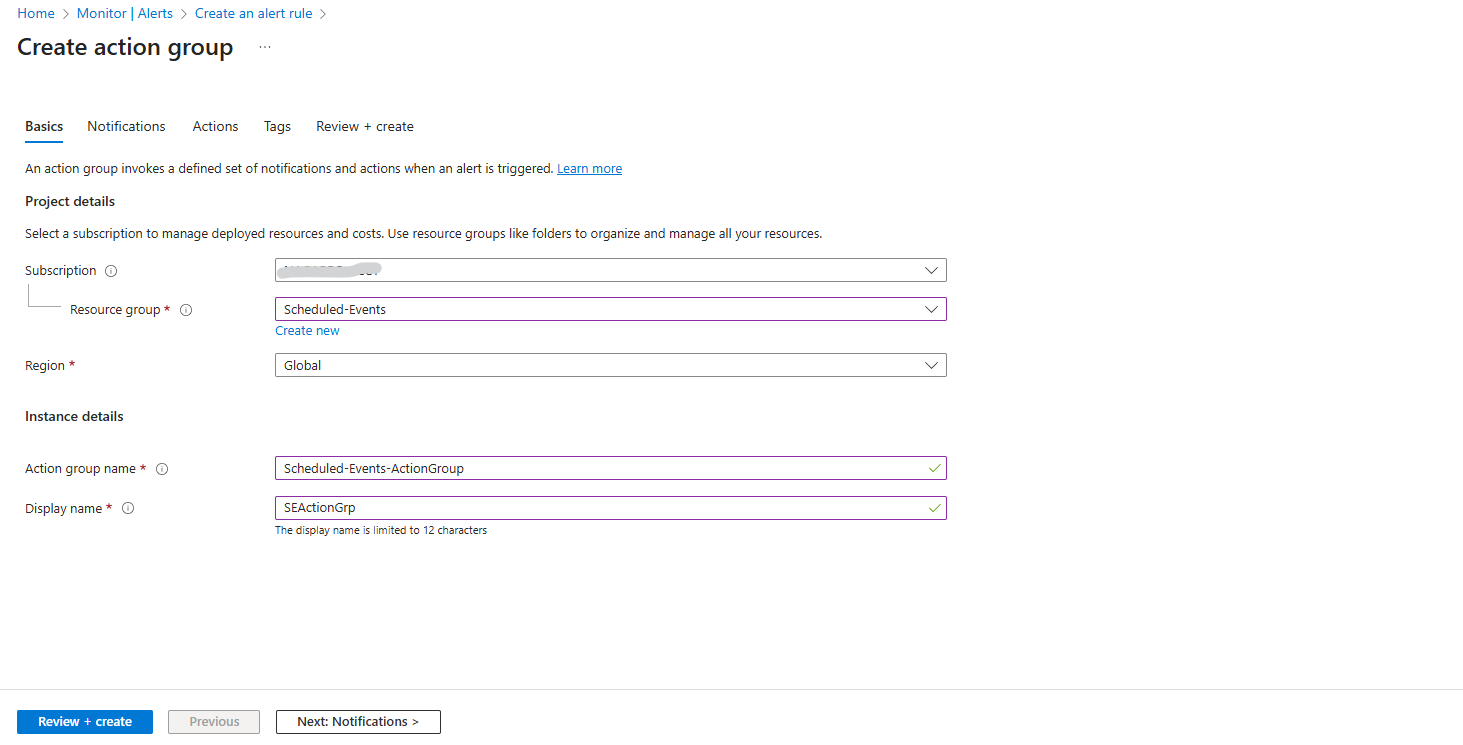
Under Actions, select Create action group. The Add action group page will open.
Configure basic action group settings, for the Region we need to left Global.
Service Health Alerts are only supported in public clouds within the global region. For Action groups to properly function in response to a Service Health Alert, the region of the action group must be set to Global.
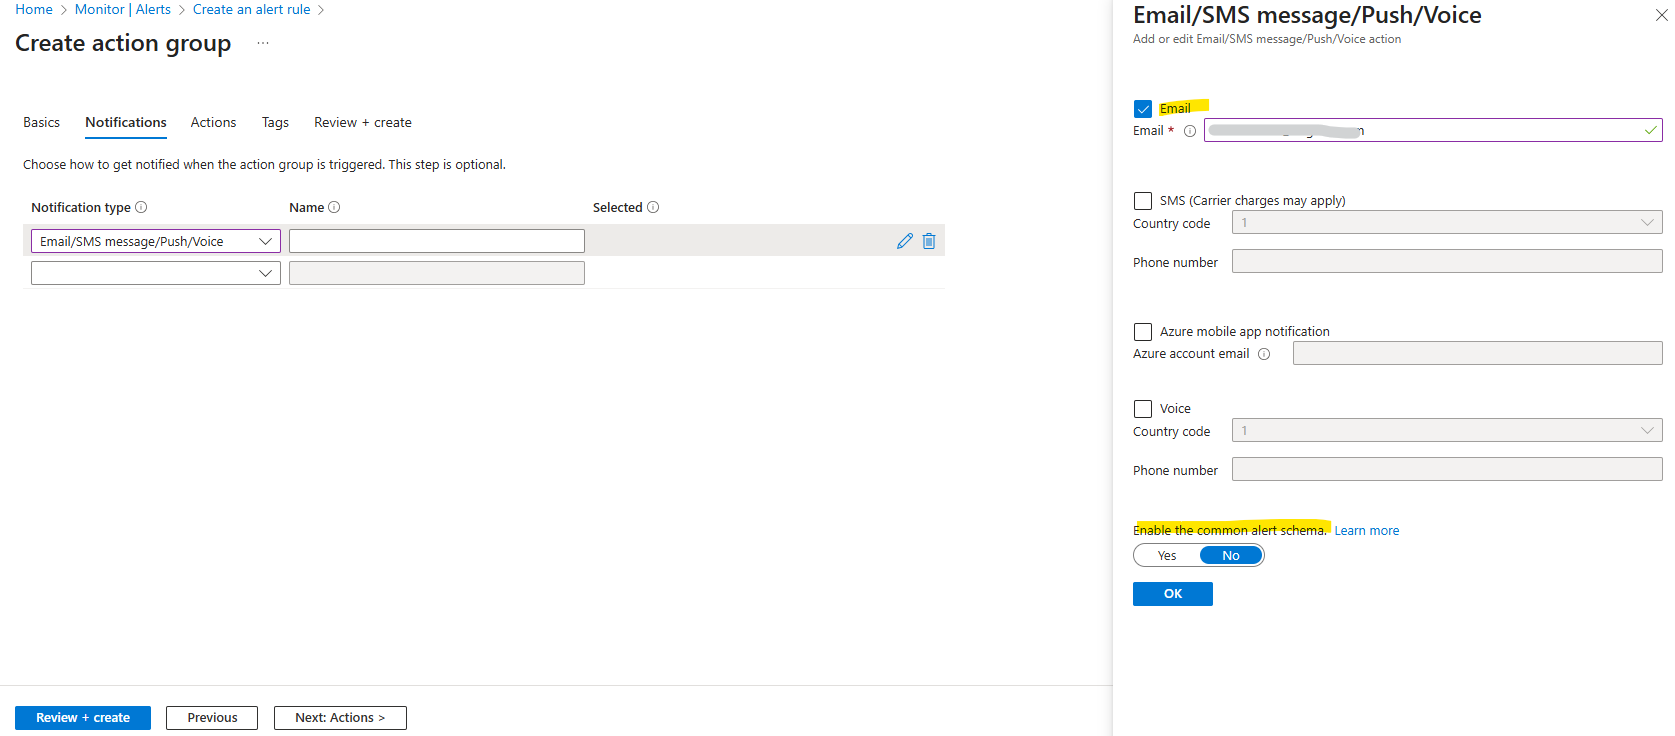
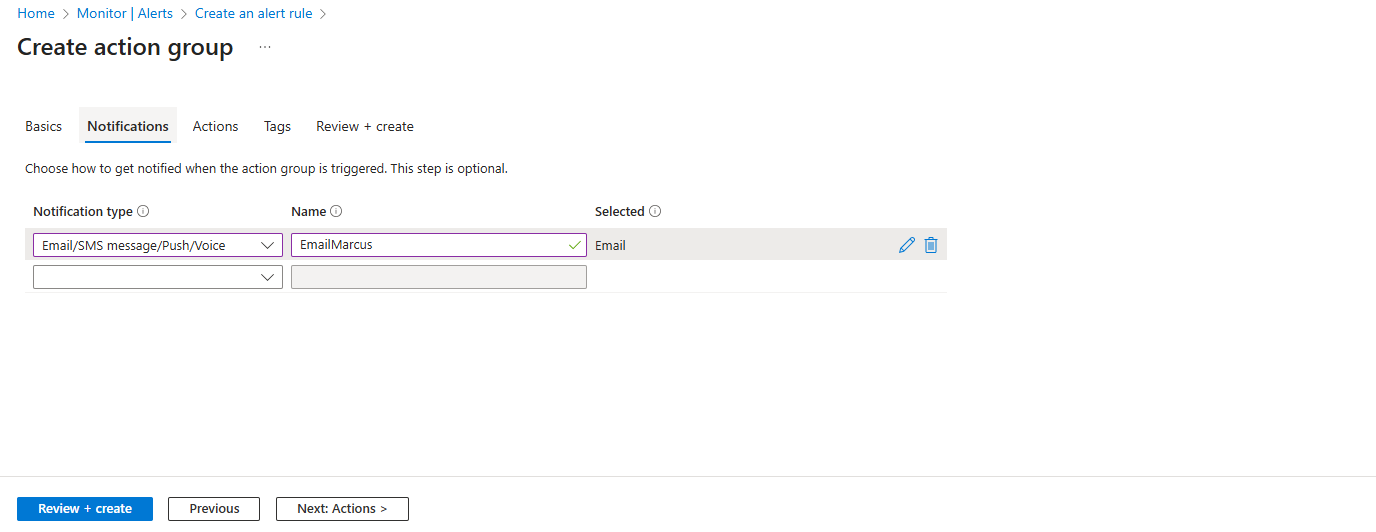
Configure notifications. I will configure Email notification below.
Emails are sent from the following email addresses: azure-noreply@microsoft.com, azureemail-noreply@microsoft.com and alerts-noreply@mail.windowsazure.com.
Select if you want to enable the Common alert schema. The common alert schema is a single extensible and unified alert payload that can be used across all the alert services in Azure Monitor. For more information about the common schema, see Common alert schema.
Normally, different alert sources in Azure (like metrics, logs, activity logs, Application Insights, etc.) produce notifications with different payloads. That makes it messy if you want to integrate alerts into automation tools, ITSM systems, or chat tools (Slack, Teams, etc.).
The Common Alert Schema solves this by making all alerts follow a unified JSON structure, no matter where they come from.
Click on Next: Actions.
I will leave the Actions section (optional) blank. In my case I just want get notified when a maintenance event is scheduled by Microsoft.
When you create an alert rule in Azure Monitor, the Actions section defines what should happen when the alert is triggered.
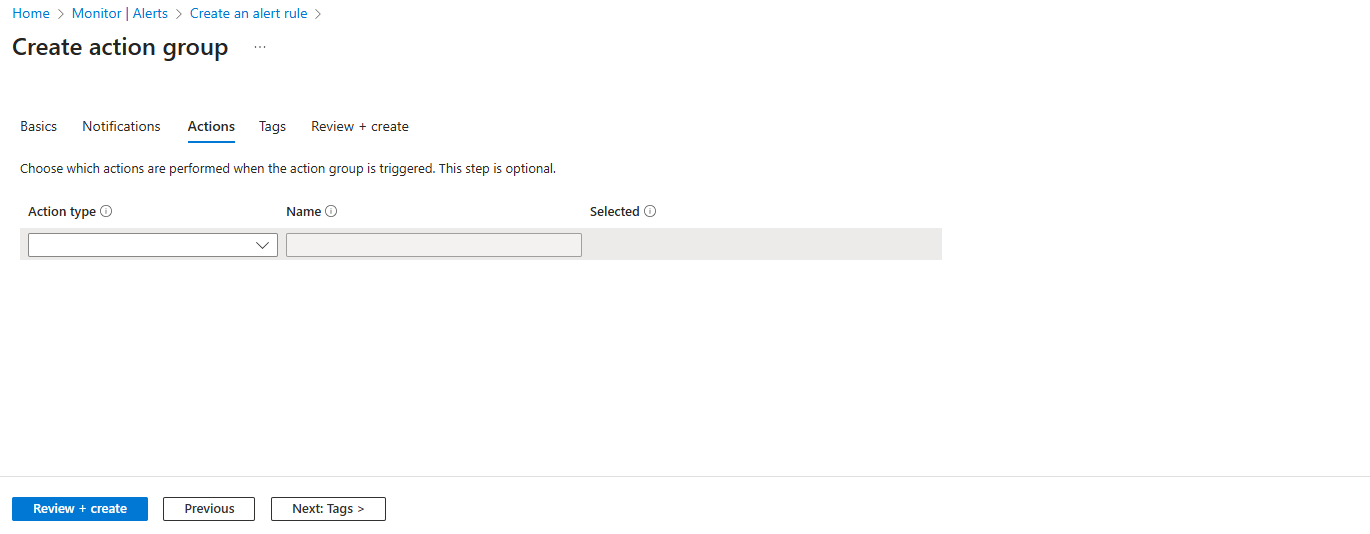
Click on Create to finally create the action group.
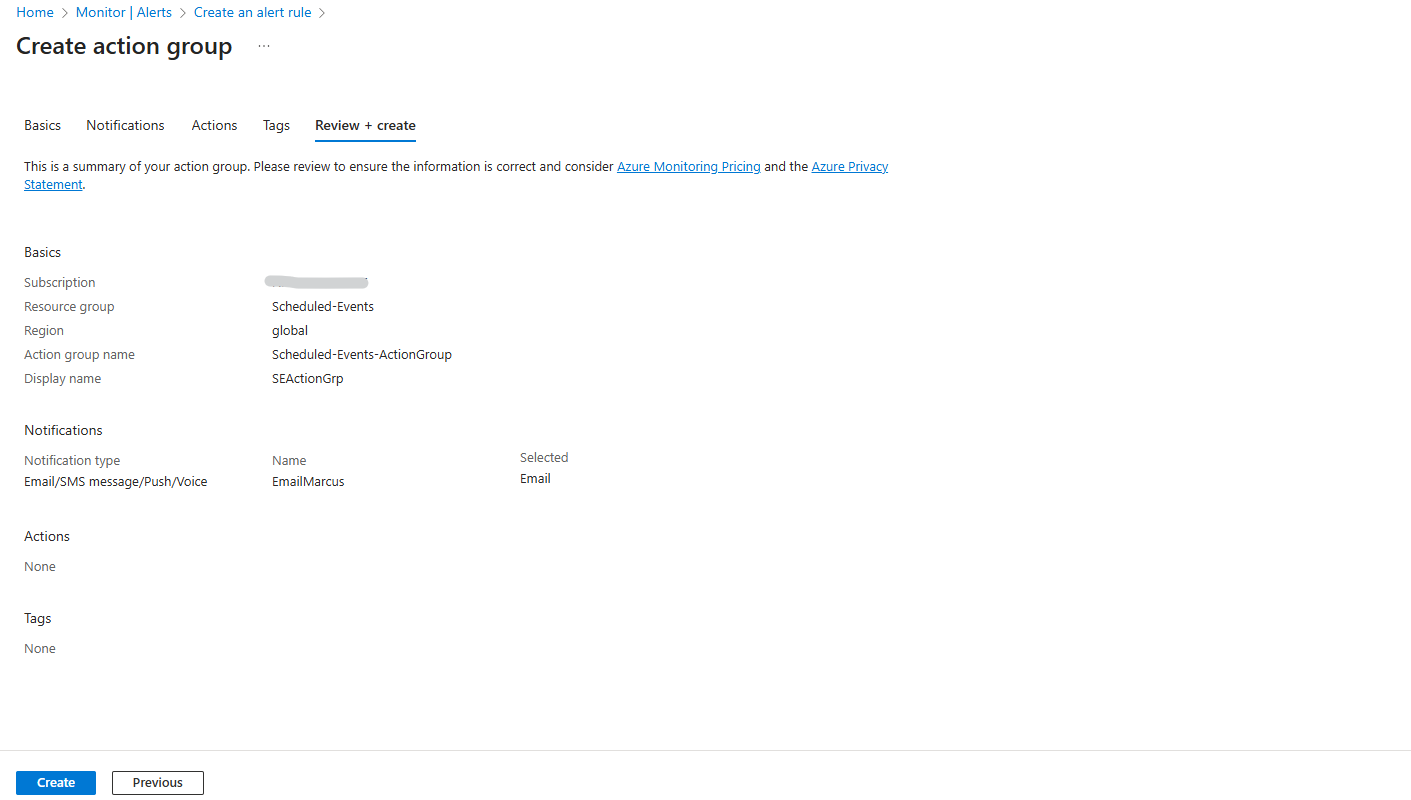
Back on the alert creation blade click on Next: Details and finally create the new alert rule.
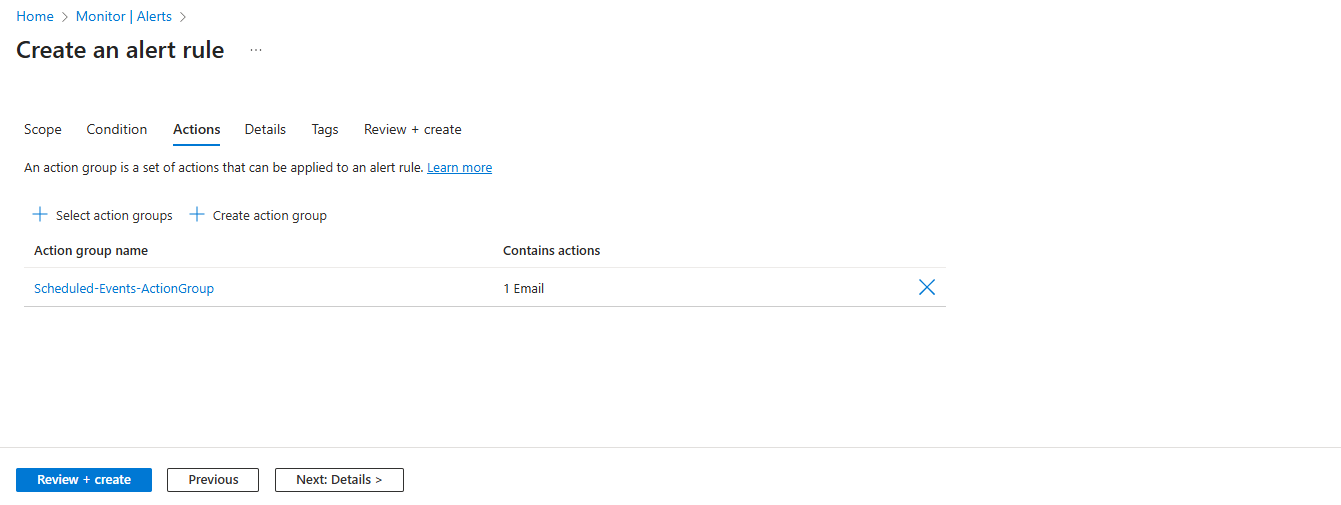
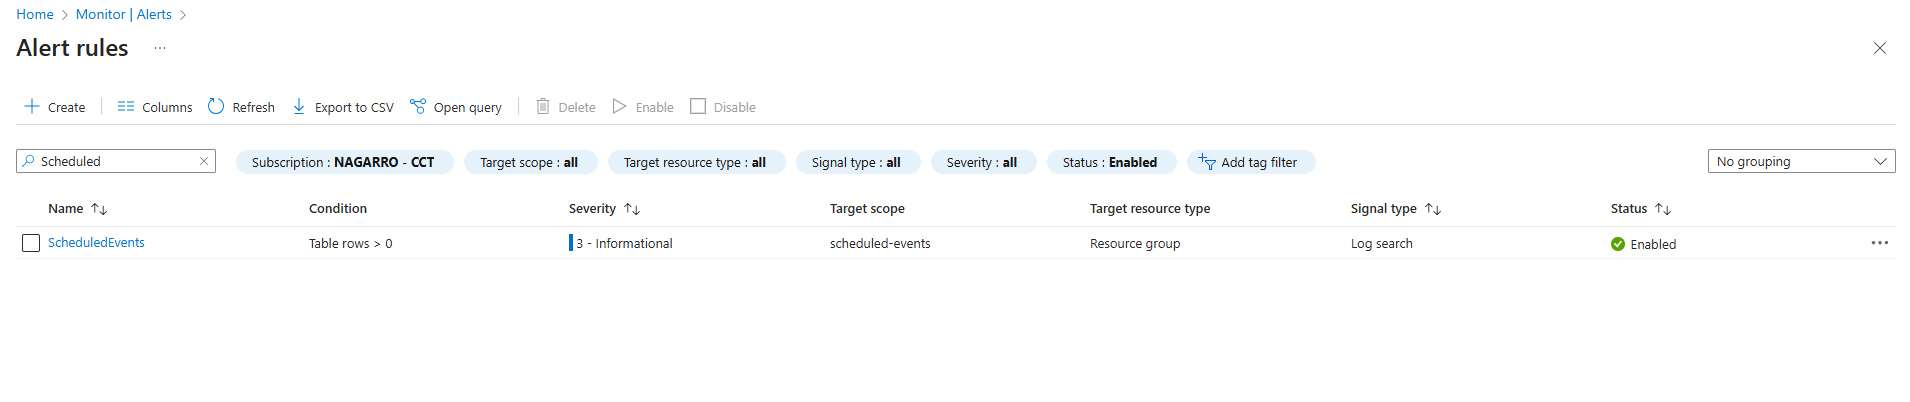
Our new alert rule is created.
After a reboot of one virtual machine in the availability set, the event is logged in Azure Monitor.
Because we connected our collector virtual machine to the log analytics workspace, its events shown below will also get pushed to log analytics workspace.
EventStatus: Scheduled is included in the query above.
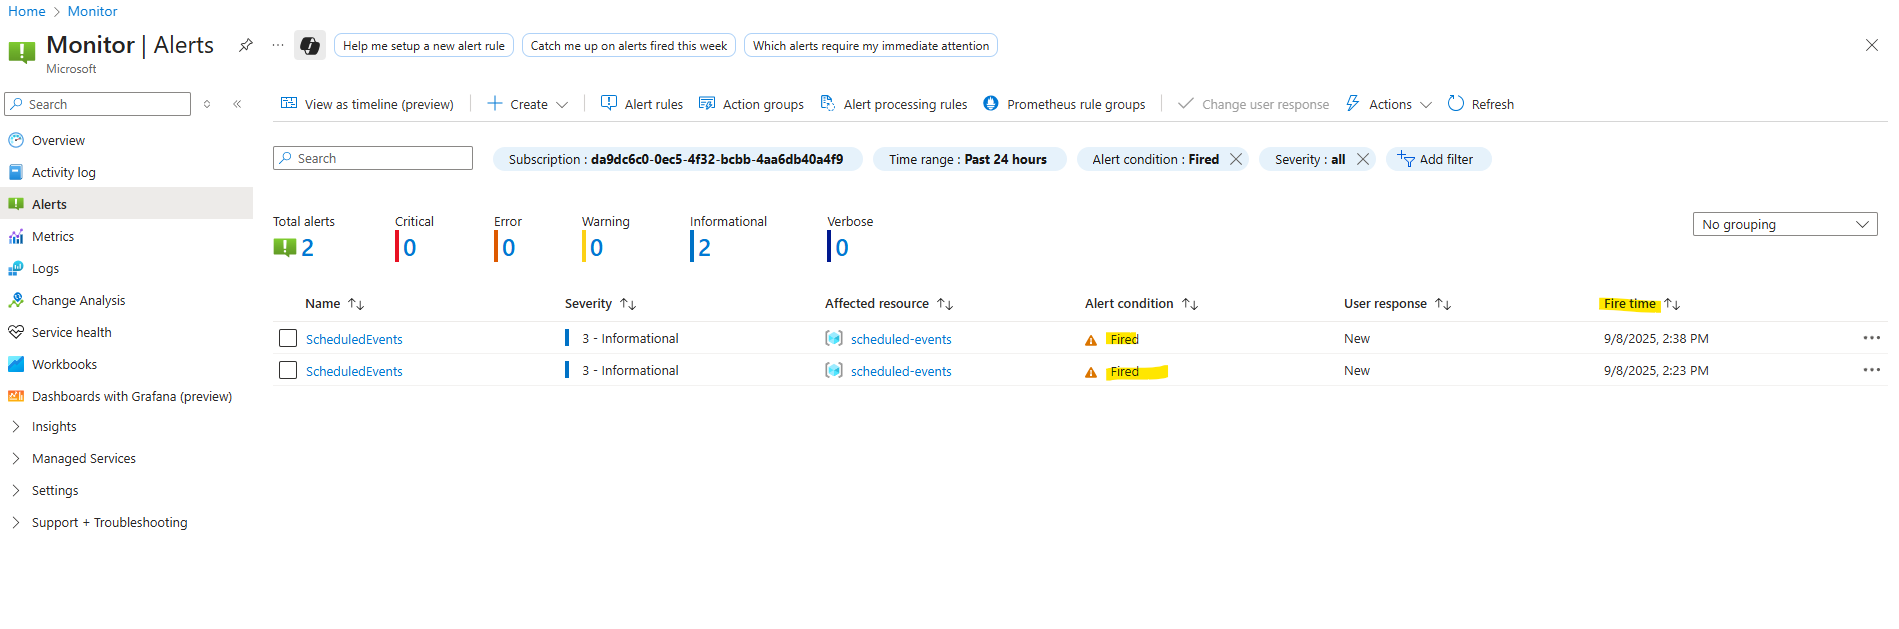
The fired alerts will show up directly under Monitor -> Alerts.
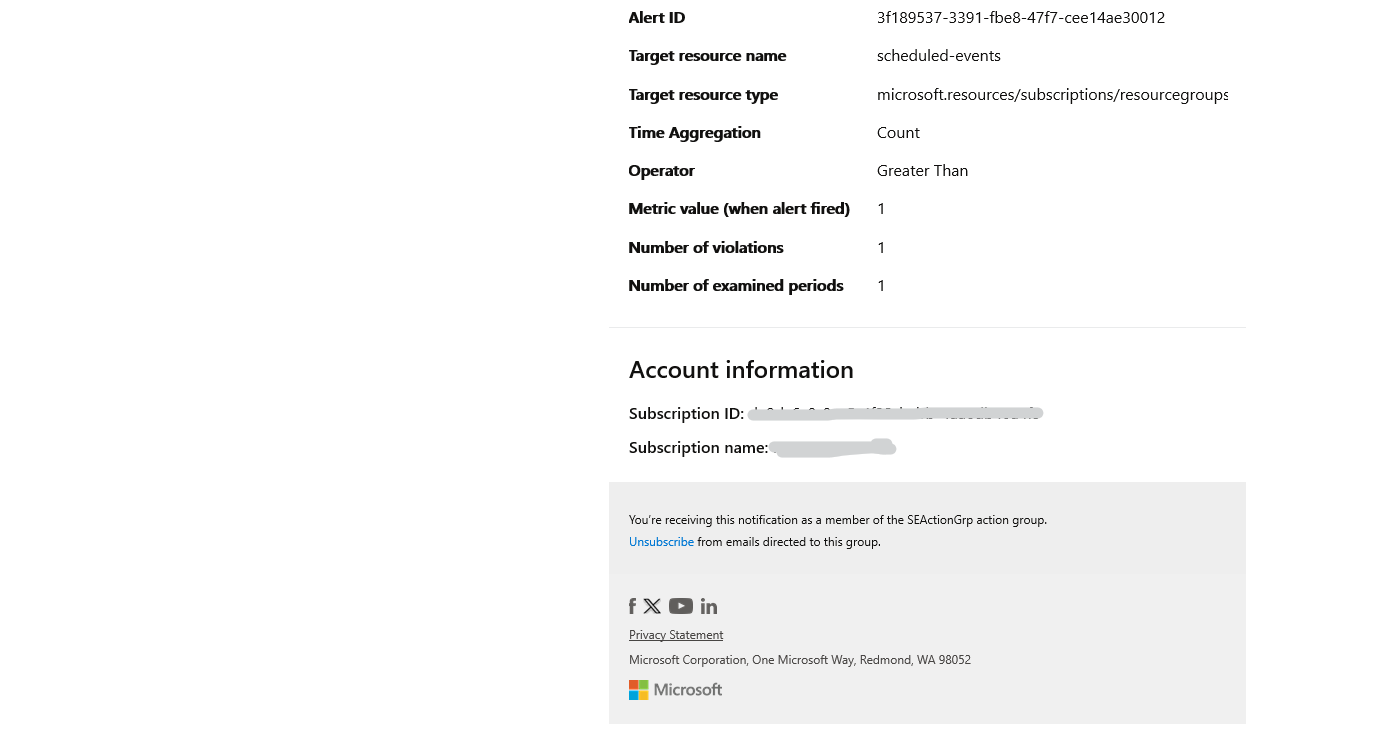
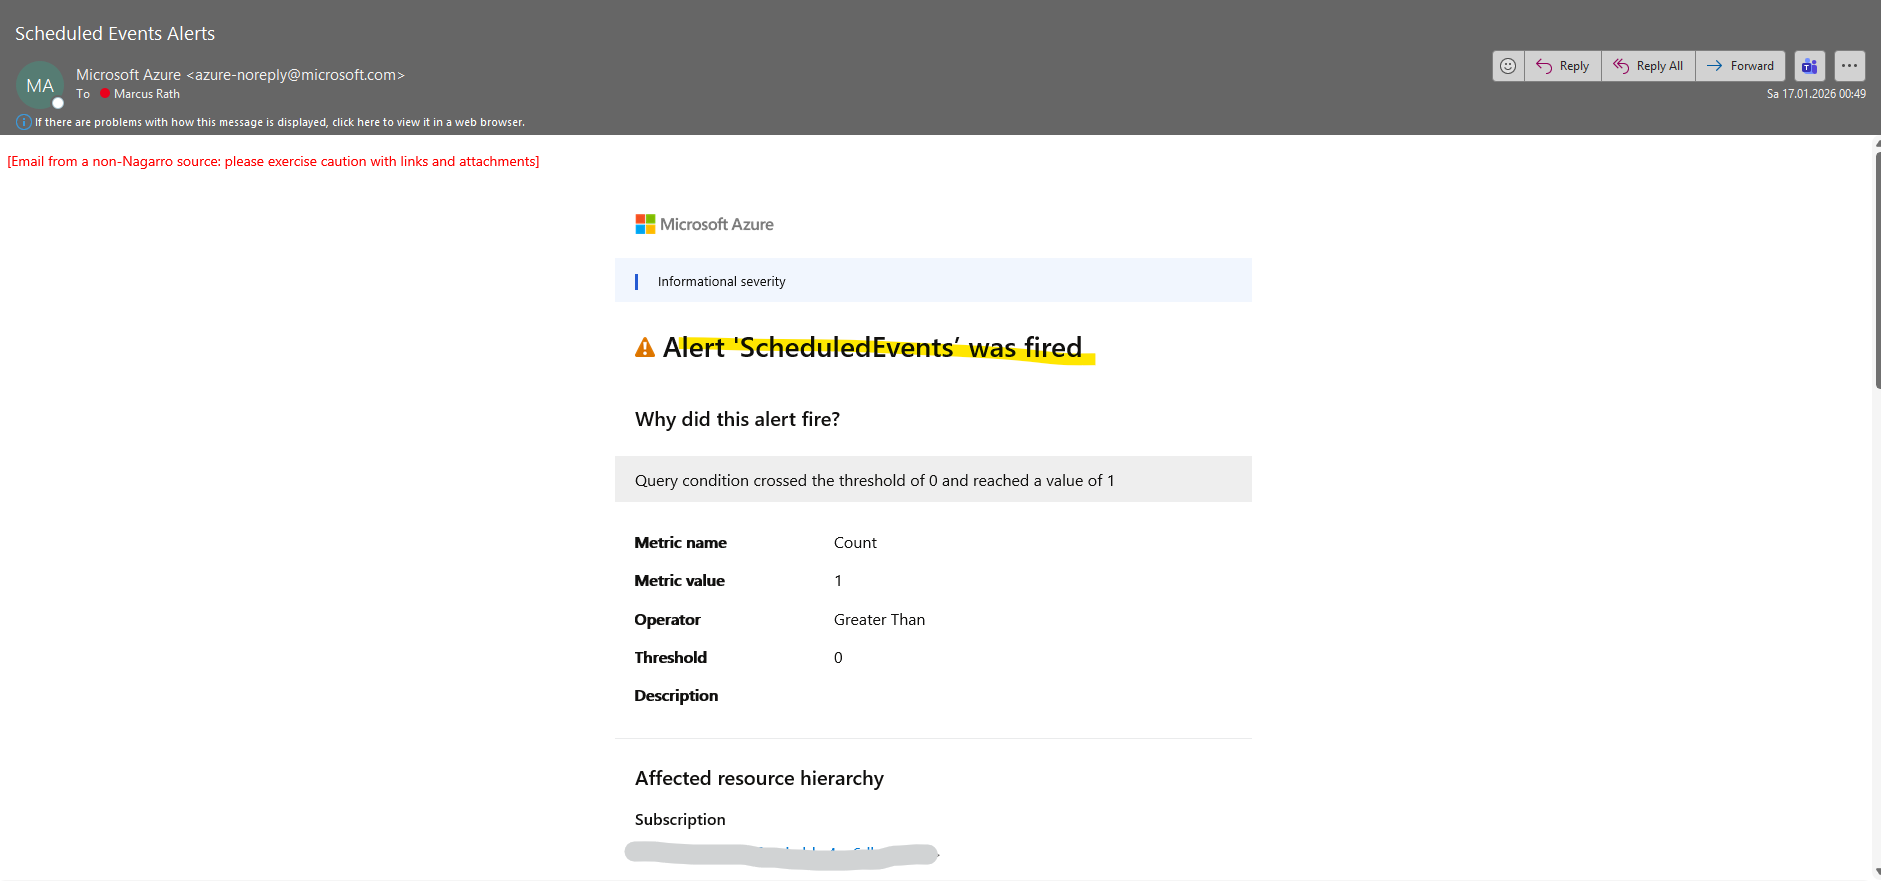
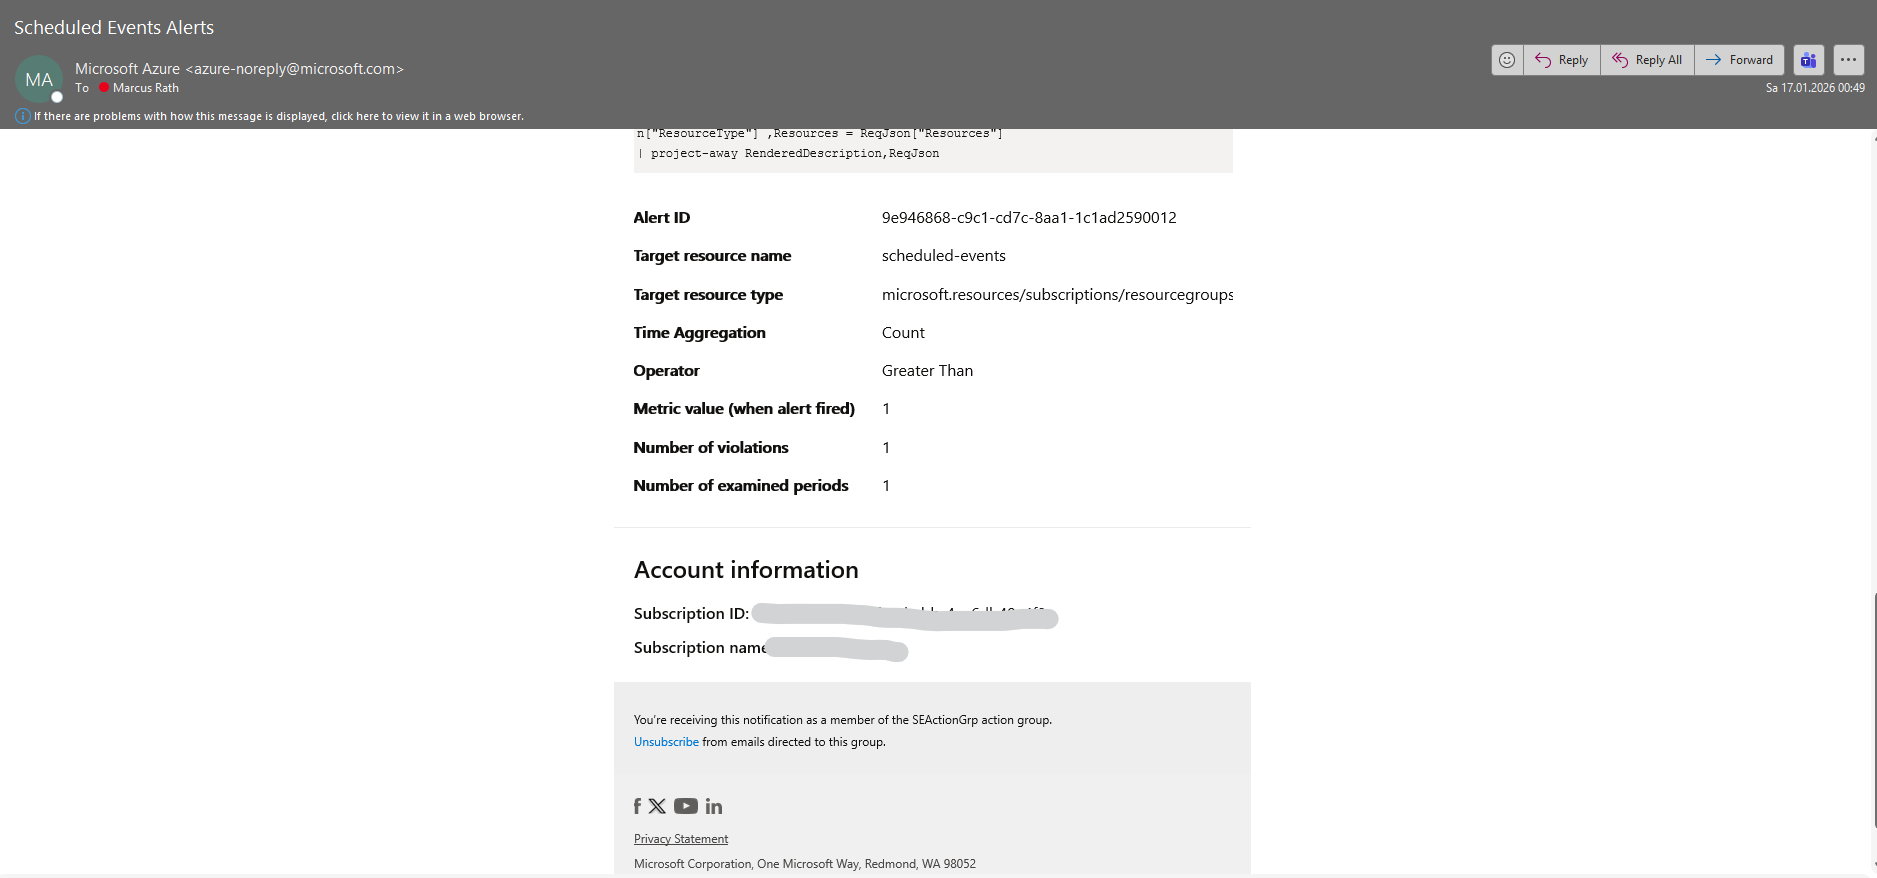
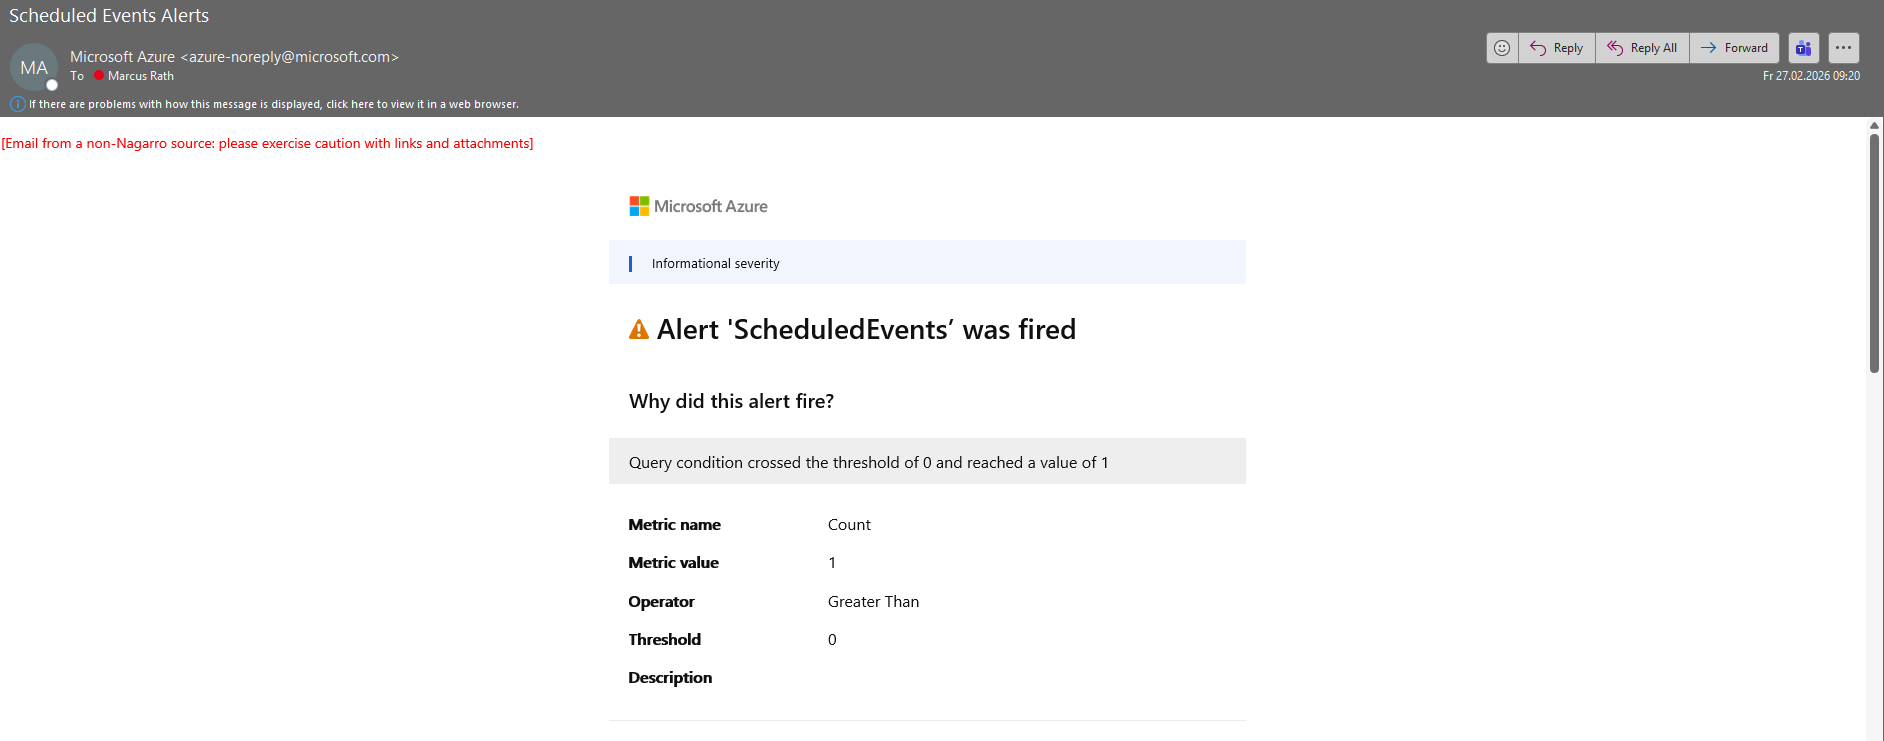
Because I have configure Email notification, I will also get an email like shown below when the alarm is raised.
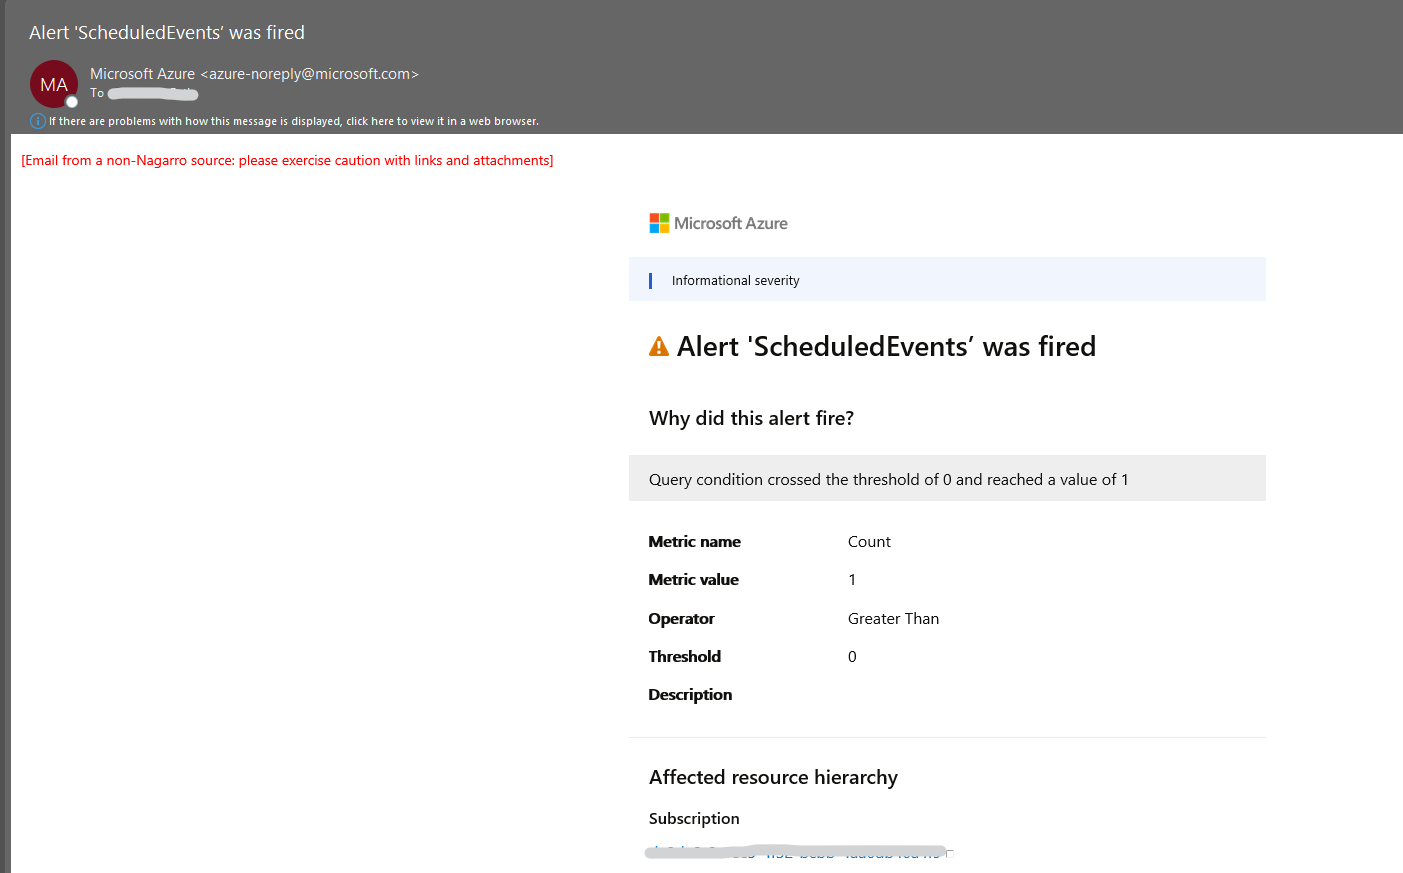
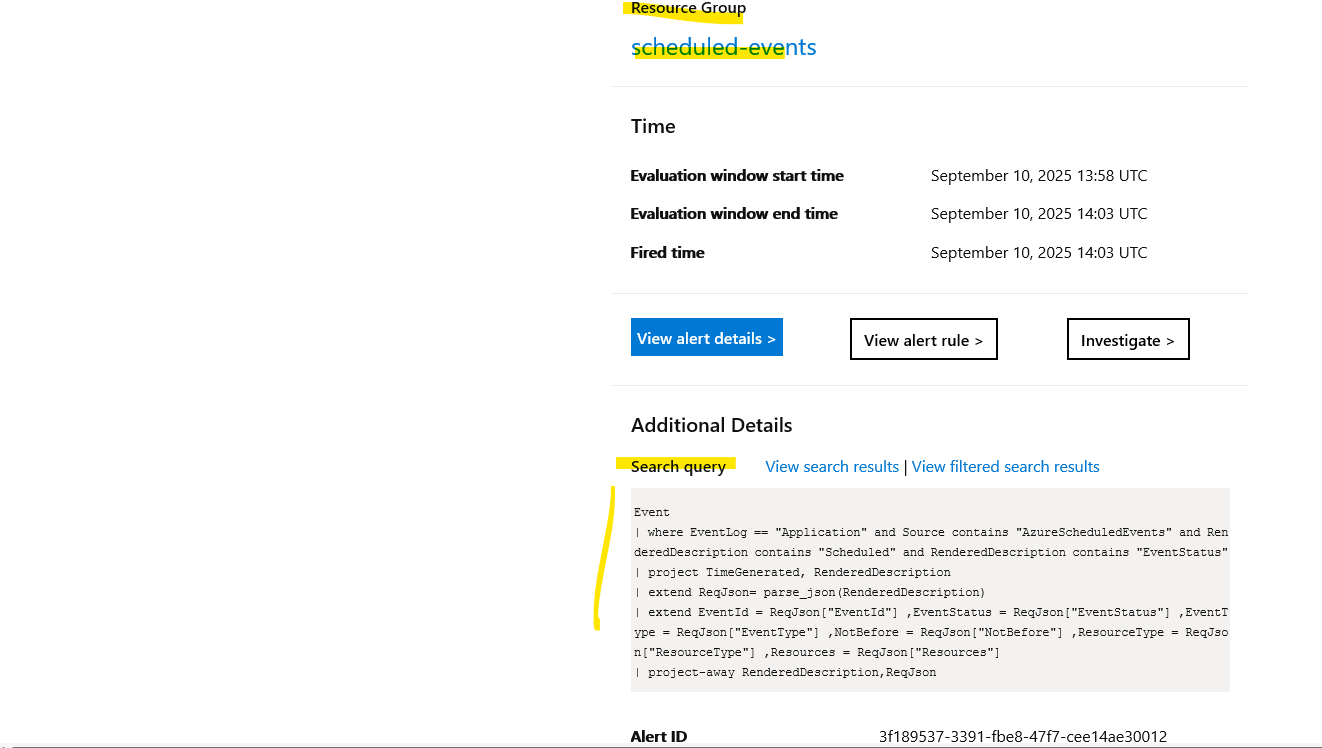
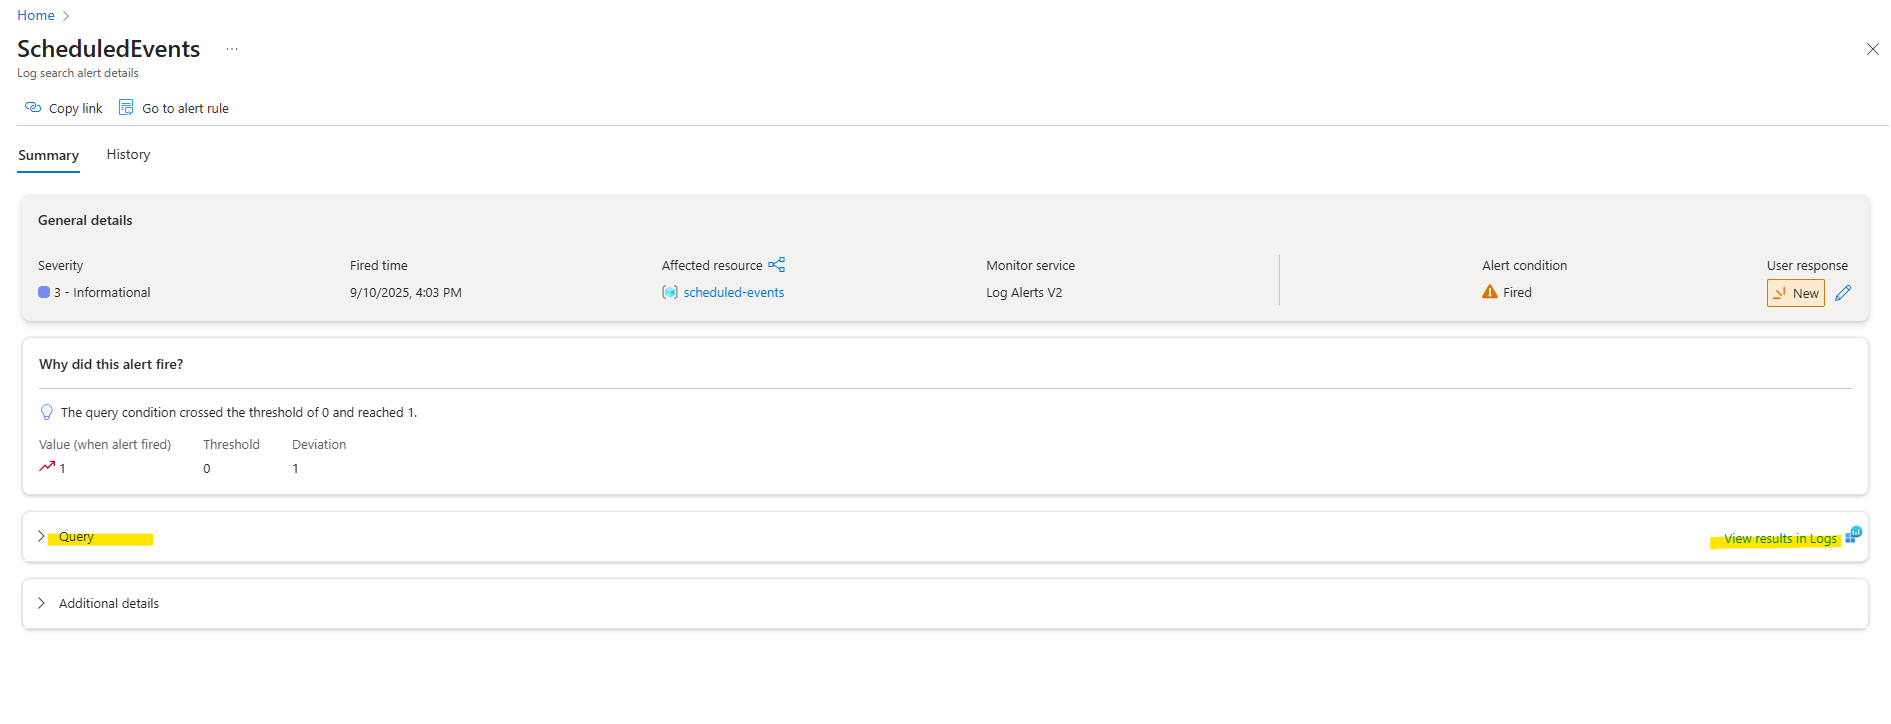
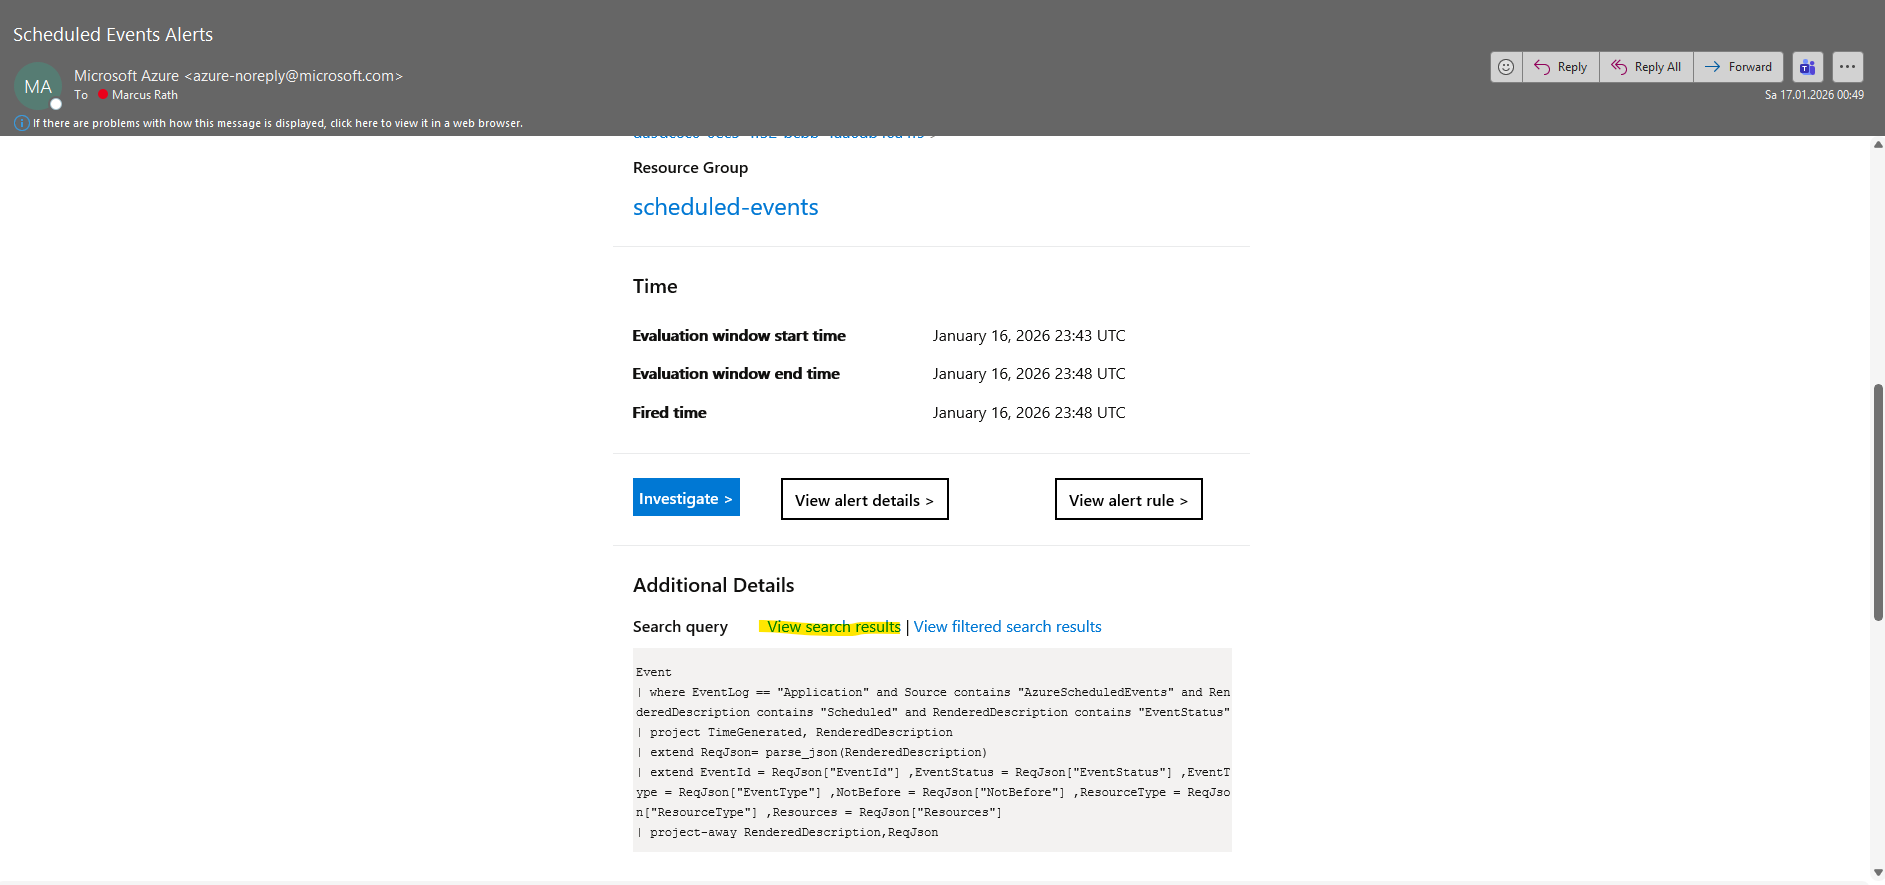
When I will click on the View alert detail link/buttton in this email, the following page will get opened in the Azure portal. We can click on View results in Logs to see the exact event which was coming up.
Finally this is our manually triggered reboot to see if logging an alerting works.
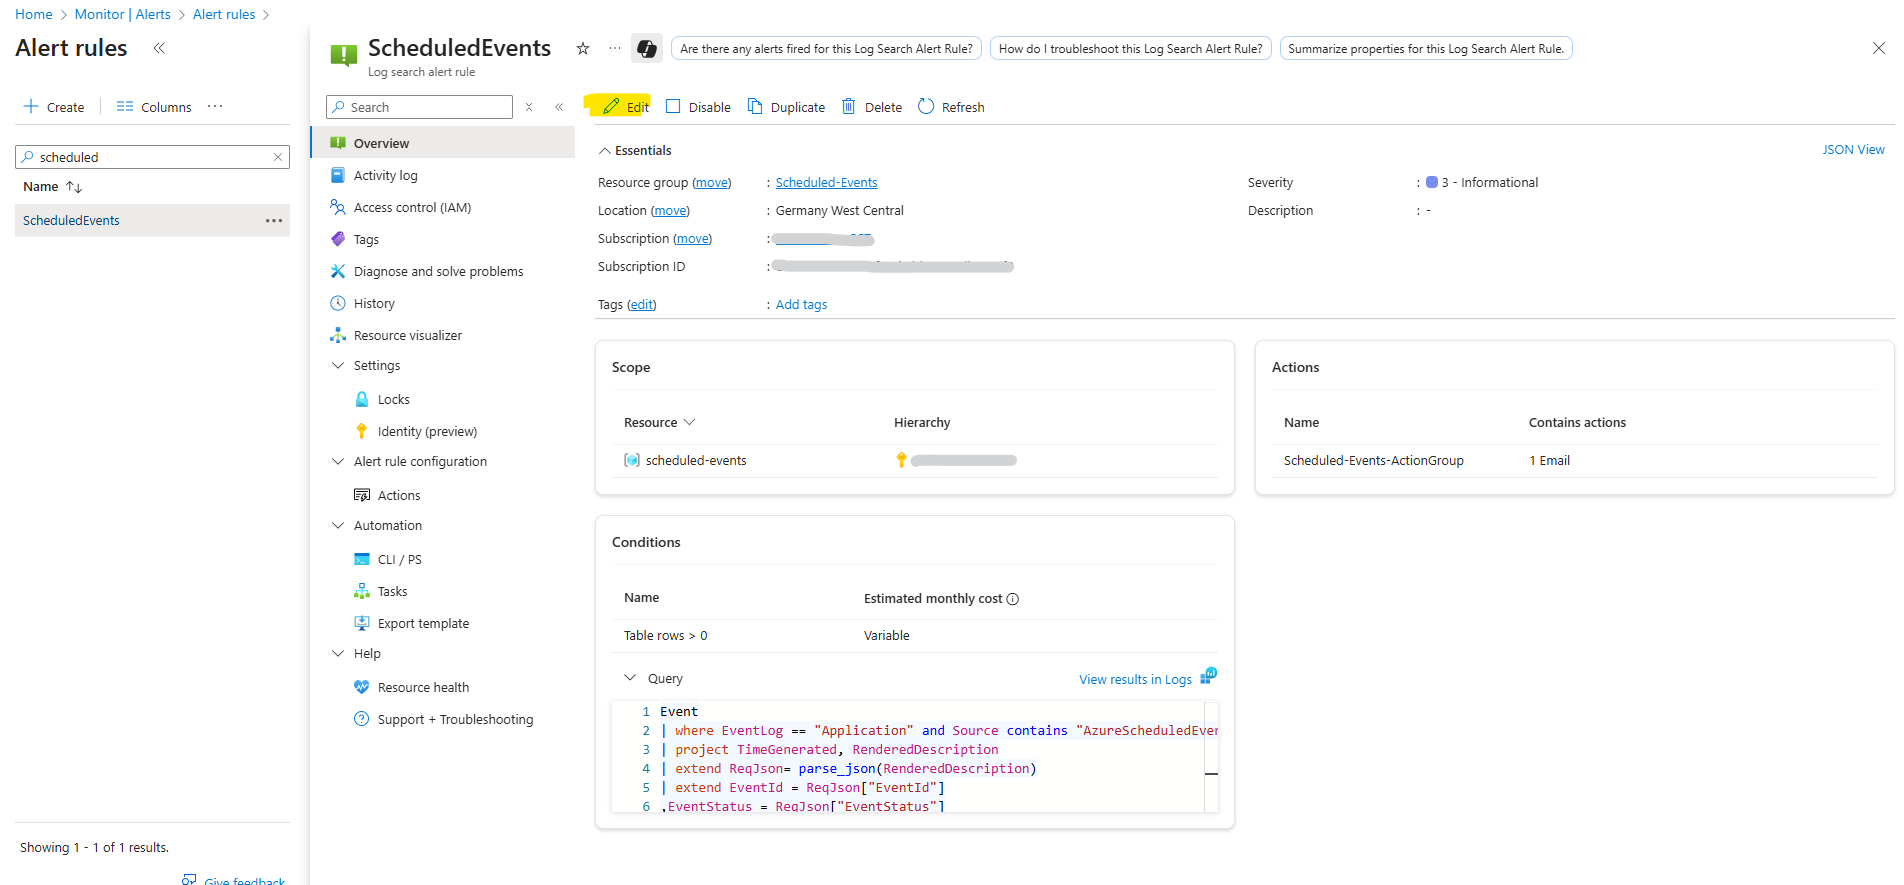
The configured alert rule we will see under Monitor -> Alerts -> Alert rules. We can also edit the rule directly by clicking on Edit on the Overview blade.
First Scheduled Event detected and alerted via Email
To finally see real platform-initiated maintenance events, I will now first have to wait and leave the machines running in my availability set.
Then exceptionally hoping that Azure will soon schedule a new maintenance event for the host on which these virtual machines are running, to see if our service and alerting will also work for platform-initiated maintenance events.
I will update this post as soon as new platform-initiated maintenance events will be shown up.
Update: January 19, 2026
Finally after 4 month the first scheduled event was fired in my Azure tenant for this availability set.
On January 16, 2026 at 11:49 PM UTC, the first alert email was triggered by our rule, which runs every 5 minutes.
The scheduled event itself was created at 11:47:07 PM UTC and announced a Freeze roughly two hours in advance.
This shows that although the event is detected correctly, the actual reaction window for manual intervention is relatively short.
This also shows why automated actions should be part of the alert rule, not just notifications.
With such a short lead time before the freeze occurs, relying on manual intervention is risky and often too slow to react effectively.
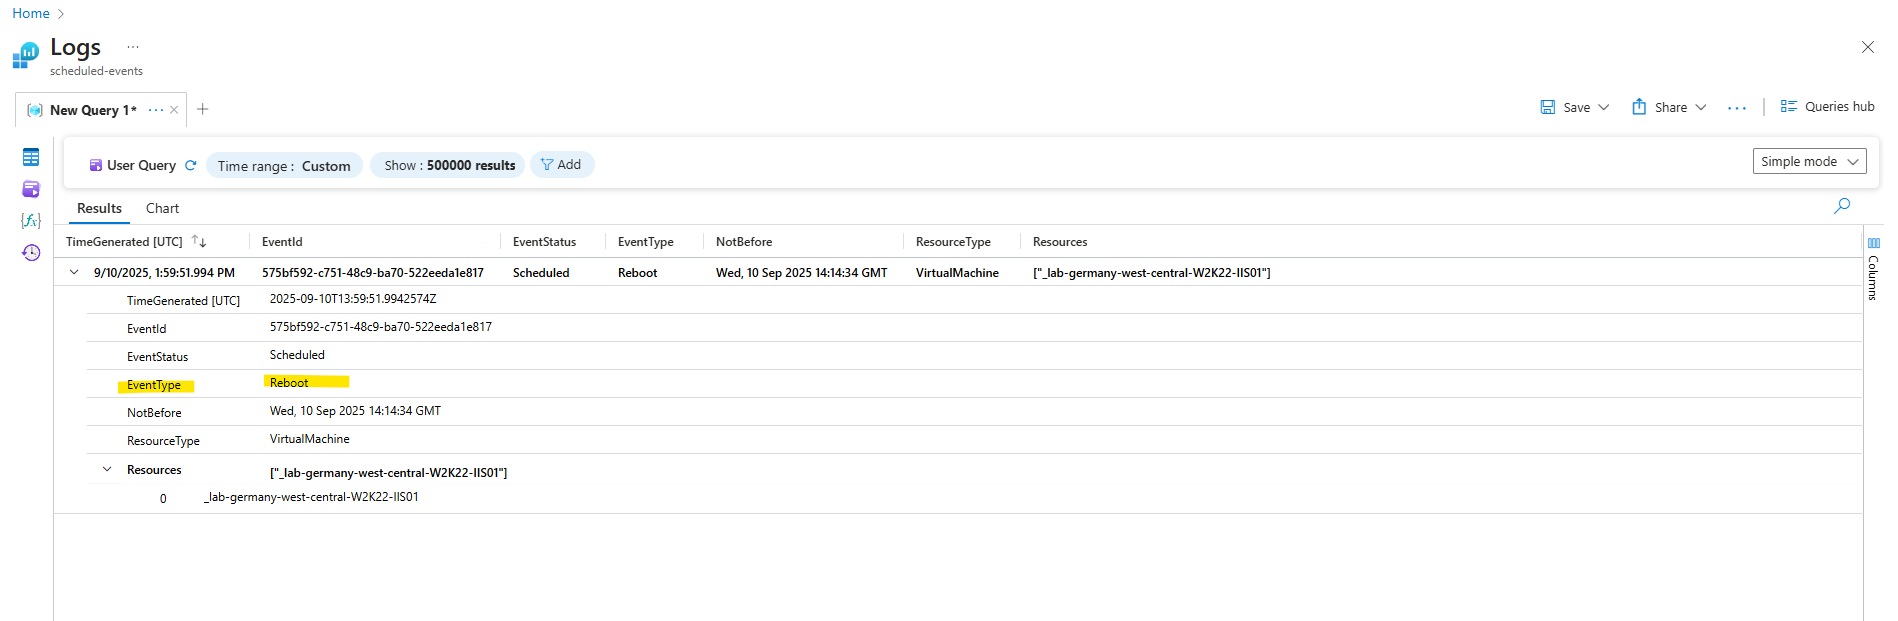
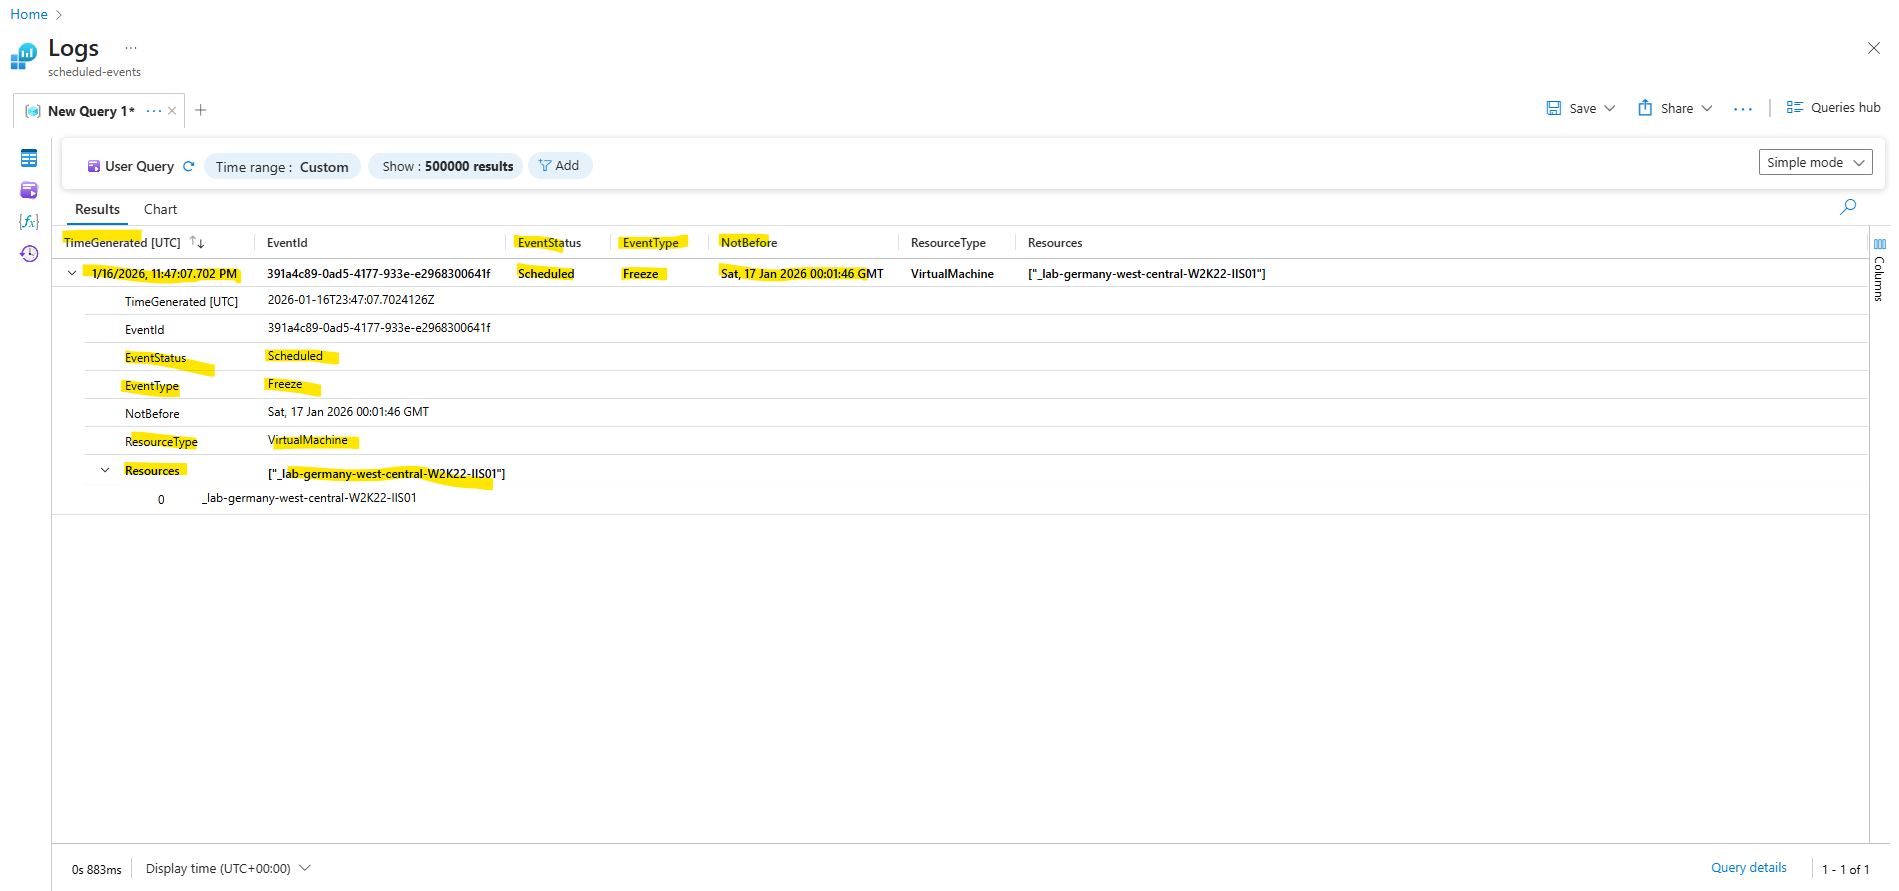
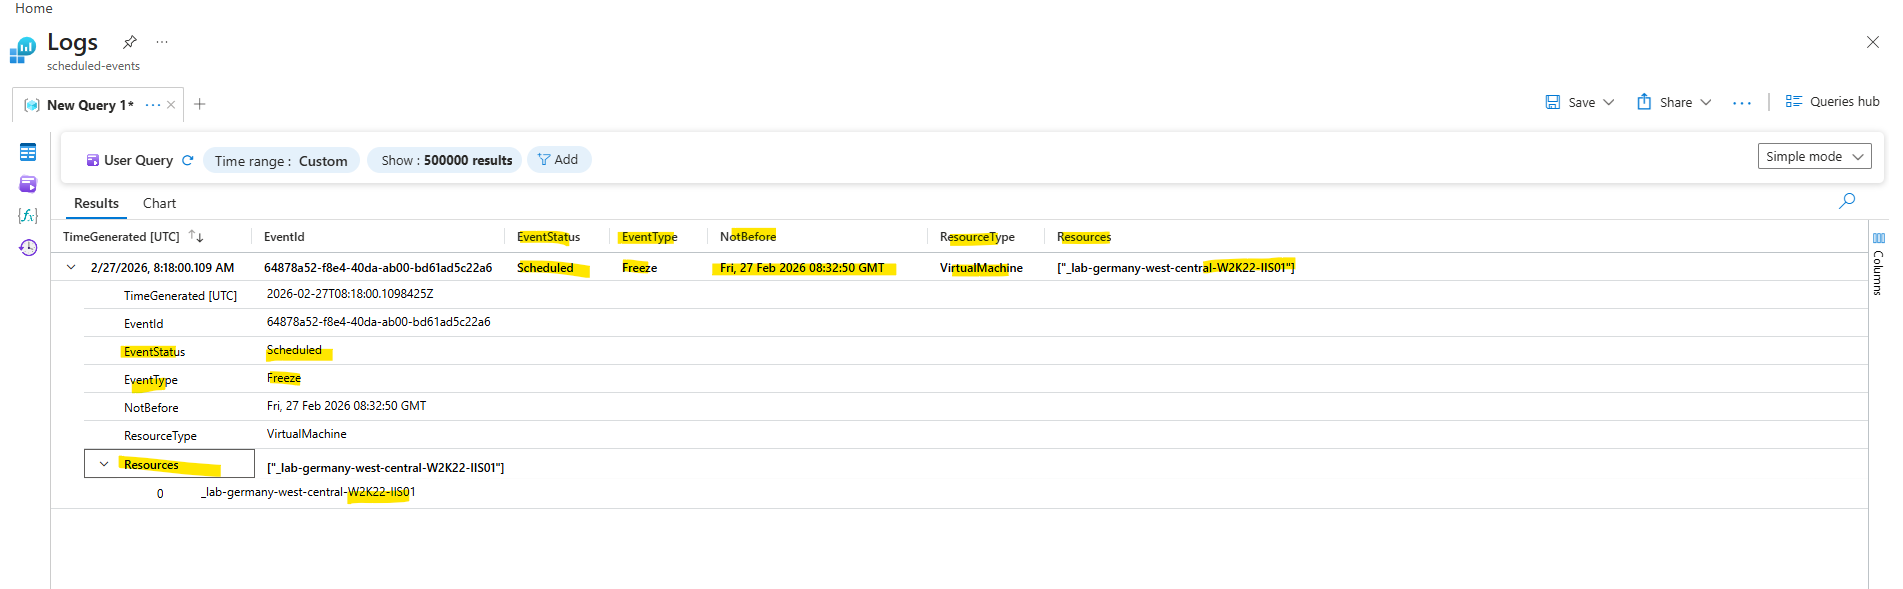
We can click on View search results to see the scheduled event.
Here we see the scheduled event that Azure actually emitted for one of our VMs (lab-germany-west-central-W2K22-IIS01), in this case a Freeze event, which tells us that the platform is planning to suspend the VM at some point after the “NotBefore” time. The query shows the event type, resource ID, and the earliest timestamp Azure will begin the maintenance, which our collector correctly captured using the Scheduled Events API as described. This proves our monitoring setup works end-to-end by alerting us before an anticipated host maintenance action.
!! Click on the refresh icon if the query not already shows the event !!
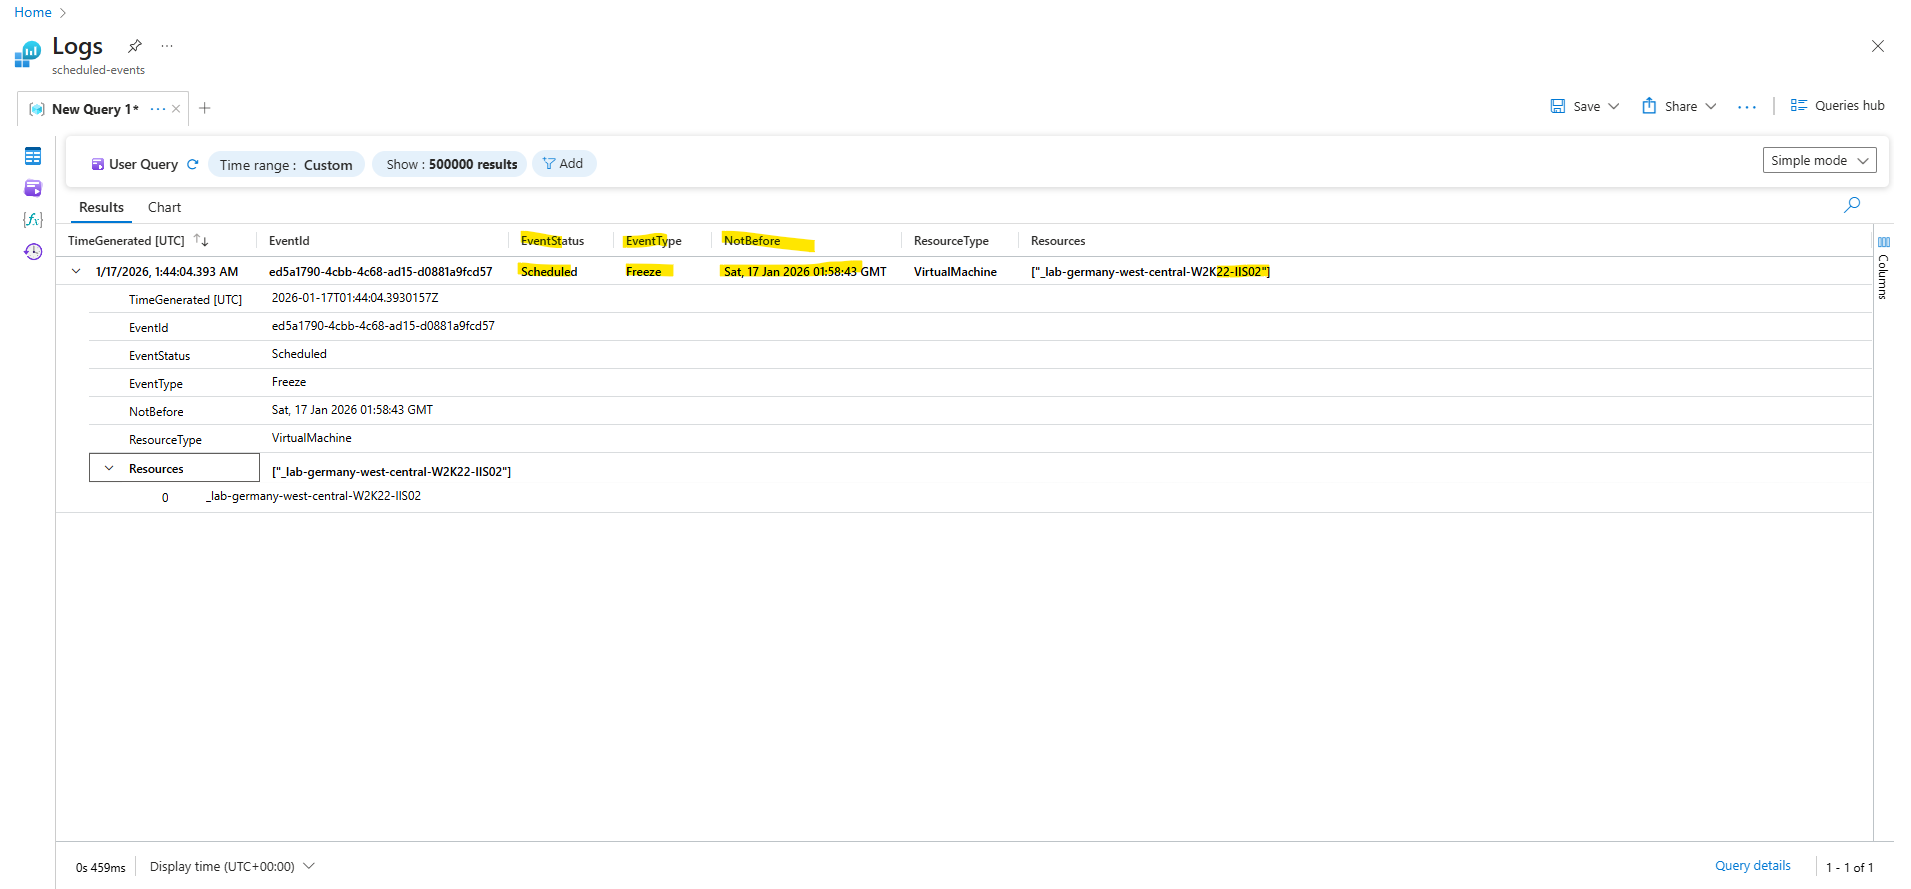
I got also a second mail where I will get notified about the second VM (_lab-germany-west-central-W2K22-IIS02) and freeze which finally will occur not before around 3 minutes later than for the first.
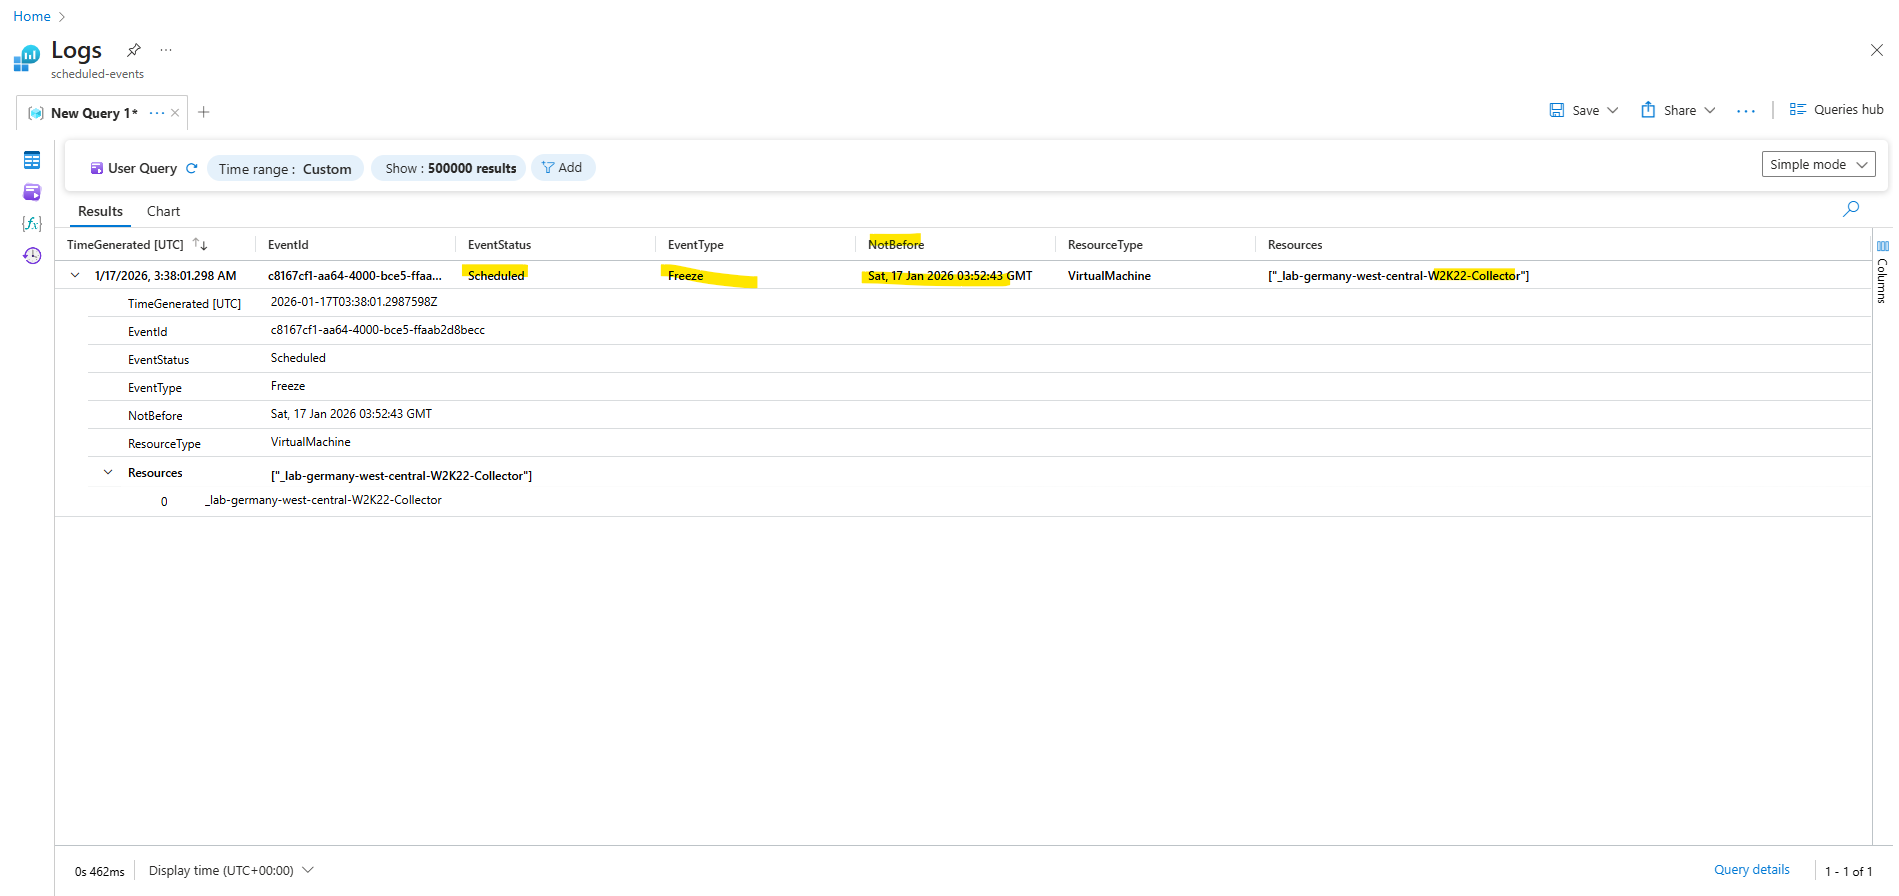
And I got also a third mail for the collector VM itself.
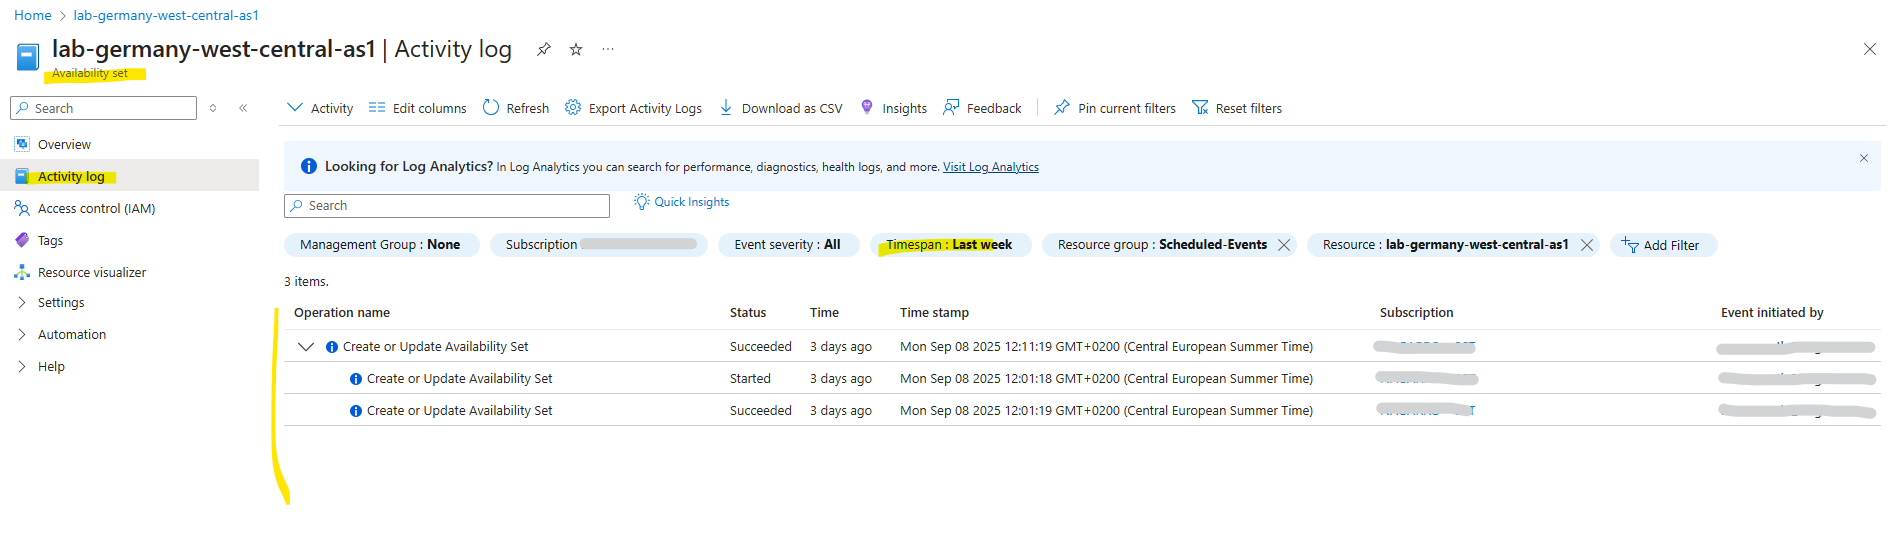
In the Activity log for the availability set as shown below we can also see any platform-initiated maintenance events in case one of the virtual machines where paused, live migrated or rebooted.
The short freeze wasn’t logged here in my case, therefore just an old screenshot about this logs.
On February 27, 2026 the second scheduled event was fired in my Azure tenant for this availability set as shown below.
The freeze event will not start before 08:32:50 GMT (09:32:50 CET), currently its 09:27:00 CET, so lets see when the freeze finally starts or as last time will not logged within the activity log.
The email warning I was getting at 09:20 CET, as already mentioned, with such a short lead time before the freeze occurs, relying on manual intervention is risky and often too slow to react effectively.
At 11:05 CET I got a second email about a scheduled event was fired in my Azure tenant for this availability set. This time its for the second virtual machine.
And the freeze will start not before 10:12:55 GMT (11:12:55 CET).

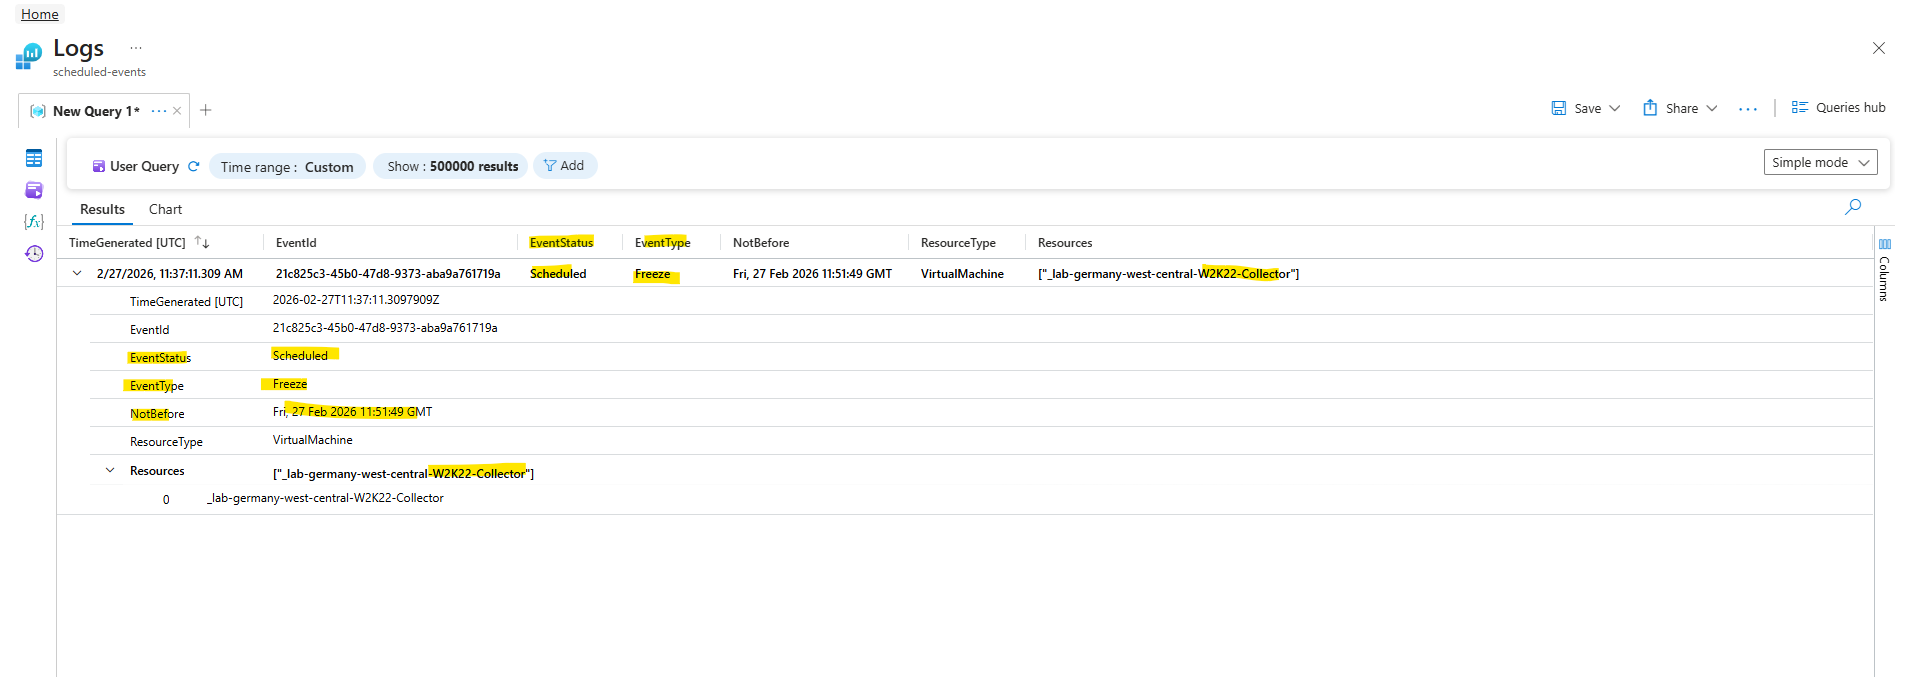
And finally at 12:39 CET I got a third email about a scheduled event was fired in my Azure tenant for this availability set. This time its for the second virtual machine.
And the freeze will start not before 11:51:49 GMT (12:51:39 CET).
Enabling and disabling Scheduled Events
Scheduled Events is enabled for your Azure Instance Metadata Service (IMDS) the first time you make a request for events. You should expect a delayed response in your first call of up to two minutes and you’ll start receiving events within 5 minutes.
Scheduled Events is disabled for your service if it doesn’t make a request to the endpoint for 24 hours.
Our service (Windows service named AzureScheduledEvents and installed by the PowerShell script as shown further above) will as shown start polling every 10 seconds for any scheduled events and therefore won’t be disabled.
http://169.254.169.254/metadata/scheduledevents?api-version=2017-08-01
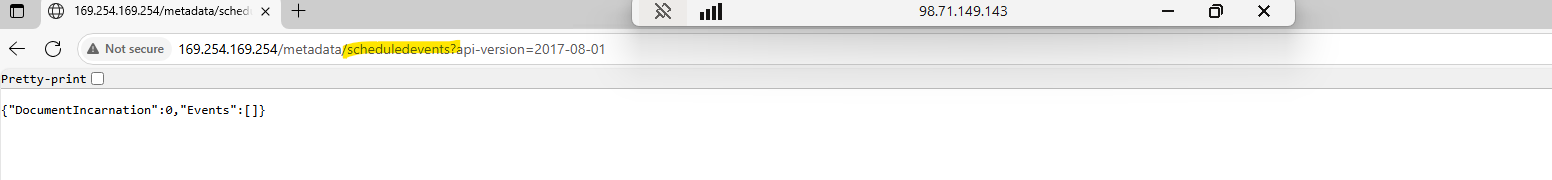
“DocumentIncarnation”: 0: This value represents the version of the scheduled events document. The number increments with each change to the events list. The number itself isn’t a problem; it simply tells you that the document has been refreshed or updated, but no new events have been added.
“Events”: []: The empty brackets ([]) mean that the Events array is empty. This confirms that there are no upcoming planned maintenance, host health issues, or other events that are scheduled to affect our VM at this time. Our VM/availability set is currently not subject to any platform-initiated events. This is the desired output that is healthy and not being impacted by Azure maintenance.
PS> Invoke-RestMethod -Headers @{"Metadata"="true"} -Method GET -Uri "http://169.254.169.254/metadata/scheduledevents?api-version=2020-07-01" | ConvertTo-Json -Depth 64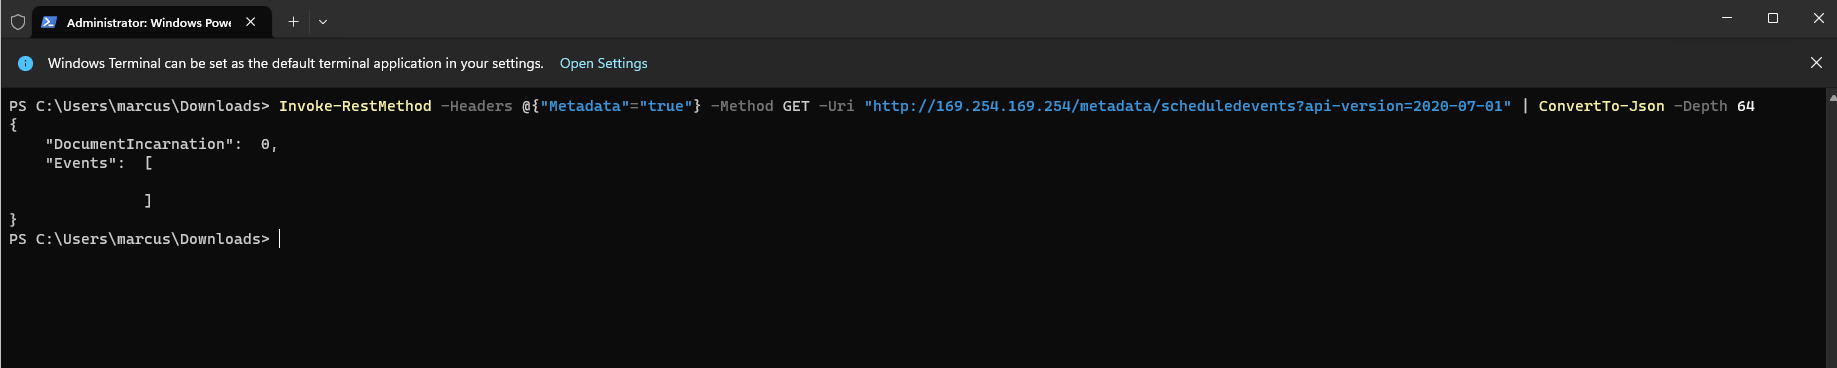
The Windows Service named AzureScheduledEvents installed by the PowerShell script as shown further above will as mentioned start polling every 10 seconds for any scheduled events.
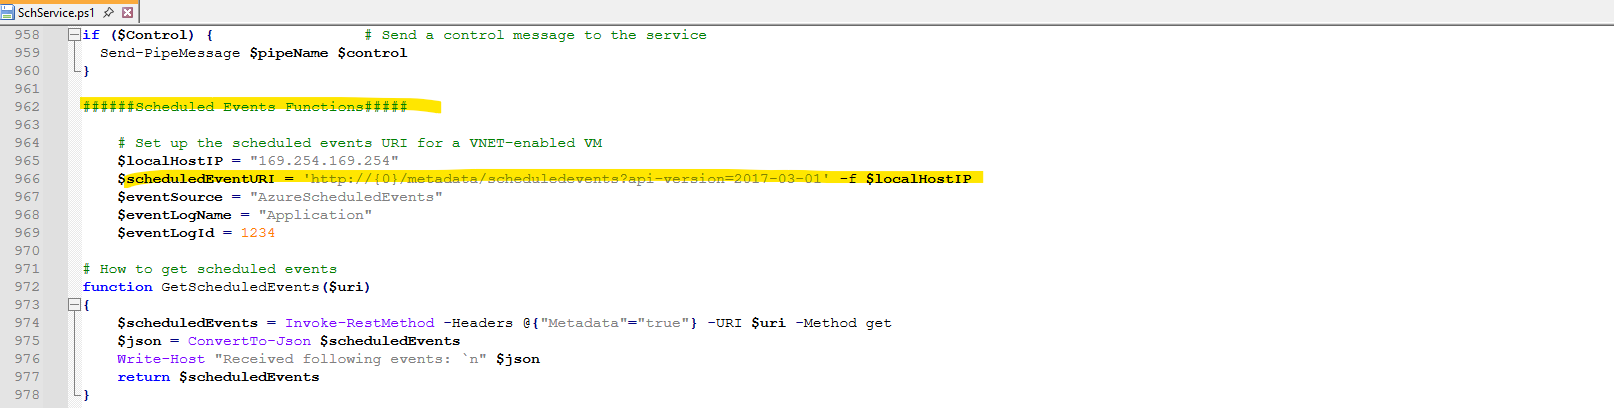
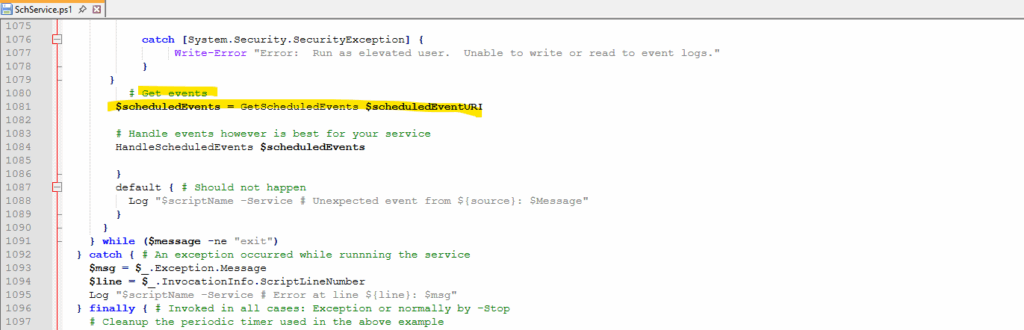
Below we can see some parts of the code in the SchService.ps1 PowerShell script.
Here we will see the Instance Metadata Service (IMDS) Uri to retrieve metadata about scheduled events for our virtual machine availability set.
We will also see here the function GetScheduledEvents($uri) which finally will poll every 10 seconds for any scheduled events.
And for any scheduled events they occur, auto approve will be executed by the function ApproveScheduledEvent and its Invoke-RestMethod -Uri $uri method as already shown further above.
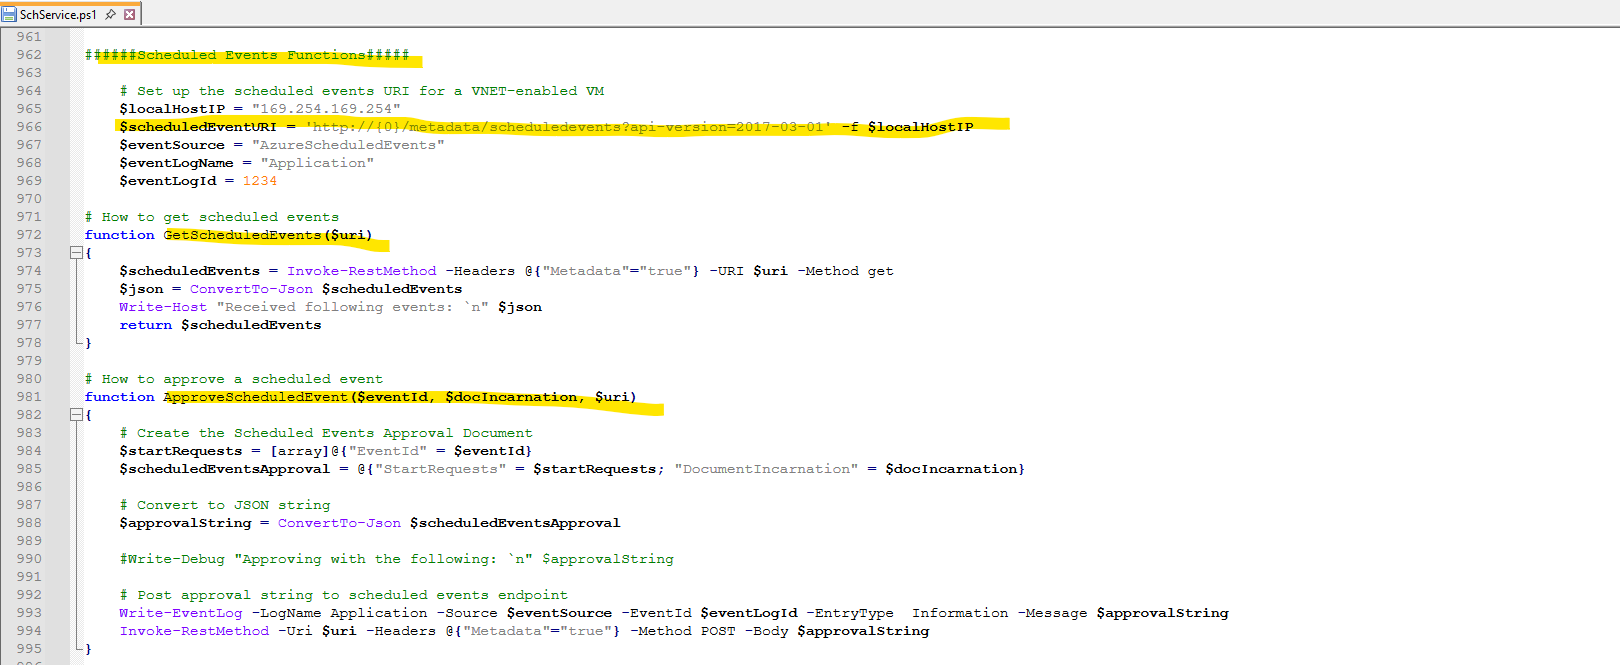
The interval is set to 10 seconds to request the endpoint of the Azure Instance Metadata Service (IMDS) for scheduled events.
Azure Instance Metadata Service (IMDS) endpoint Uri.
$scheduledEventURI = ‘http://{0}/metadata/scheduledevents?api-version=2017-03-01’ -f $localHostIP
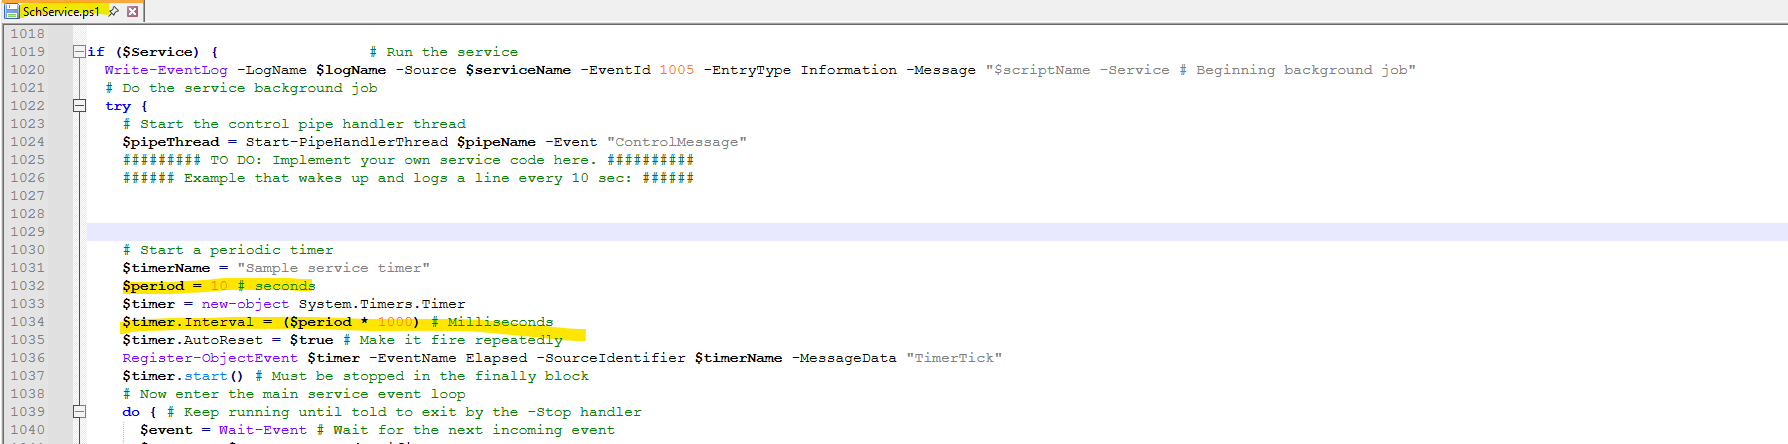
The GetScheduledEvents($uri) function which will connect to the endpoint Uri (Invoke-RestMethod) to request the endpoint of the Azure Instance Metadata Service (IMDS) for scheduled events.
$scheduledEvents = Invoke-RestMethod -Headers @{“Metadata”=”true”} -URI $uri -Method get
Determine Planned Maintenance or Service Issues in Azure
Azure offers a suite of experiences to keep you informed about the health of your cloud resources. This information includes current and upcoming issues such as service impacting events, planned maintenance, and other changes that might affect your availability.
Azure status overview
The Azure status page provides you with a global view of the health of Azure services and regions, along with service availability.
Anyone can visit the Azure status page and view incidents related to all services that report service health and incidents with wide-ranging impact.
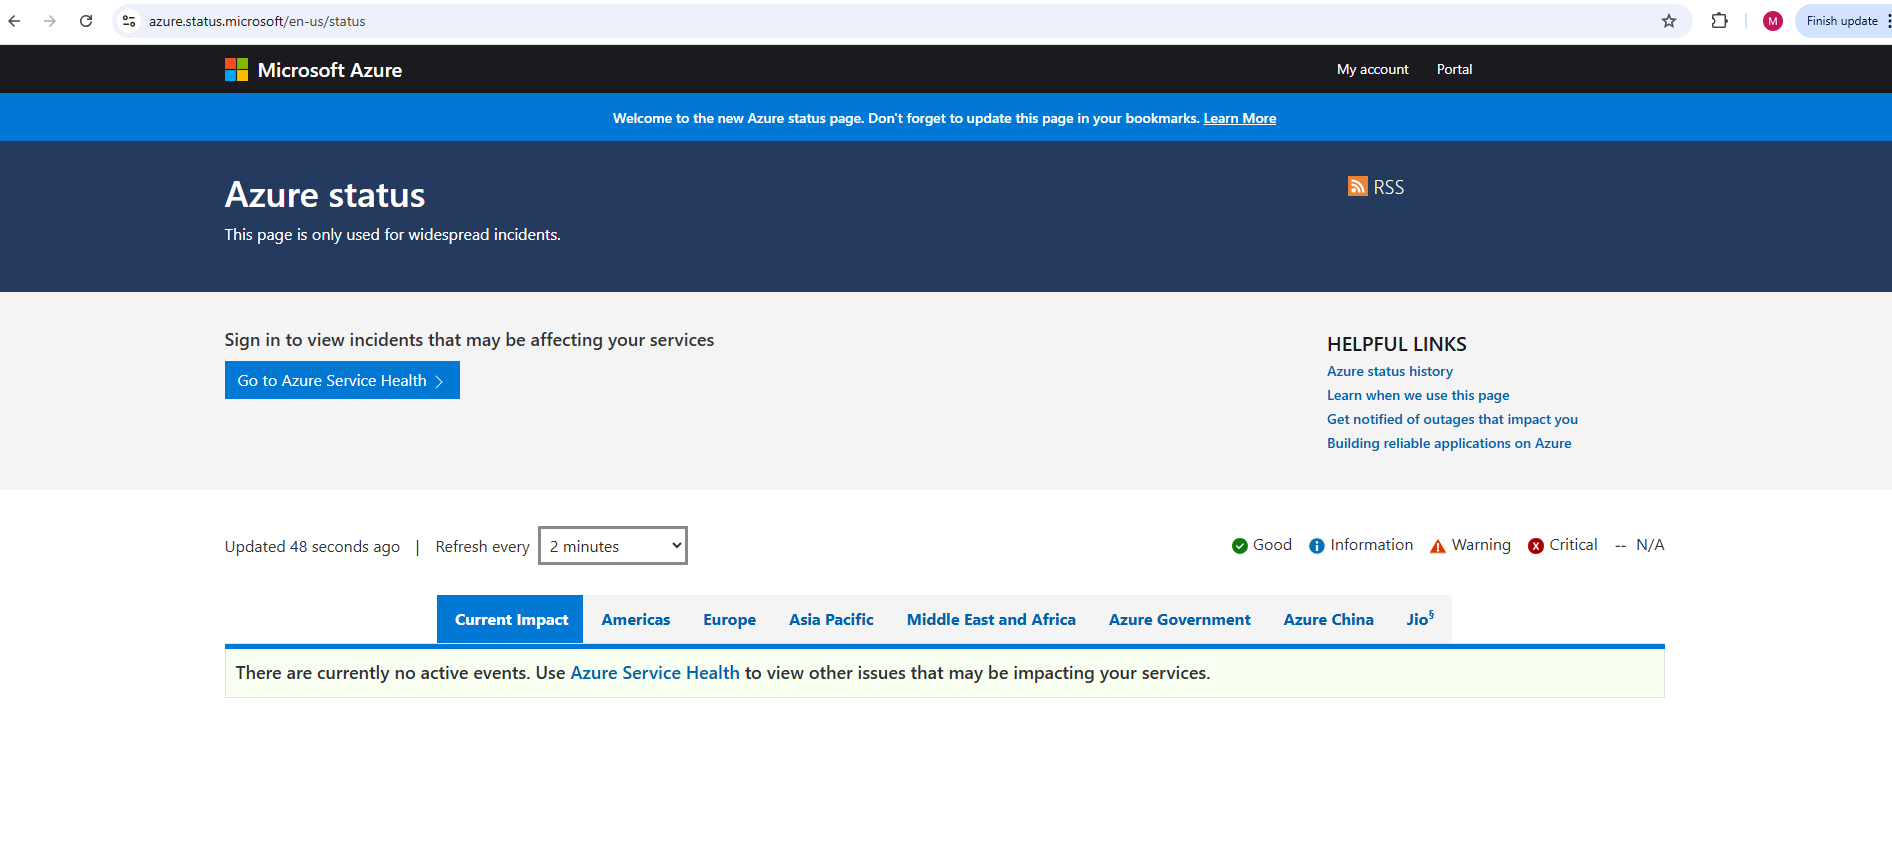
However, we strongly encourage current Azure users to use the personalized experience in Azure Service Health as it includes all the outages, upcoming planned maintenance activities, and service advisories.
Source: https://learn.microsoft.com/en-us/azure/service-health/azure-status-overview
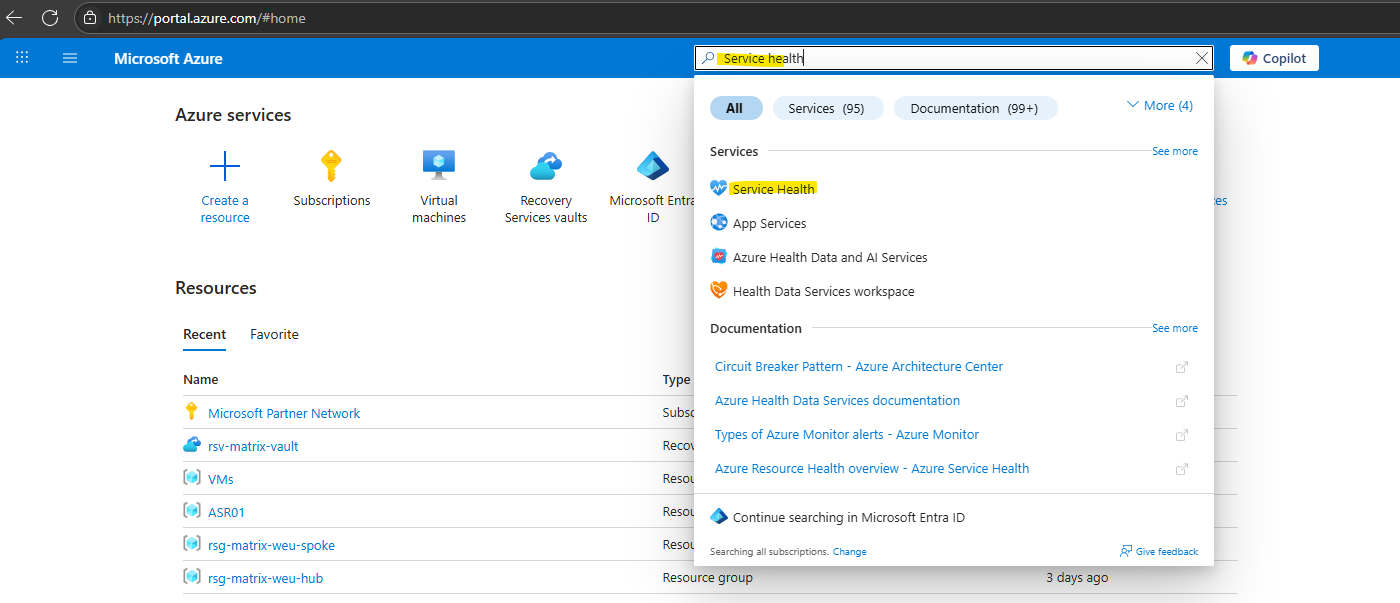
Azure Service Health
The Service Health portal is part of the Service Health service. The portal provides you with a customizable dashboard that tracks the health of your Azure services in the regions where you use them.
By using the Azure Service Health portal, you can engage with service events and manage actions and alerts to maintain the business continuity of affected applications. In this dashboard, you can track active events like ongoing service issues, upcoming planned maintenance, relevant health advisories, and billing updates. For more information about the portal elements and controls, see Azure portal overview.
You can use the Service Health dashboard to create and manage Service Health alerts, which proactively notify you when service issues are affecting you.
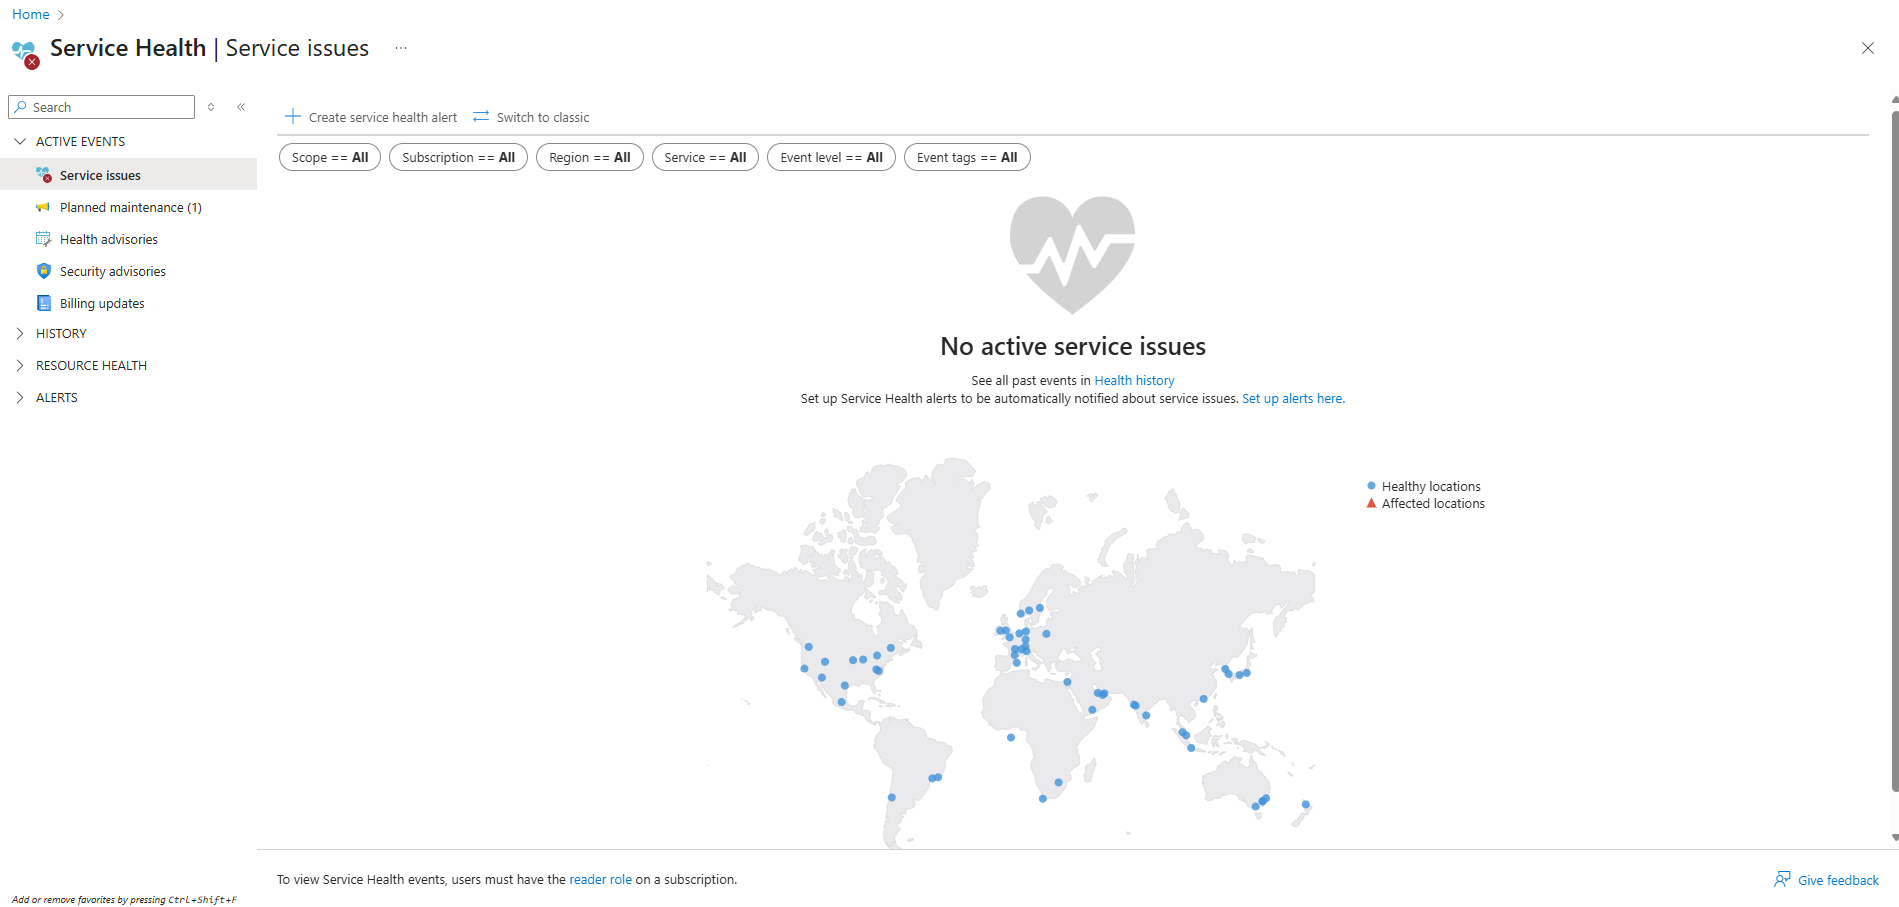
The Service Health portal tracks five types of health events that might affect your resources:
- Service issues: Problems in the Azure services that affect you right now.
- Planned maintenance: Upcoming maintenance that can affect the availability of your services in the future.
- Health advisories: Changes in Azure services that require your attention. Examples include deprecation of Azure features or upgrade requirements (like needing to upgrade to a supported PHP framework).
- Security advisories: Security-related notifications or violations that might affect the availability of your Azure services.
- Billing updates: Billing communications related to your subscription.
Select Service issues on the left menu to see a map with all user services across the world. This information can help you find services that could be affected from an outage, based on your subscription or tenant admin access.
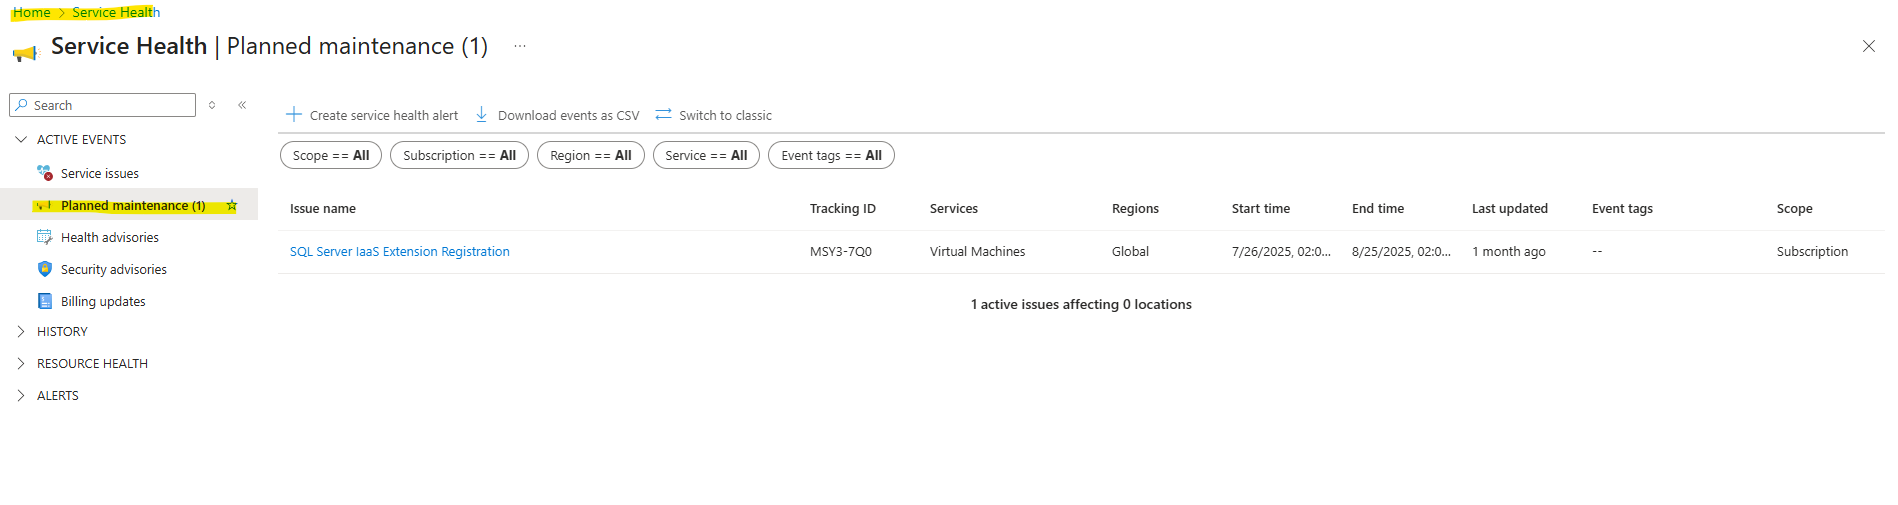
Select Planned maintenance on the left menu to see a list of all planned maintenance events. For more information, see View affected resources for planned maintenance events.
More about the Azure Service Health portal you will find here https://learn.microsoft.com/en-us/azure/service-health/service-health-portal-update.
Azure Dedicated Hosts
Azure Dedicated Host is a service that provides physical servers able to host one or more virtual machines assigned to one Azure subscription.
Dedicated hosts are the same physical servers used in our data centers, provided instead as a directly accessible hardware resource. You can provision dedicated hosts within a region, availability zone, and fault domain. You can then place VMs directly into your provisioned hosts in whatever configuration best meets your needs.
Benefits
Reserving the entire host provides several benefits beyond those of a standard shared virtual machine host:
- Cost Optimization: With the Azure hybrid benefit, you can bring your own licenses for Windows and SQL to Azure. For more information, see Azure Hybrid Benefit.
- Reliability: You have near complete control over maintenance events initiated by the Azure platform. While most maintenance events have little to no impact on your virtual machines, there are some sensitive workloads where each second of pause can have an impact. With dedicated hosts, you can opt in to a maintenance window to reduce the impact to your service.
- Performance Efficiency: Because you have control over a physical host, you can choose which applications share physical resources such as memory and storage. This can speed up certain workloads that benefit from low latency and high throughput on the host machine.
- Security: Hardware isolation at the physical server level allows for sensitive memory data to remain isolated within a physical host. No other customer’s VMs will be placed on your hosts. Dedicated hosts are deployed in the same data centers and share the same network and underlying storage infrastructure as other, non-isolated hosts.
Source: https://learn.microsoft.com/en-us/azure/virtual-machines/dedicated-hosts
Azure Fault Domain vs. Update Domain
Azure Fault Domains (FDs) provide physical separation to protect against hardware failures (like power or network issues) by placing VMs on different hardware racks with independent power and networking.
Azure Update Domains (UDs) provide logical separation to protect against planned software maintenance by ensuring that VMs are updated or rebooted in a staggered manner, with only one UD affected at a time.
Links
Maintenance for virtual machines in Azure
https://learn.microsoft.com/en-us/azure/virtual-machines/maintenance-and-updatesHandling planned maintenance notifications
https://learn.microsoft.com/en-us/azure/virtual-machines/maintenance-notificationsMonitor scheduled events for your Windows VMs
https://learn.microsoft.com/en-us/azure/virtual-machines/windows/scheduled-event-serviceAzure Metadata Service: Scheduled Events for Windows VMs
https://learn.microsoft.com/en-us/azure/virtual-machines/windows/scheduled-eventsAzure Metadata Service: Scheduled Events for Linux VMs
https://learn.microsoft.com/en-us/azure/virtual-machines/linux/scheduled-eventsAzure Metadata Service: Scheduled Events Samples
https://github.com/Azure-Samples/virtual-machines-scheduled-events-discover-endpoint-for-non-vnet-vmPowershell Scheduled Events Sample
https://github.com/Azure-Samples/virtual-machines-scheduled-events-discover-endpoint-for-non-vnet-vm/tree/master/powershellAzure Dedicated Hosts
https://learn.microsoft.com/en-us/azure/virtual-machines/dedicated-hostsTutorial: Use Log Analytics
https://learn.microsoft.com/en-us/azure/azure-monitor/logs/log-analytics-tutorialAction groups
https://learn.microsoft.com/en-us/azure/azure-monitor/alerts/action-groups