Mastering GCP Virtual Machines – Part 5 (Network Analyzing)
In Part 4 we saw how GCP will encrypt the virtual disks of virtual machine instances. Further we saw how to export a disk from Google Cloud Platform (GCP) which lets us move VM data into on-premises environments like VMware vSphere.
Now in this part we will take a look at some key networking tools that help you secure and troubleshoot our environment
When running workloads in Google Cloud, visibility and control of our network are just as important as the VMs themselves.
We will see how to validate end-to-end connectivity with Network Intelligence Center’s Connectivity Tests, analyze traffic decisions with the Firewall Rule Logs Explorer, organize VM access using network target tags, and gain deep insights into traffic patterns through VPC Flow Logs.
Together, these features give you the clarity to design, operate, and harden your VM networking with confidence.
Network Intelligence (Connectivity Tests)
Google Cloud’s Network Intelligence Center is a monitoring and troubleshooting suite that helps you gain visibility into your network health and performance.
One of its most powerful features is Connectivity Tests, which lets you simulate traffic between two endpoints, such as a VM and a database, or an on-prem system and a Google Cloud service.
The test traces the packet’s path across your VPC, firewalls, routes, VPN or interconnect, and highlights where traffic is allowed or blocked.
This makes it an invaluable tool for diagnosing connectivity issues and validating firewall or routing changes before they impact production.
Below we will see how to use the Connectivity Tests feature to check if specific traffic is already allowed by firewall rules.
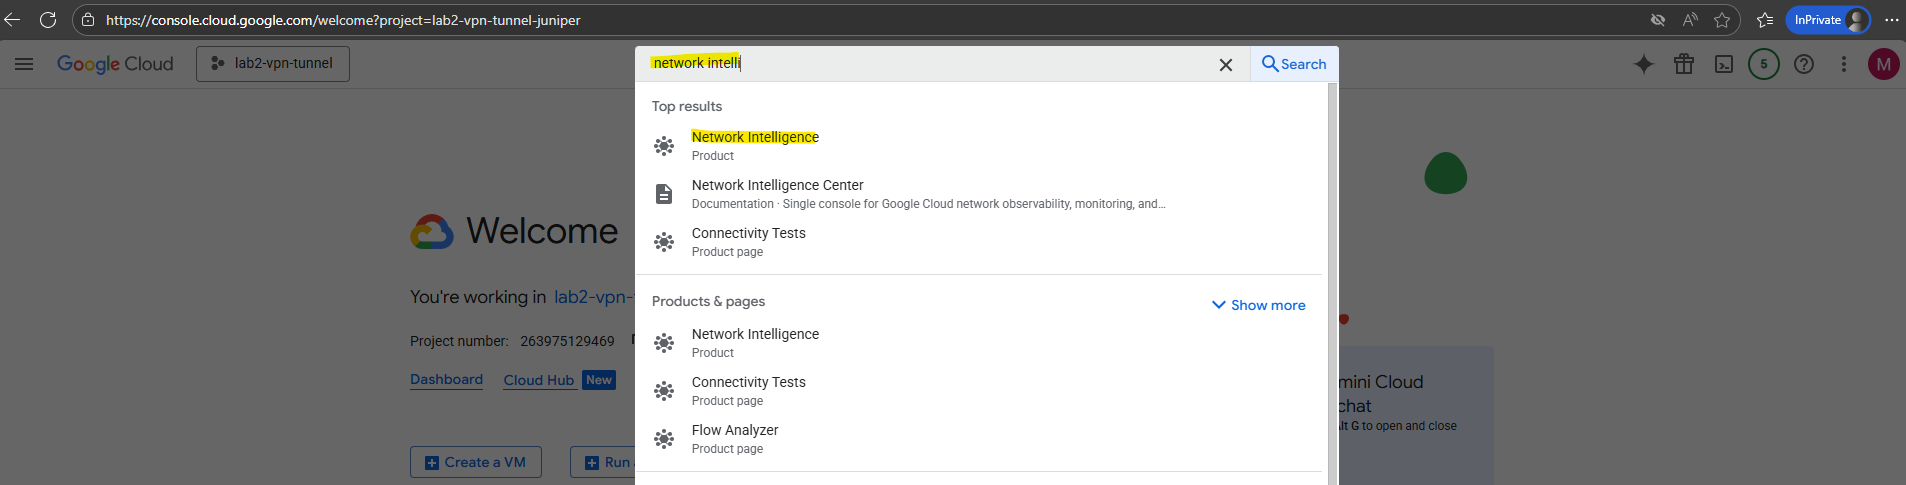
To navigate to the Network Intelligence Center, just search for network intelli …. and select below Network Intelligence.
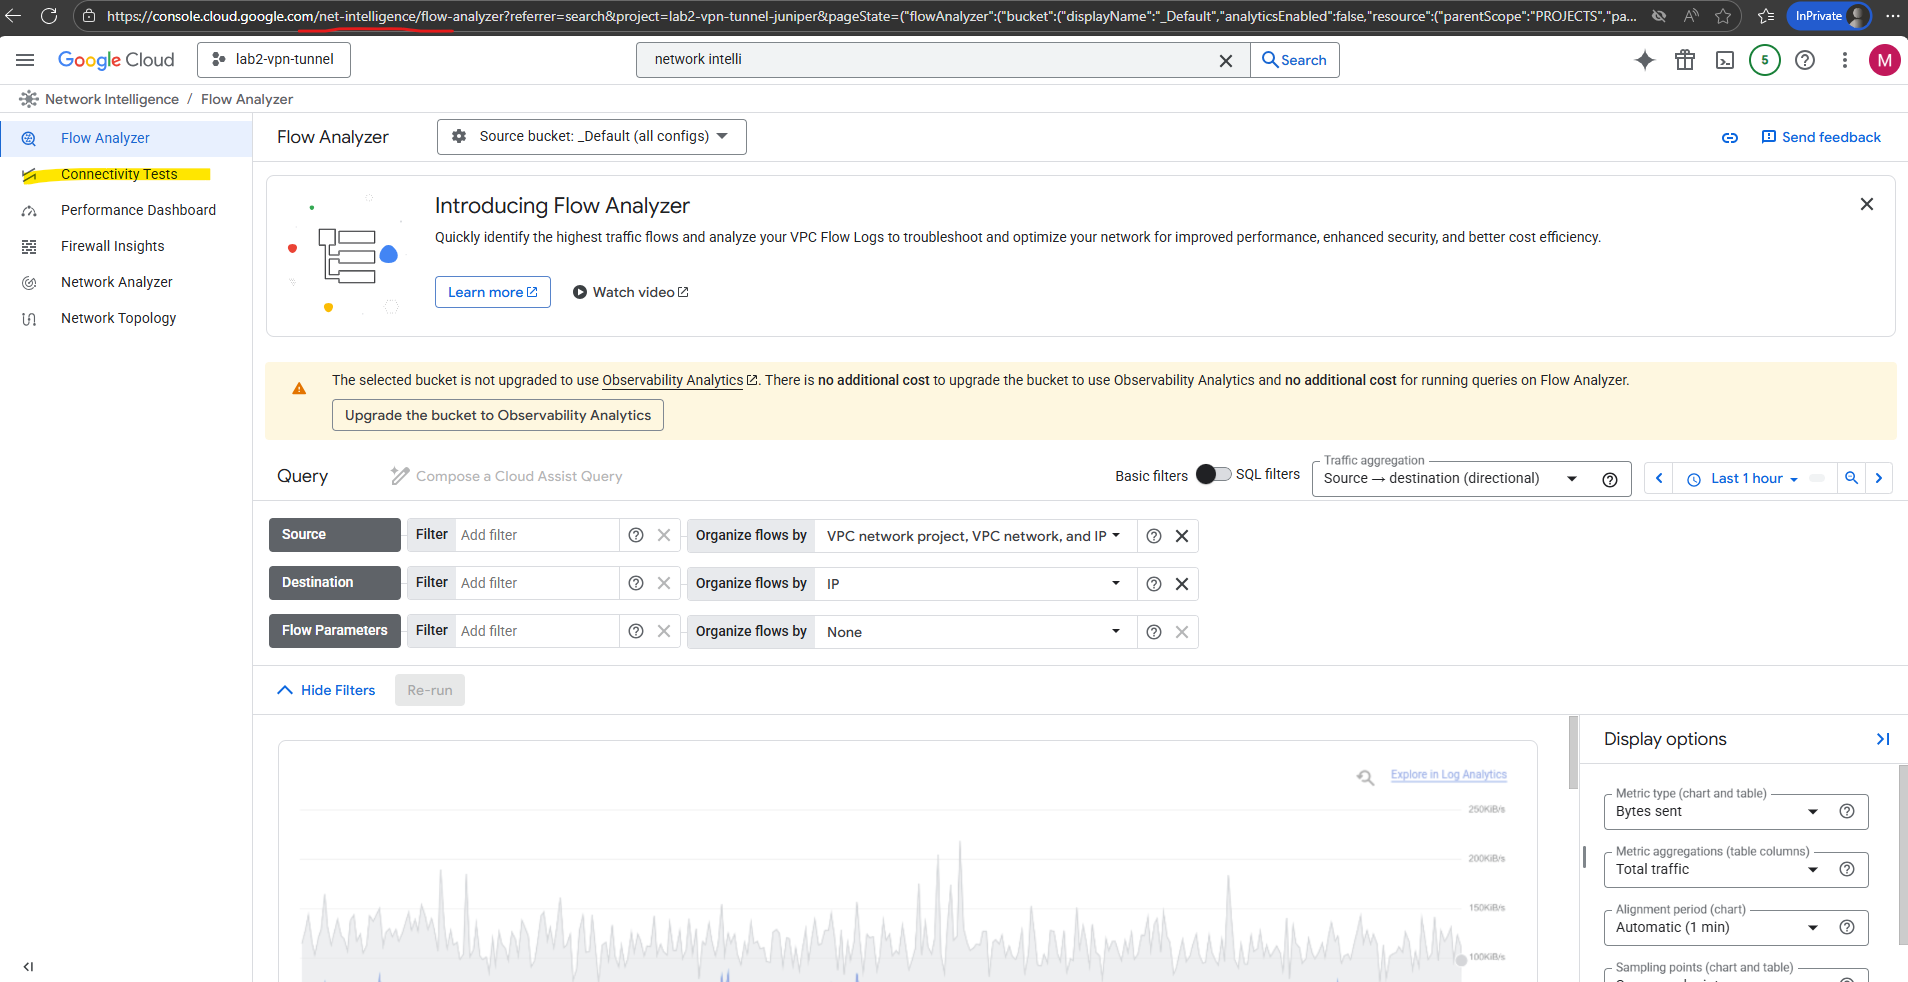
Now select Connectivity Tests.
As you can see in the link below, we can open the Network Intelligence Center also by browsing directly to the following link https://console.cloud.google.com/net-intelligence.
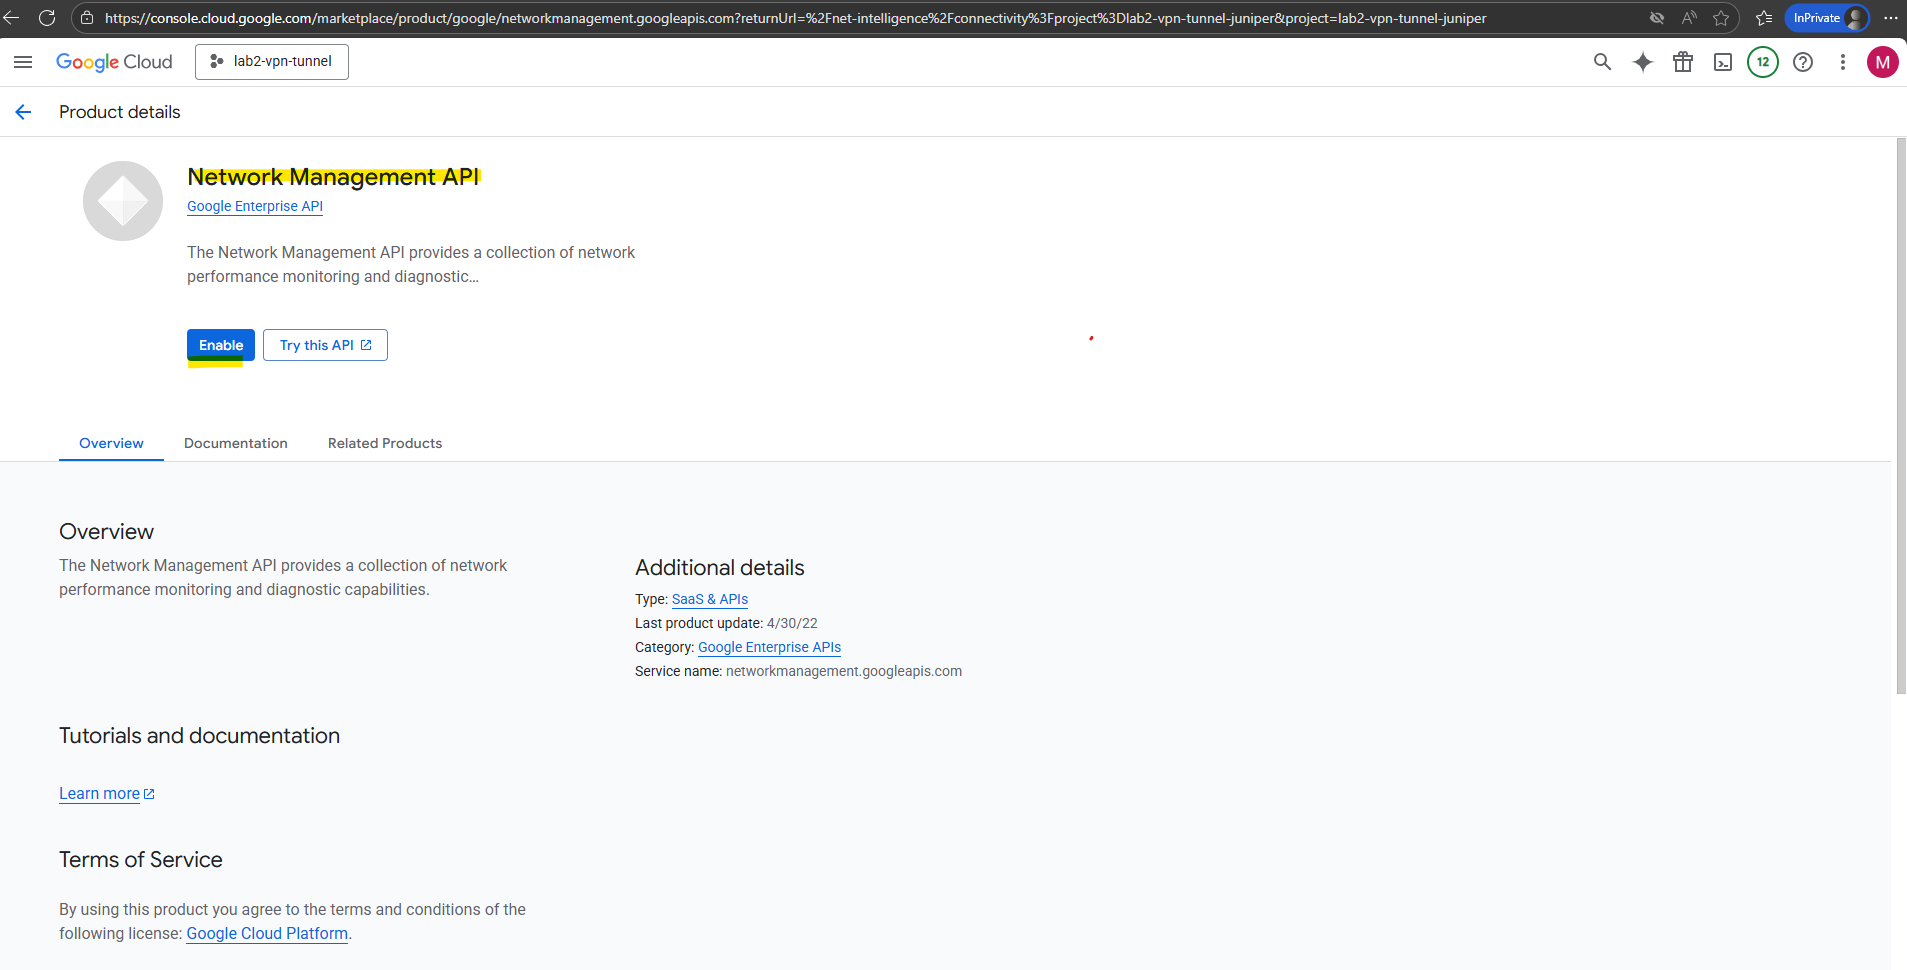
We also first need to enable the Network Management API for our project to use the features.
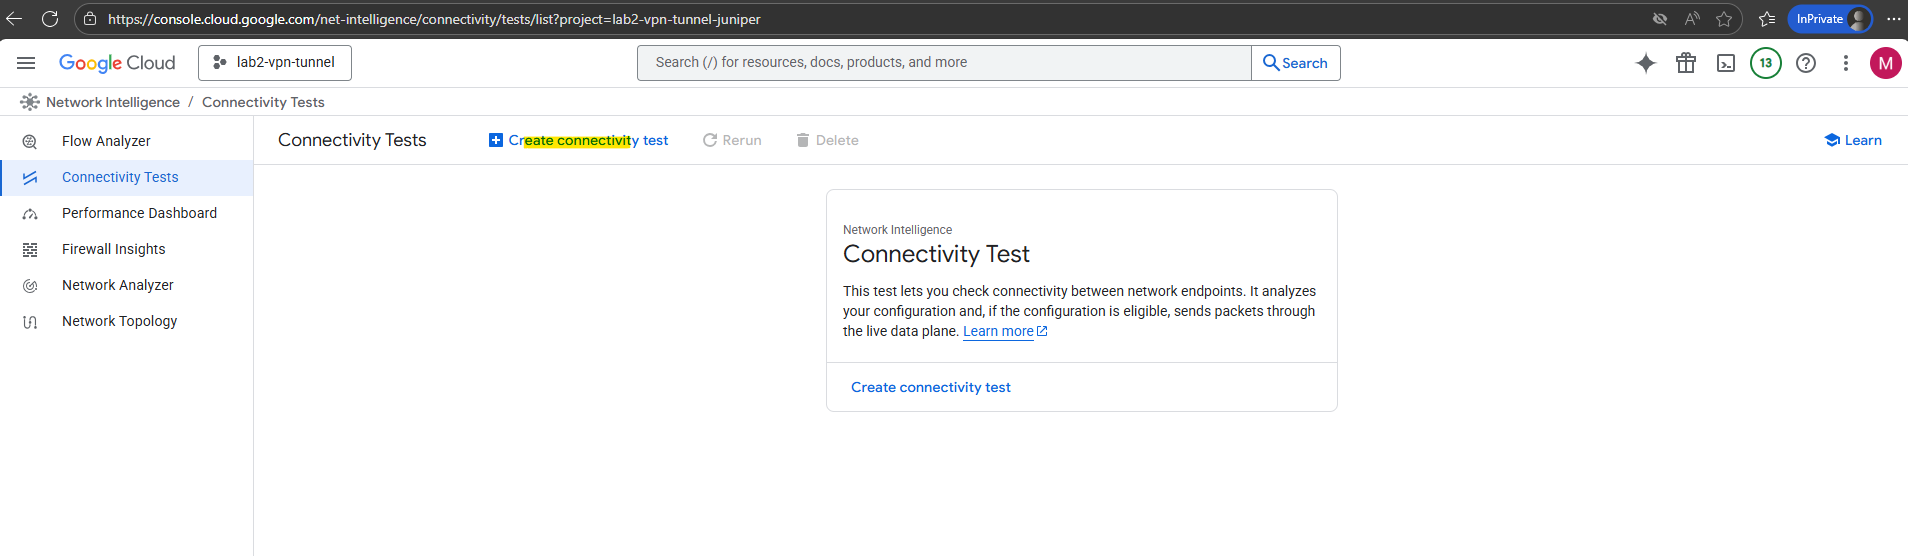
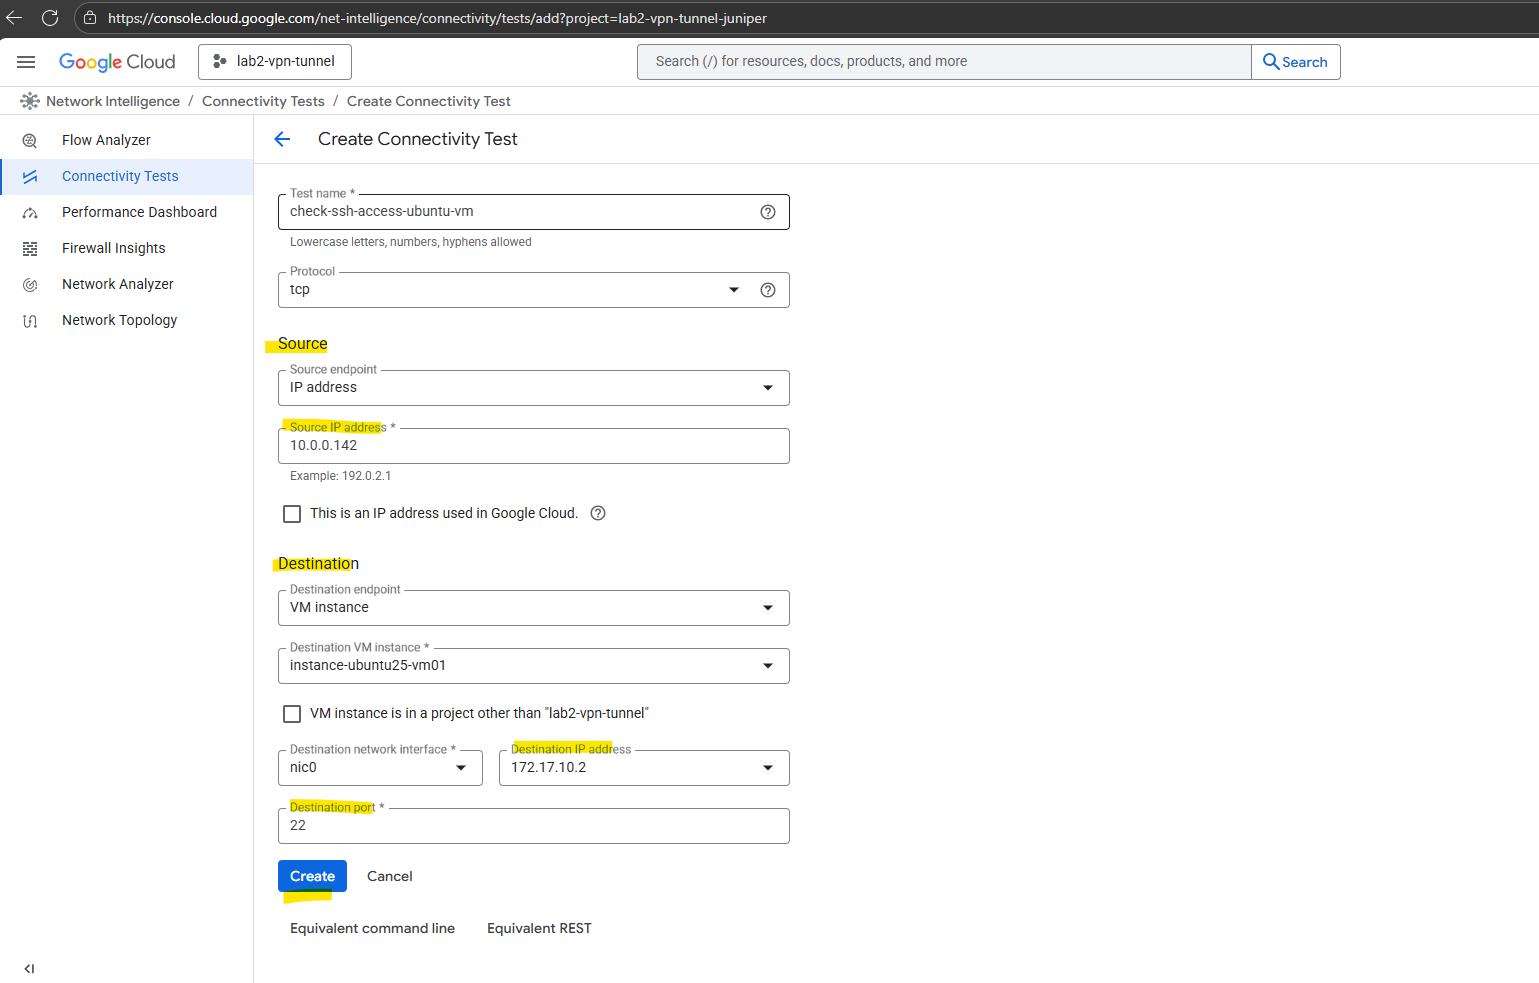
To create a new connectivity test click below on Create connectivity test.
Below I will enter for the source my on-prem virtual machine with its IP address 10.0.0.142 to test if it can access the VM instance (instance-ubuntu25-vm01) in GCP through SSH.
My on-prem network is connected through a site-to-site IPSec VPN tunnel with the GCP VPC Network.
Finally click on Create.
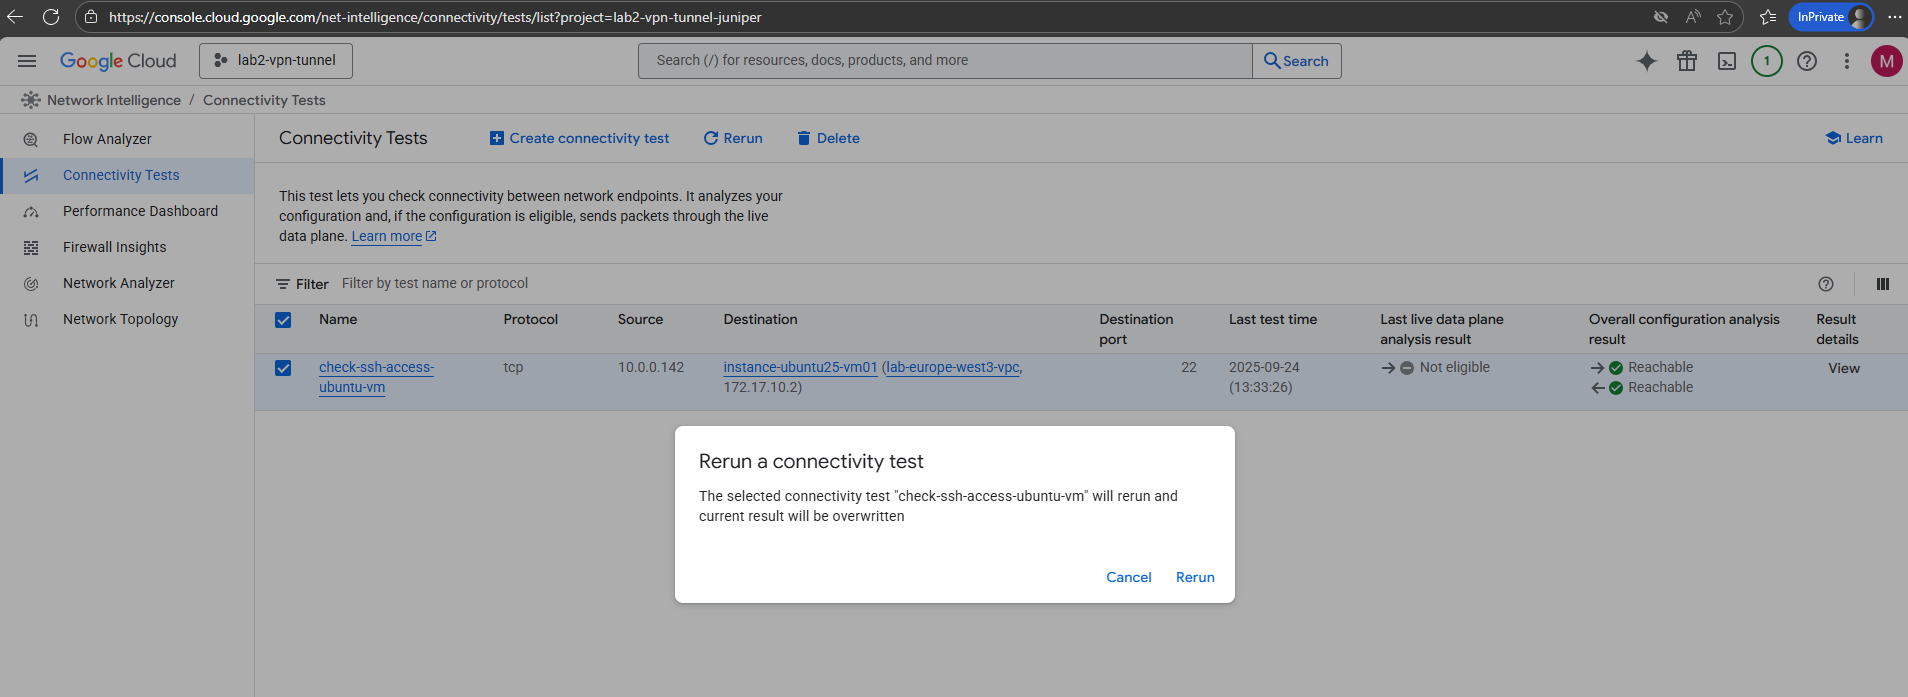
When creating the test is also running by default the first time. To rerun select the desired test you can click on Rerun below.
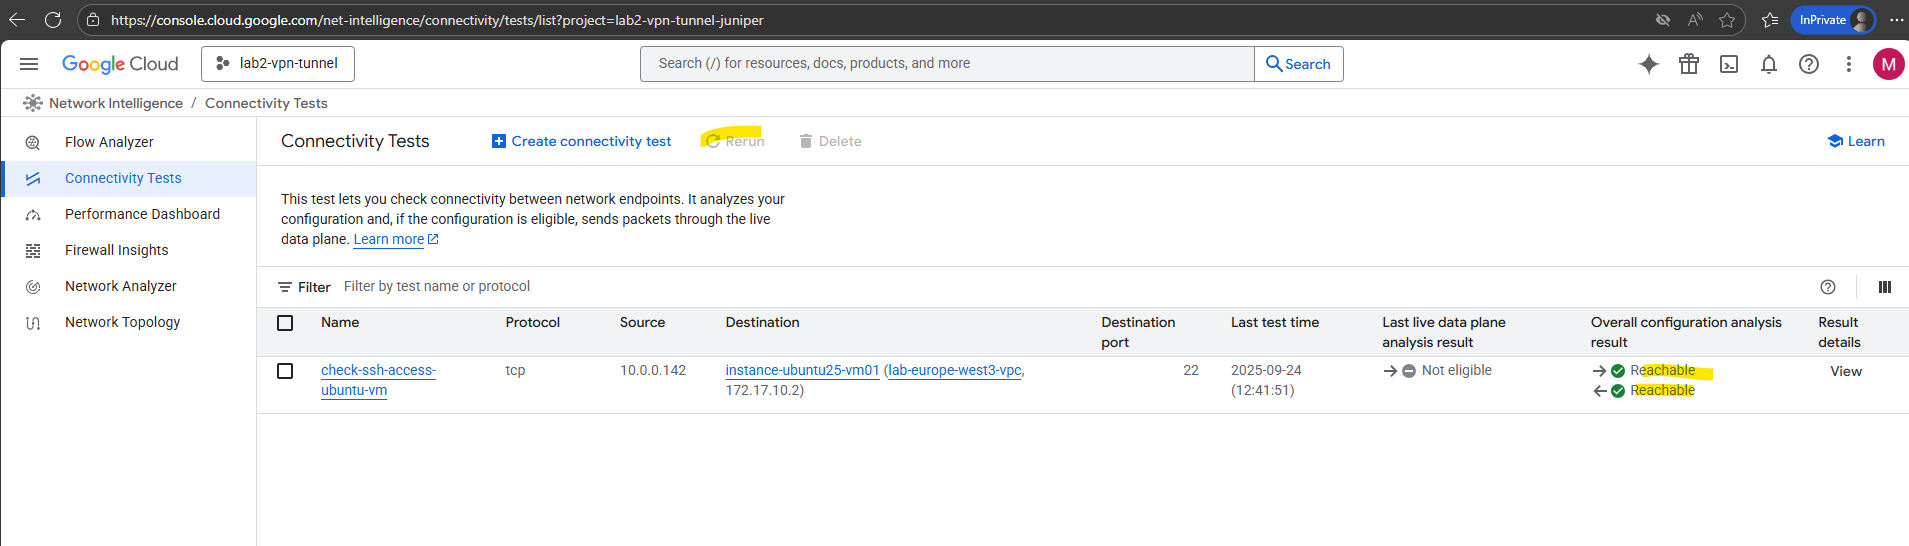
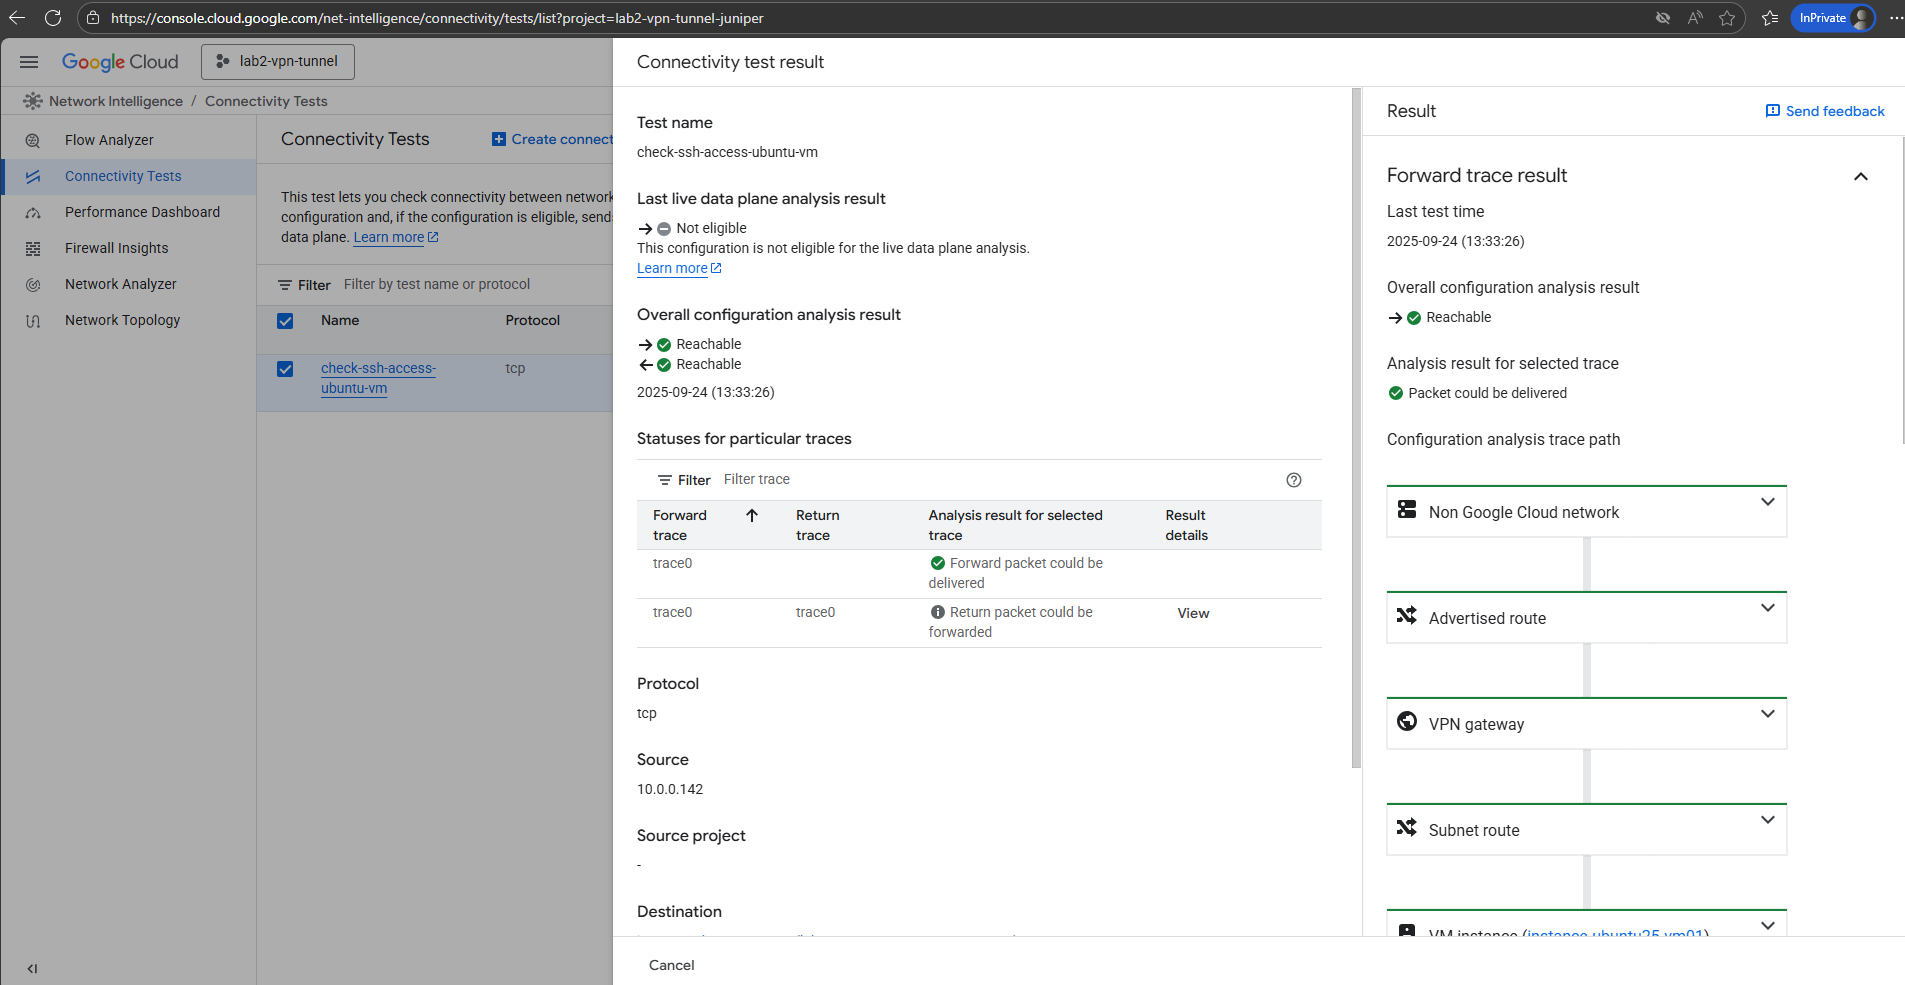
We can also view the result details by clicking the link below.
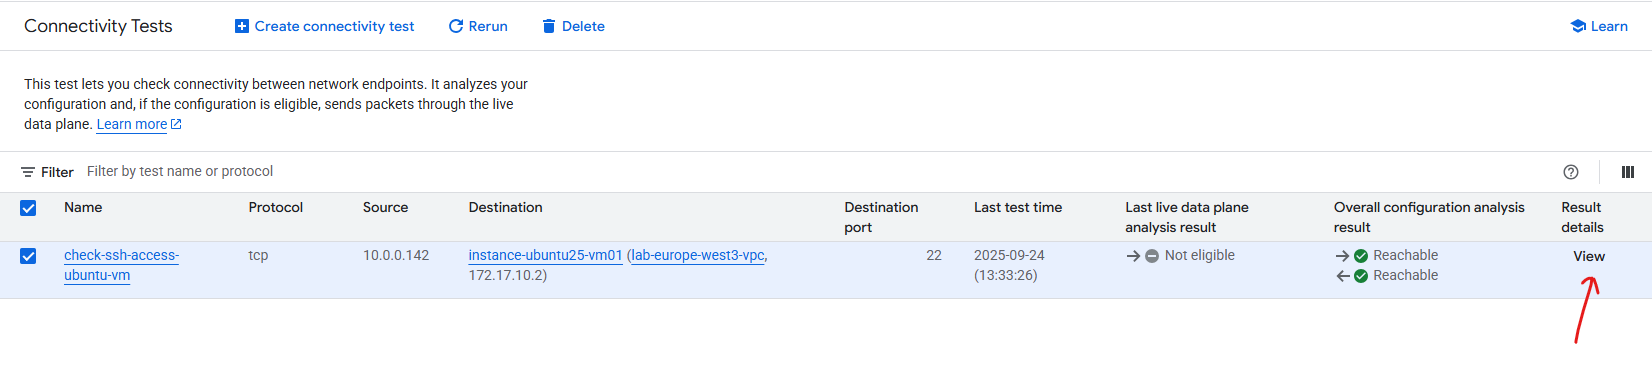
We will also see here the forward and return trace result with the traffic coming from my on-prem network and routed finally to the destination VM and its IP address.
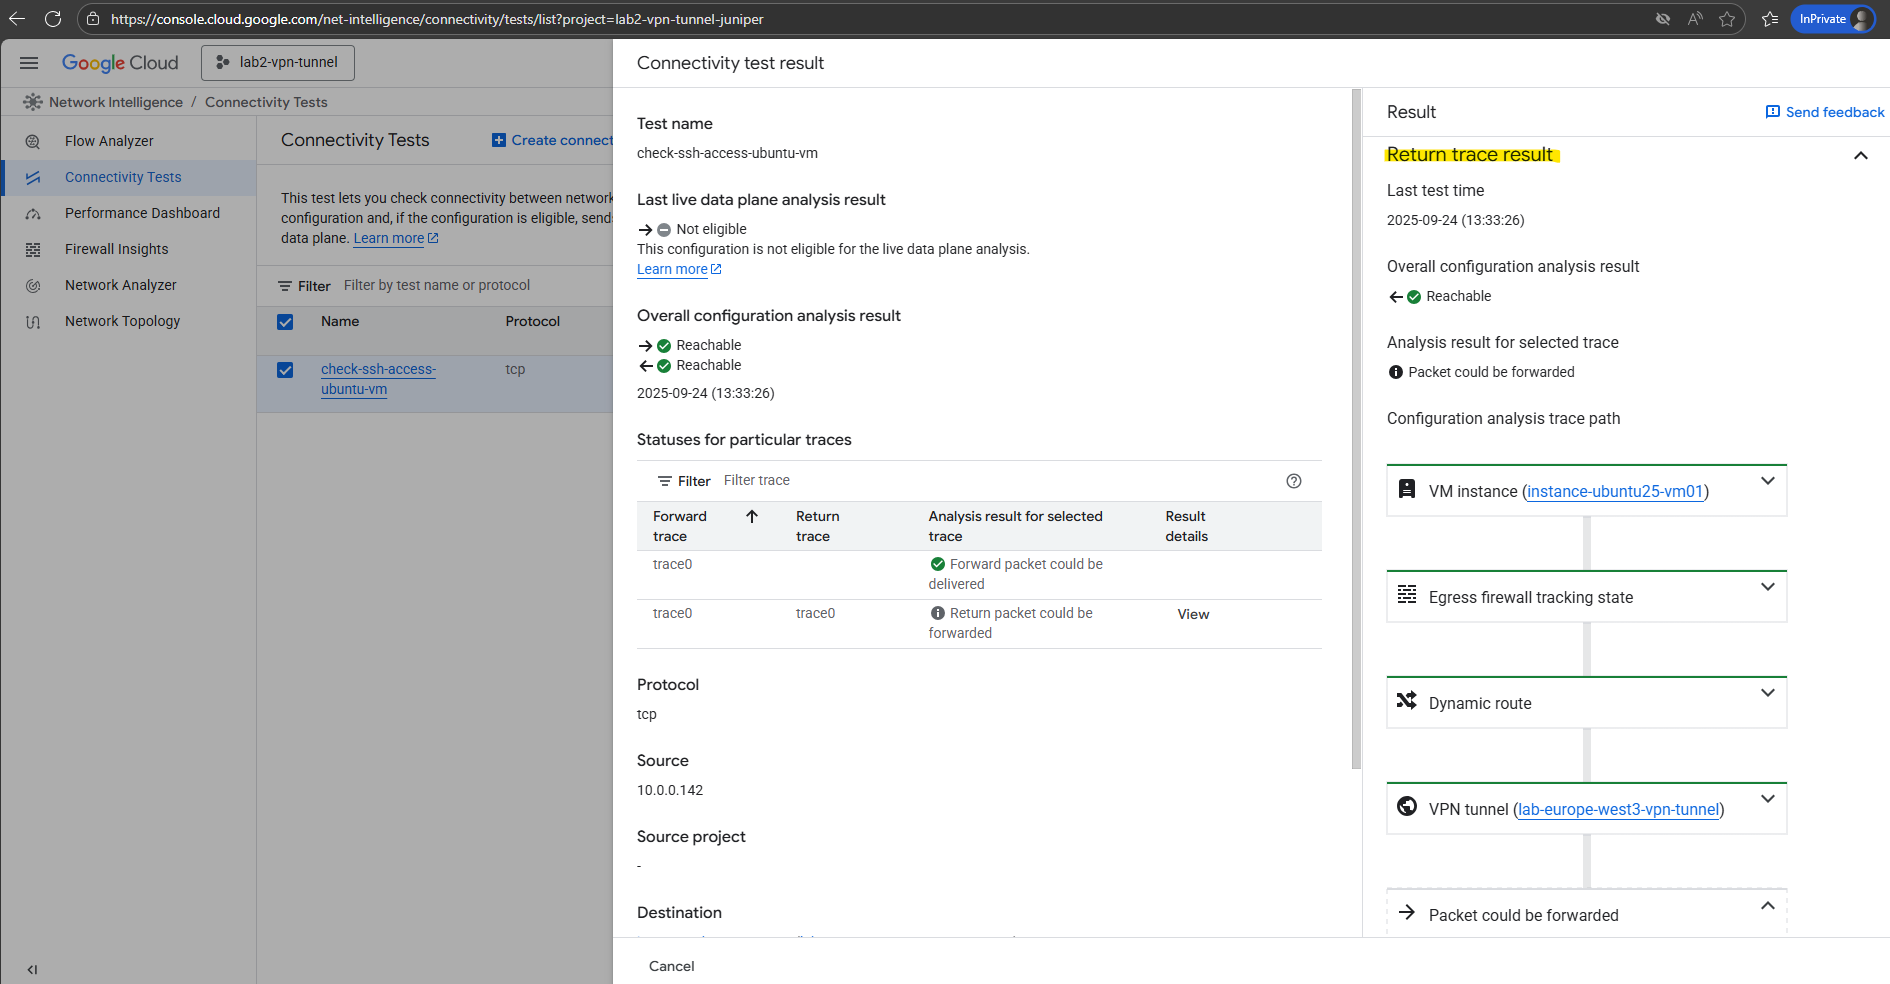
When scrolling down the results blade, we will also see the return trace result.
Firewall Rules Logs Explorer (Check if Traffic is allowed or denied by Firewall Rules)
Besides the Network Intelligence – Connectivity Tests blade as shown previously above, we can also use the firewall rule Logs Explorer to check if real traffic was allowed or denied.
If traffic is denied by the implicit default deny (the “deny all ingress” that exists if no rule matches), there are no logs written for it. So to see denied traffic in logs we first need configure explicit a deny rule for which denied traffic will get logged.
ICMP traffic like Echo request and reply messages will not be logged, just TCP and UDP connections.
Firewall Rules Logging only records TCP and UDP connections. Although you can create a firewall rule that applies to other protocols, you cannot log their connections. If you want to also log other protocols, consider using Packet Mirroring.
Source: https://cloud.google.com/firewall/docs/firewall-rules-logging#specifications
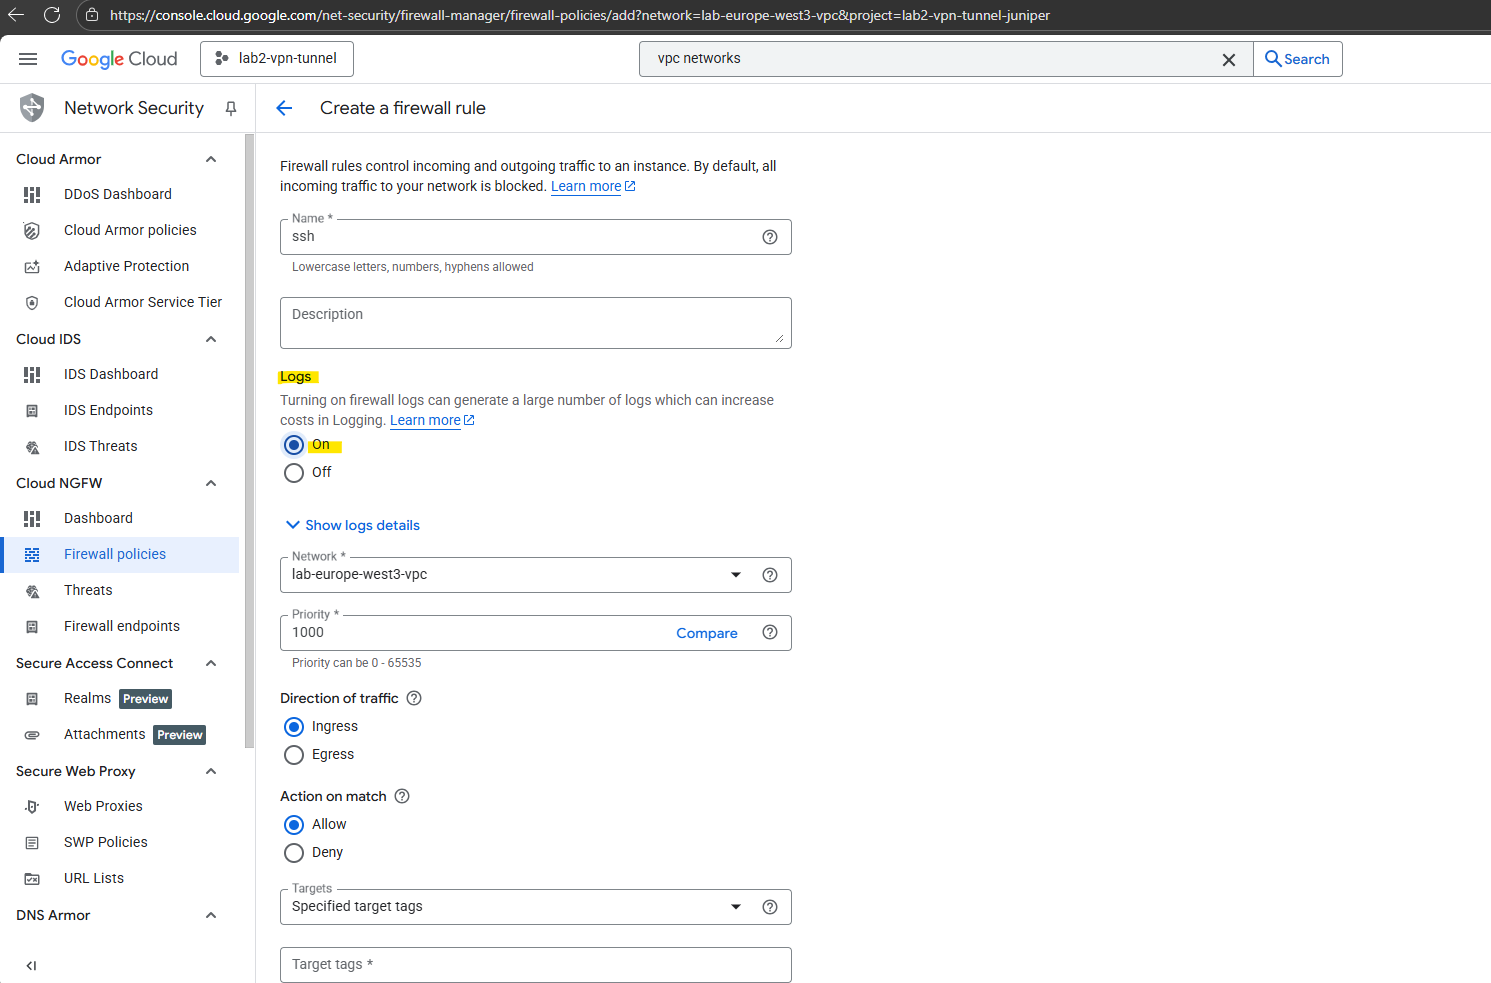
Logs need to be enabled on the firewall rule.
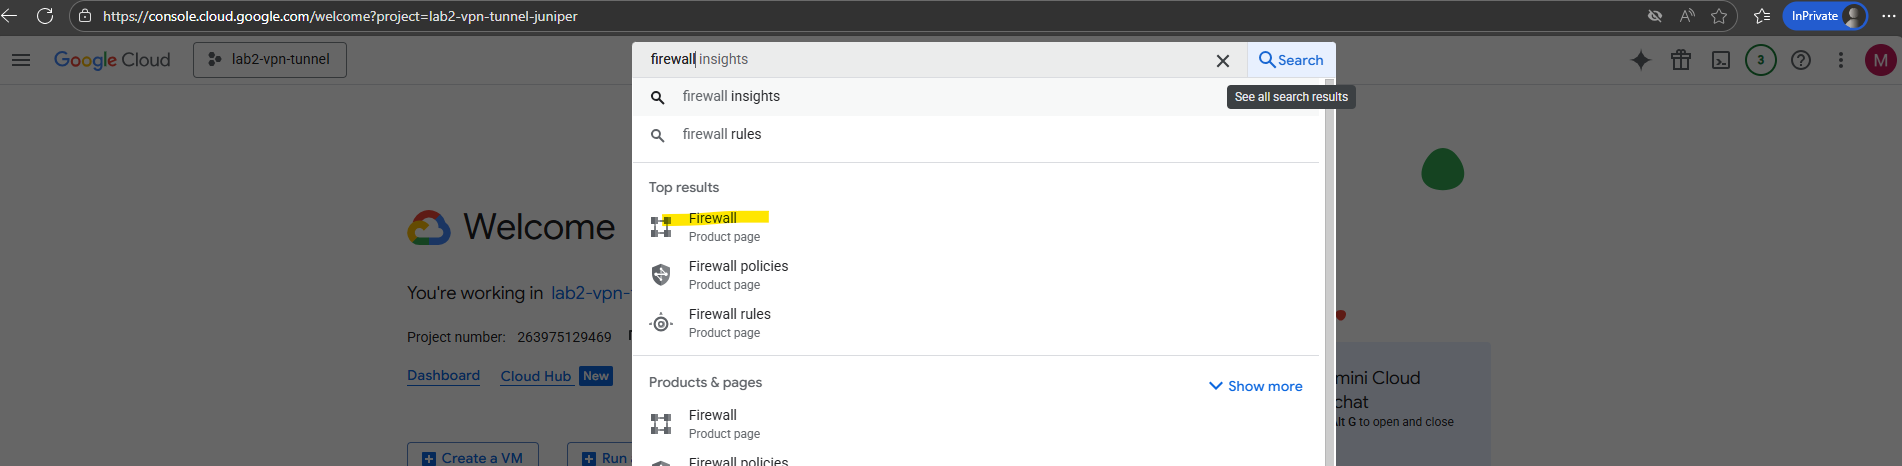
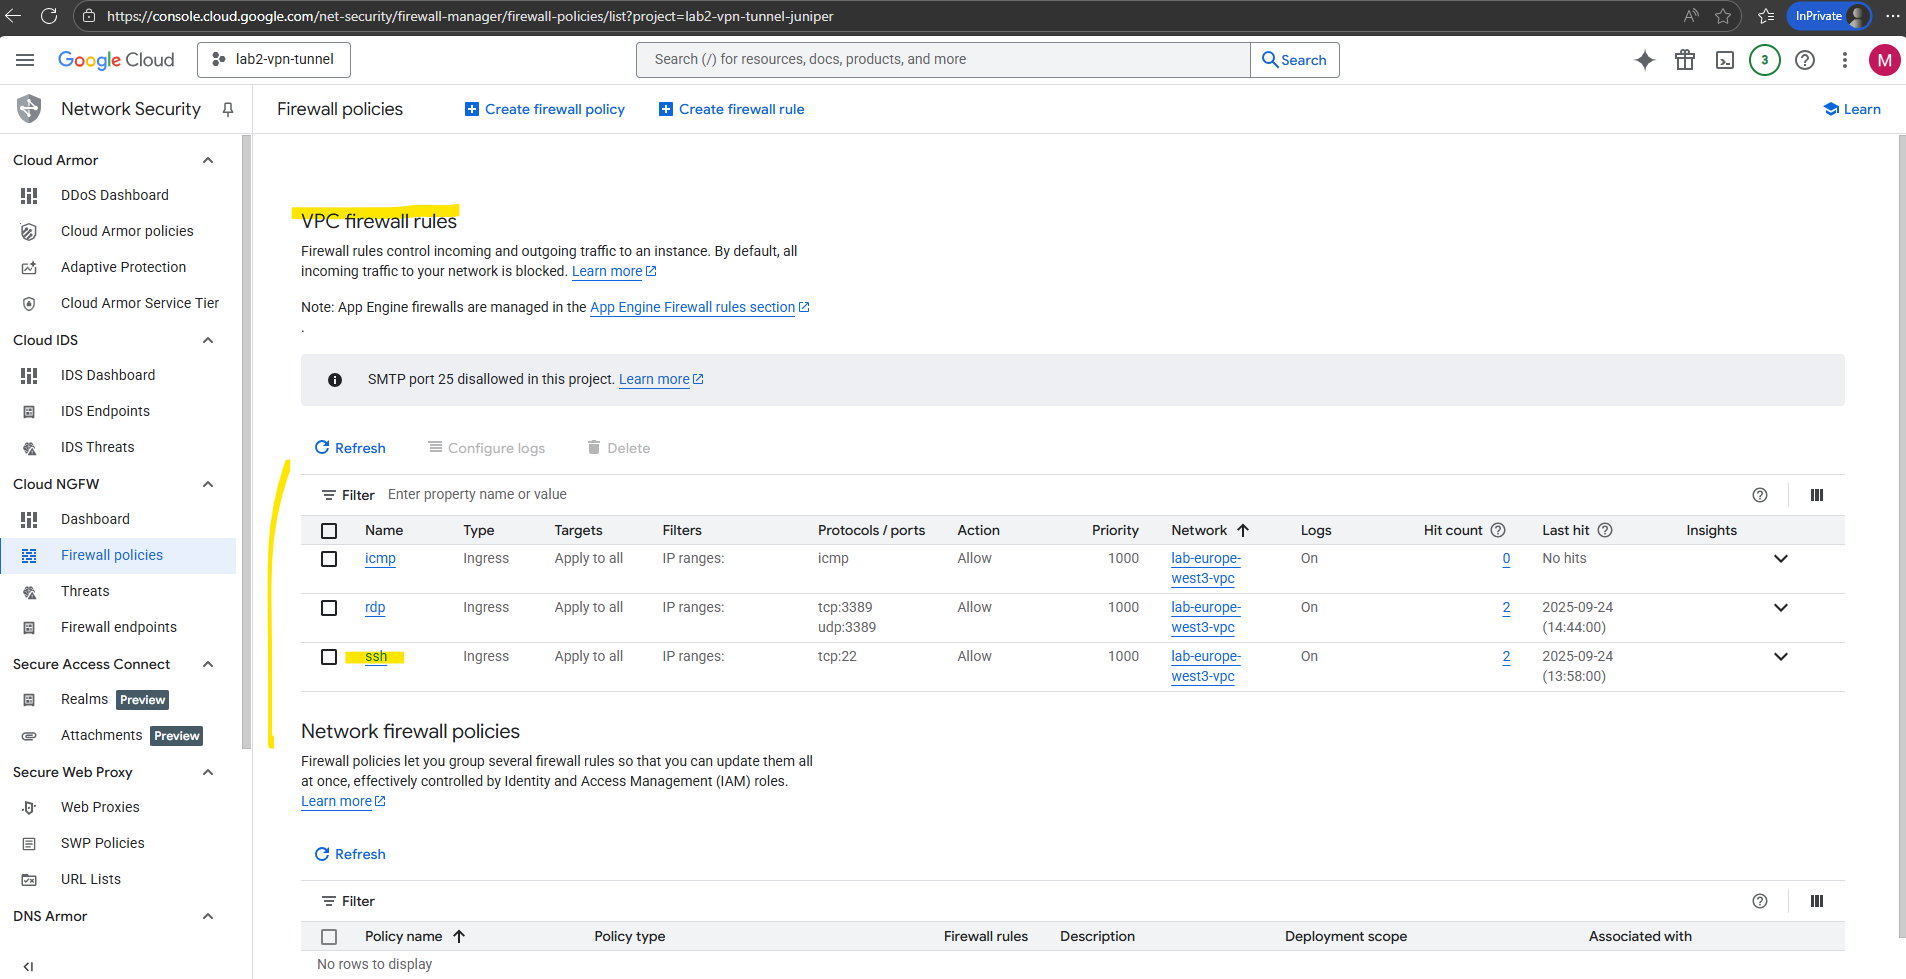
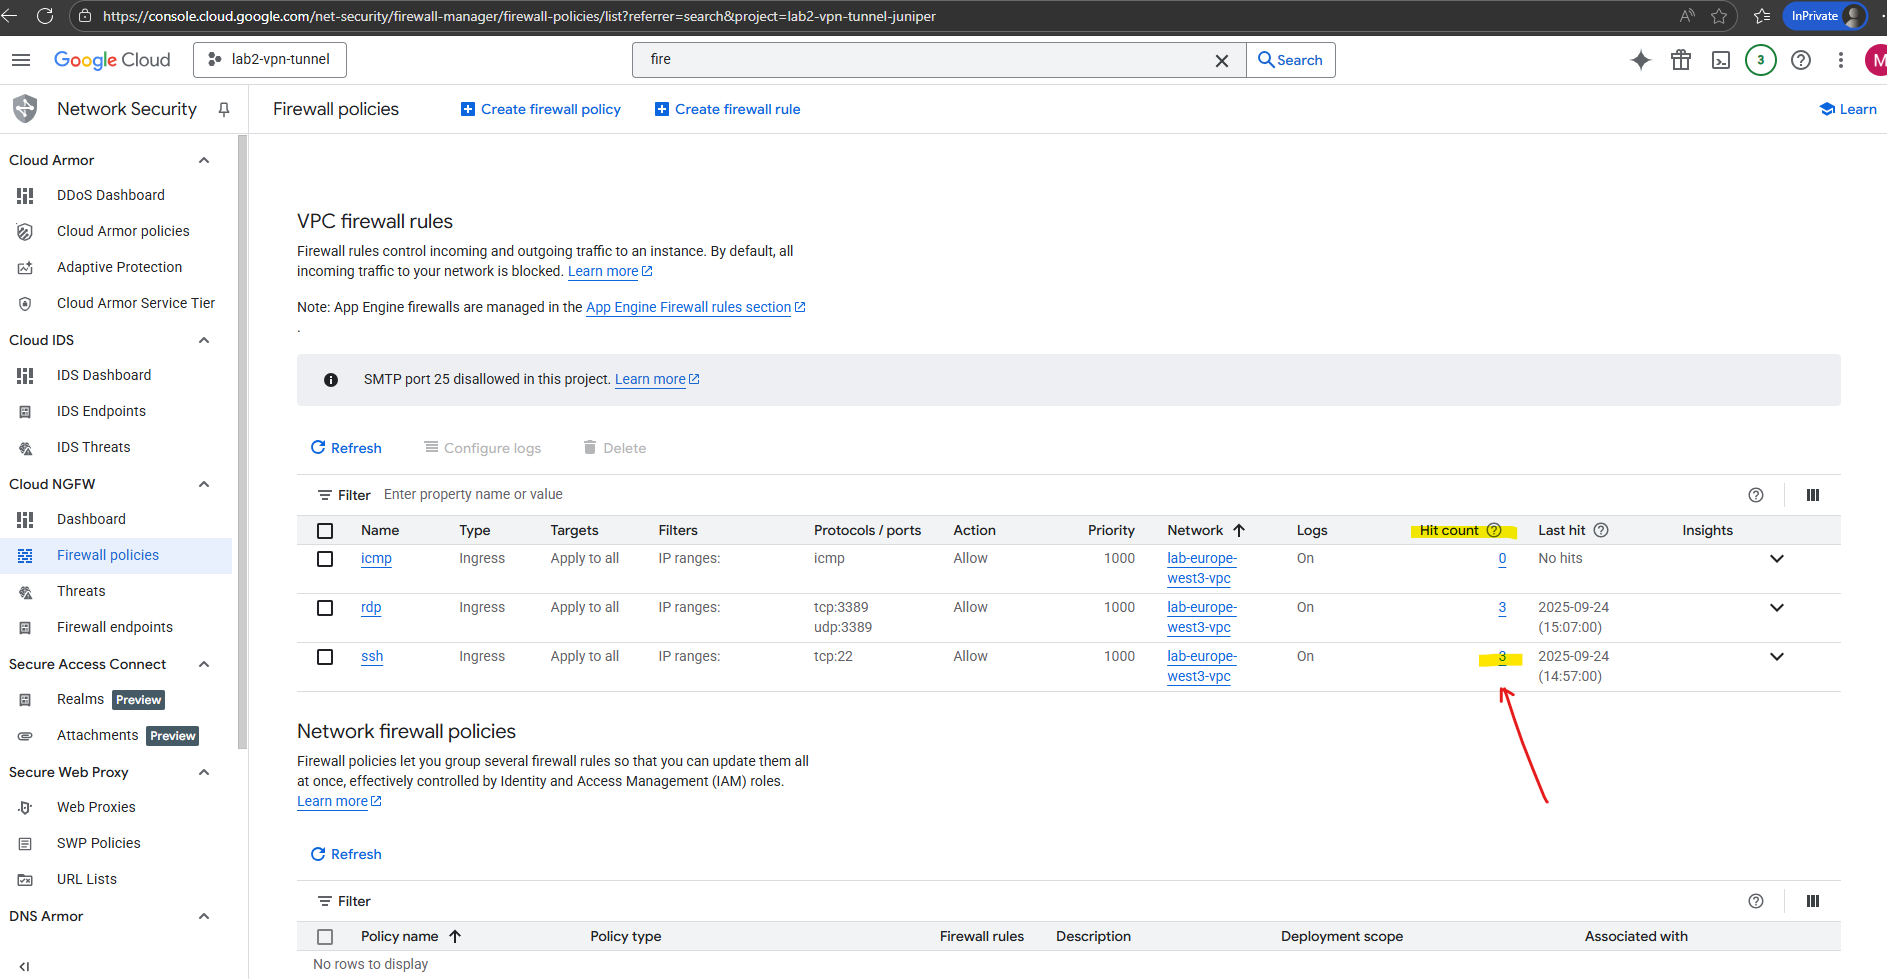
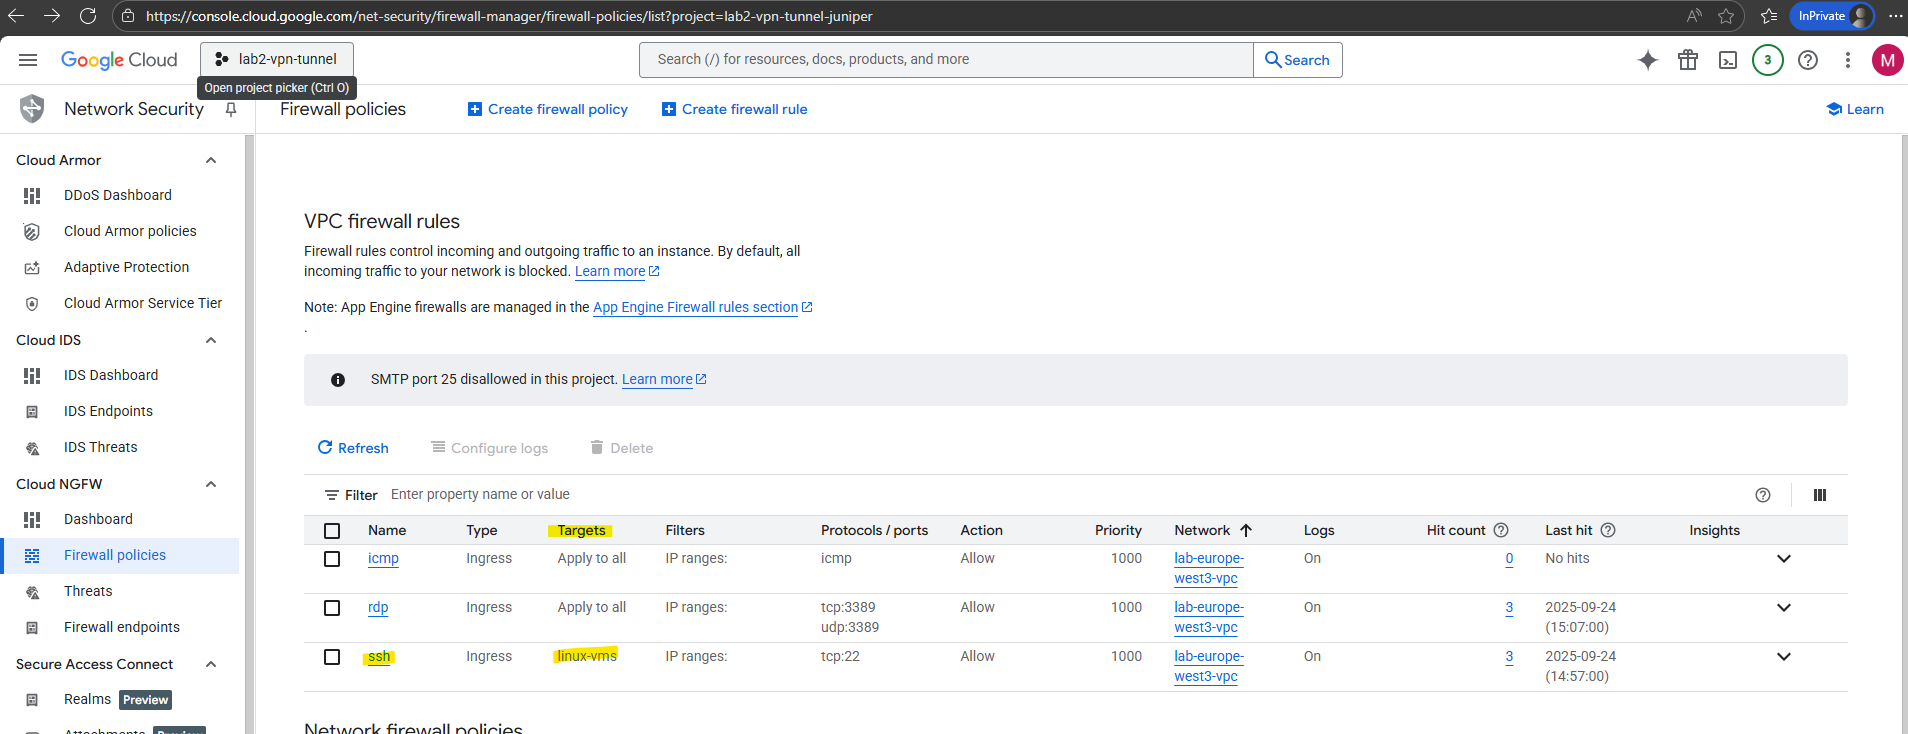
Open the firewall blade which will list the VPC firewall rules and network firewall policies.
Firewall policies let you group several firewall rules so that you can update them all at once, effectively controlled by Identity and Access Management (IAM) roles.
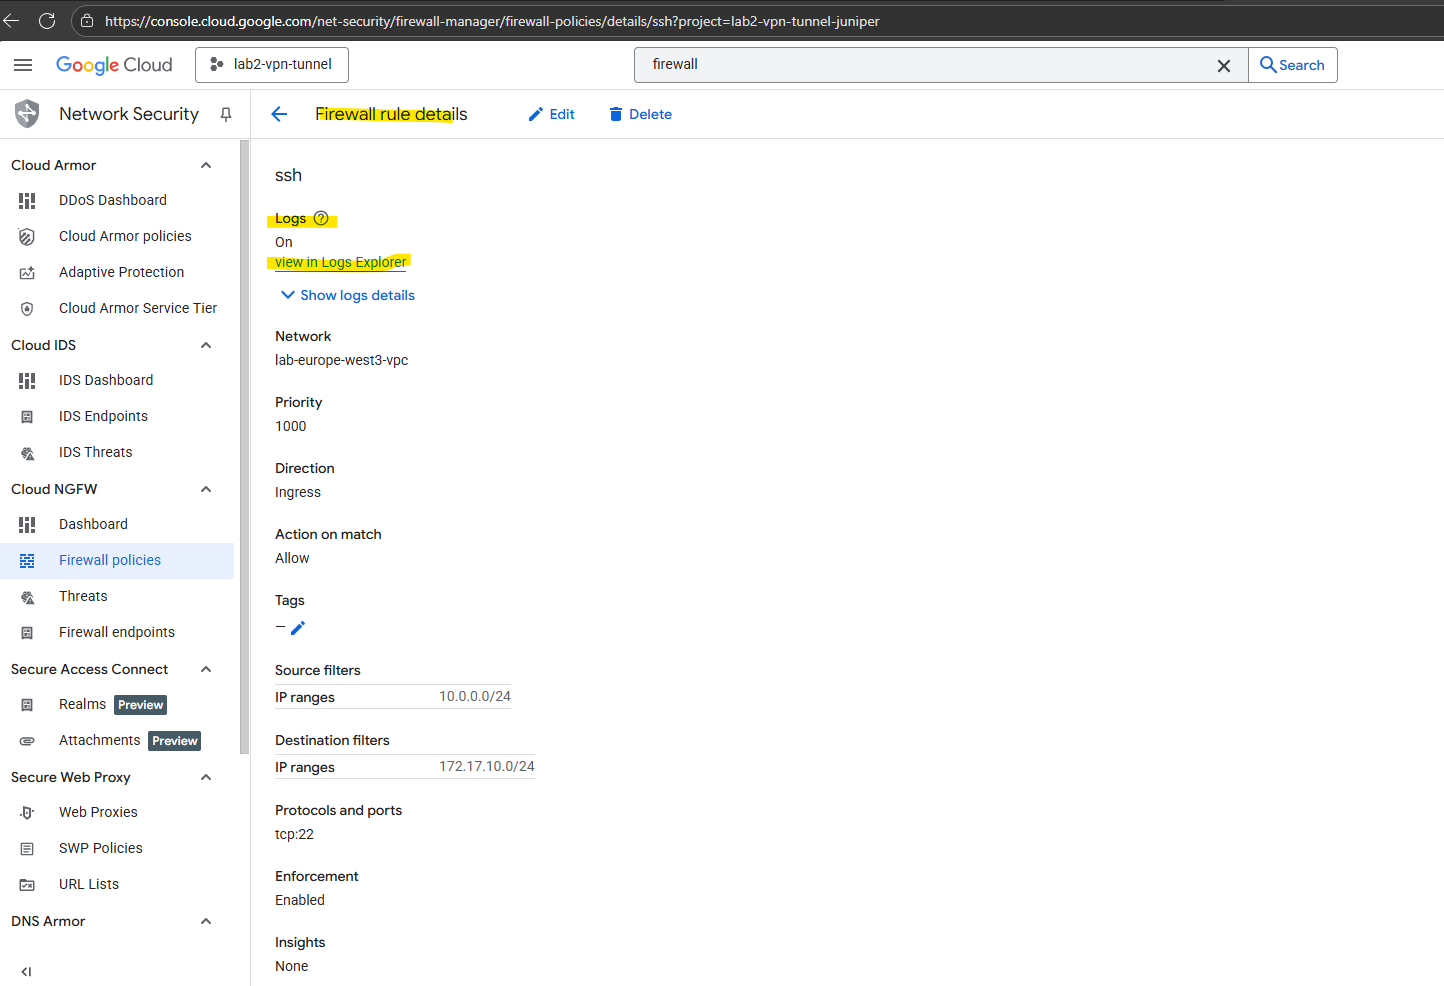
To check the firewall rule logs navigate to the desired firewall rule.
Below I want to check the logs for the SSH rule to check if SSH traffic will be allowed inbound (Ingress).
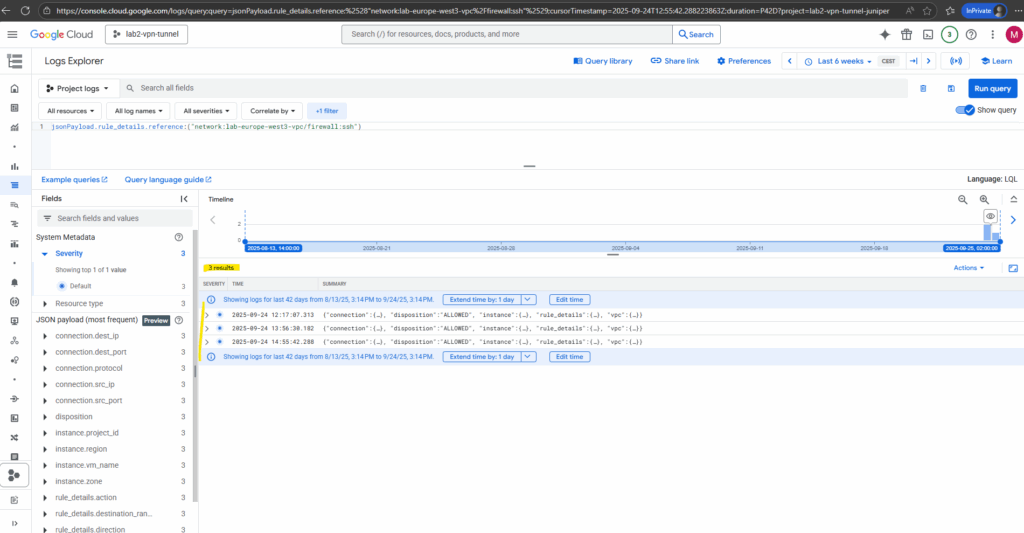
Click on view in Logs Explorer.
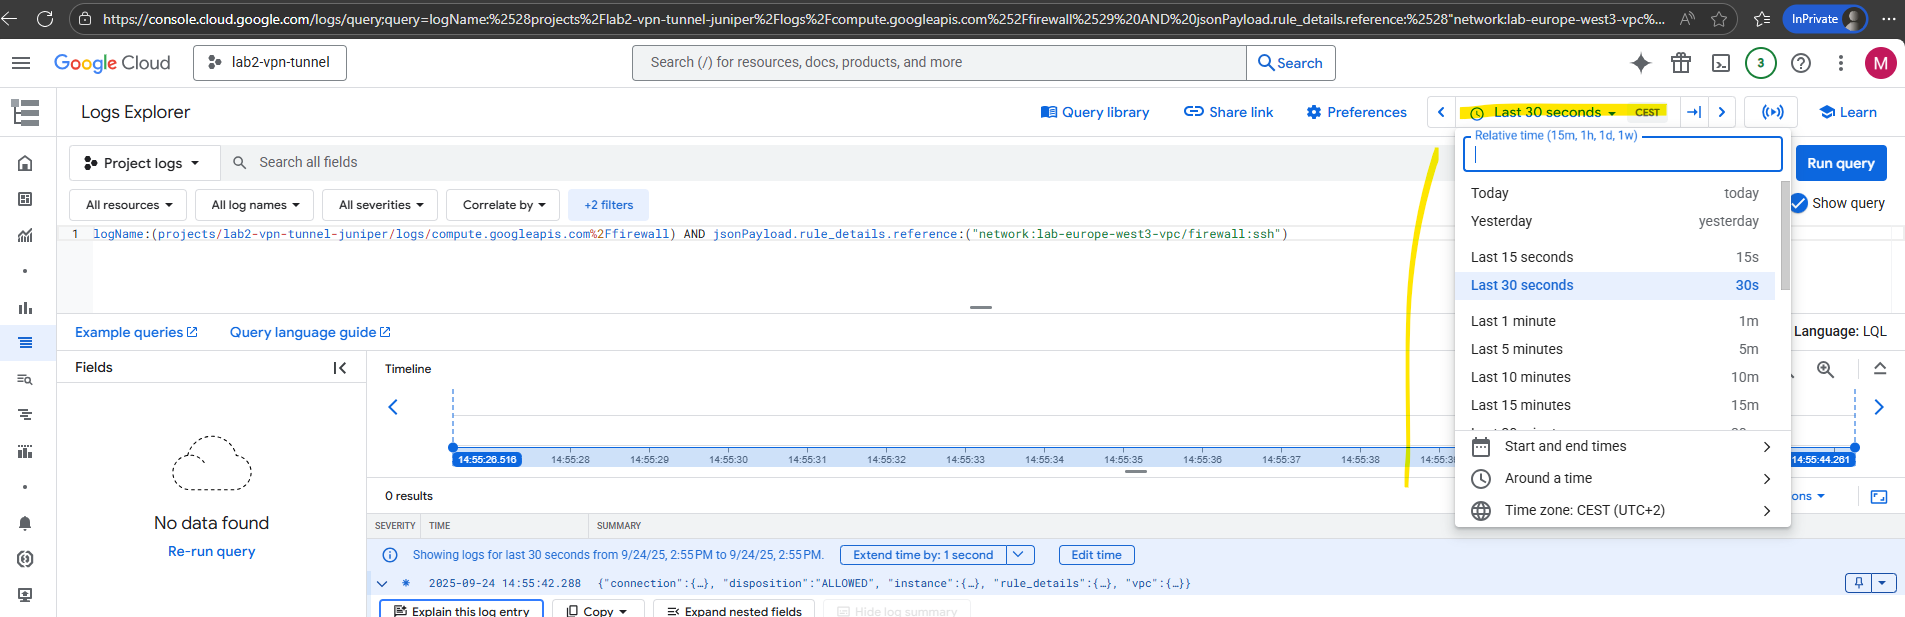
On the Logs Explorer we can set different filter to analyze if specific traffic was allowed or denied.
On of the main filter is to set the timeline where our traffic we want to analyze was happen.
Within the connection key/value pair below we will see the main information we want to check like destination IP, destination port, protocol, source IP and also if traffic was allowed or denied.
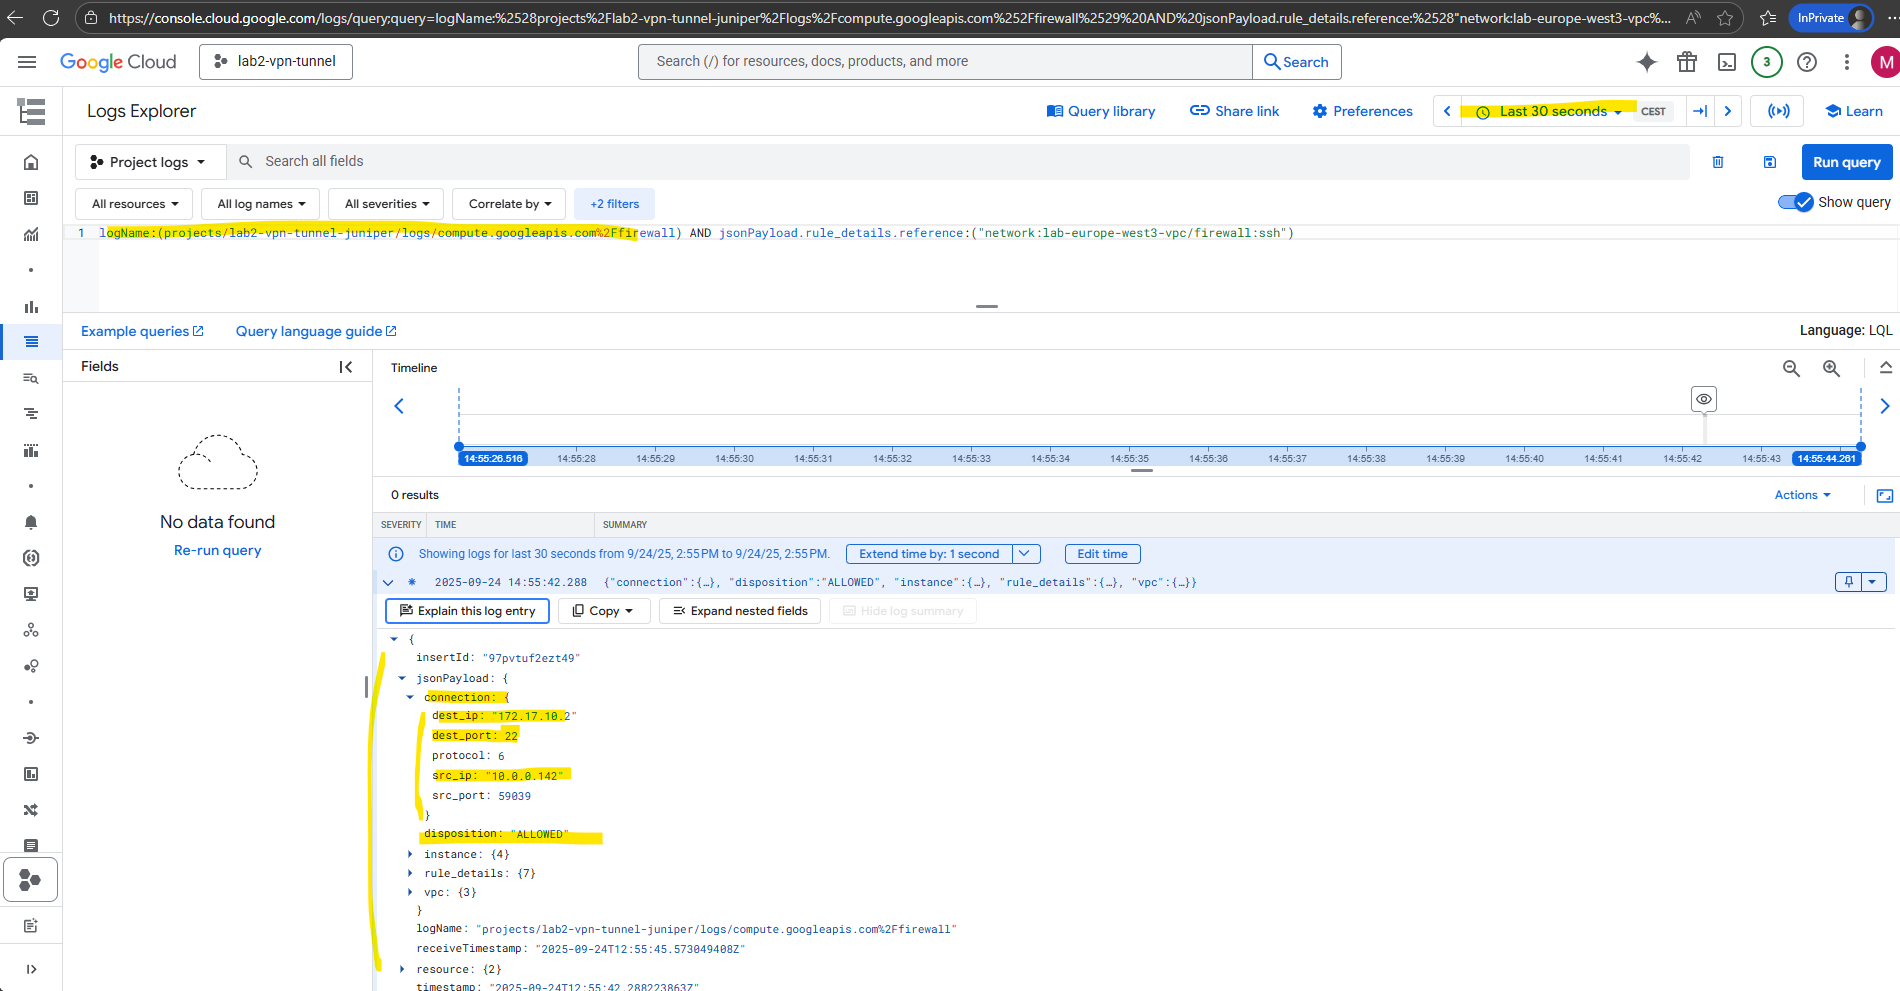
We can also click on the hit count to see all its corresponding logs we want to analyze.
Hit count data from the last six weeks for the rules with Firewall Rules Logging enabled. The hit count number displayed is based on the data collected for the user-visible subnetworks for the duration when Firewall Rules Logging was enabled.
Using Targets (Tags) in Firewall rules
Targets in GCP firewall rules define which VM interfaces the rule is enforced on, either all VMs, VMs with specific tags, or VMs using specific service accounts. This gives you flexible scoping for who the rule applies to.
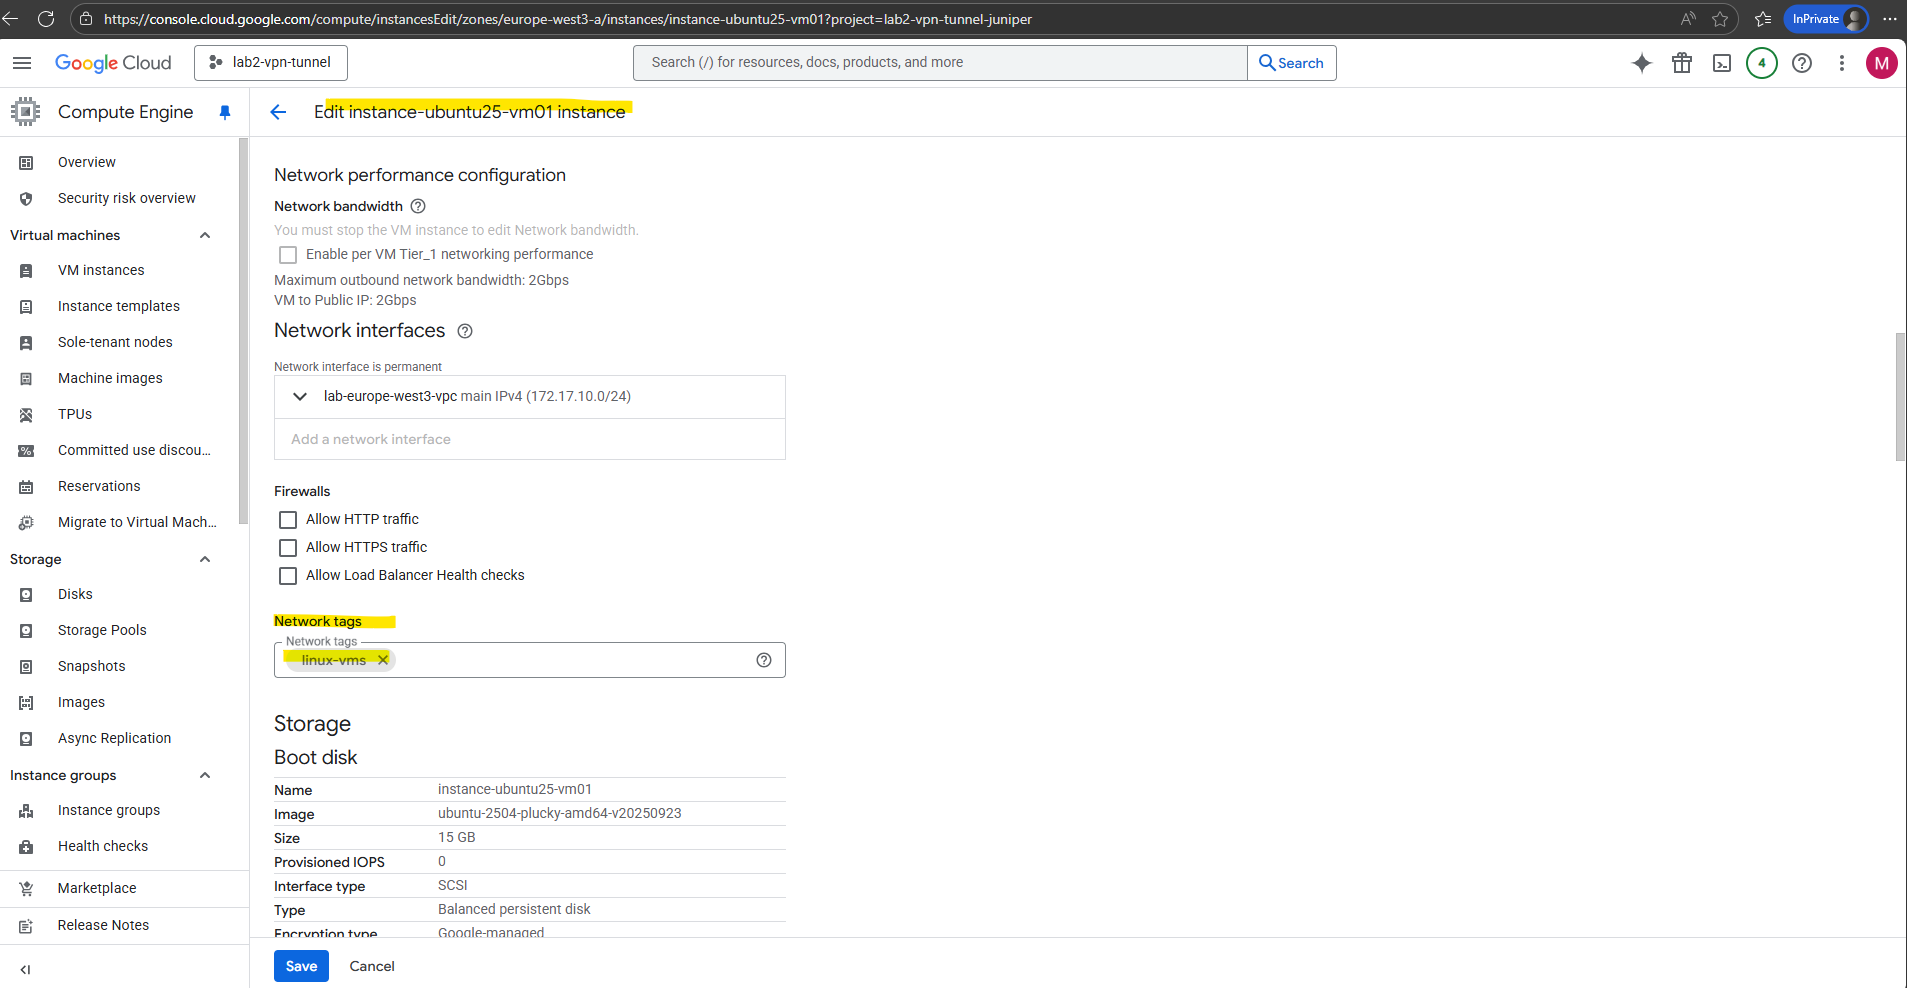
Target tags in Google Cloud firewall rules let you control which VM instances a rule applies to. Instead of applying a rule to every VM in a VPC, you assign a network tag (like linux-vms below) to specific VMs and use that tag as the target in your rule. This makes firewall management more flexible, since you can group VMs by role and update security simply by adding or removing tags.
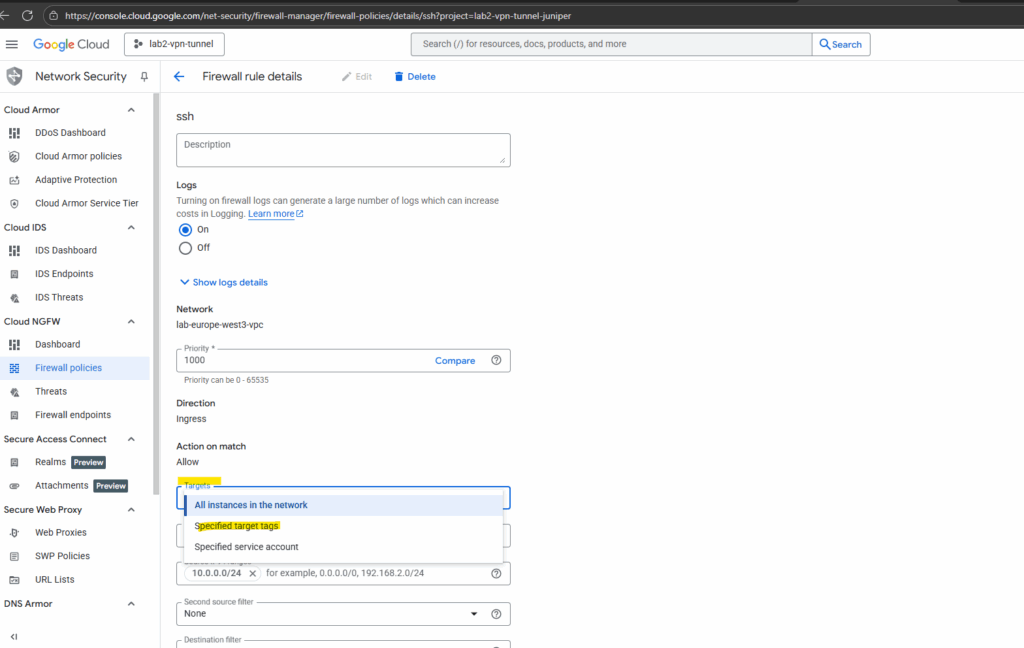
Here I will set for the targets to which this rule will be applied, the network tag named linux-vms.
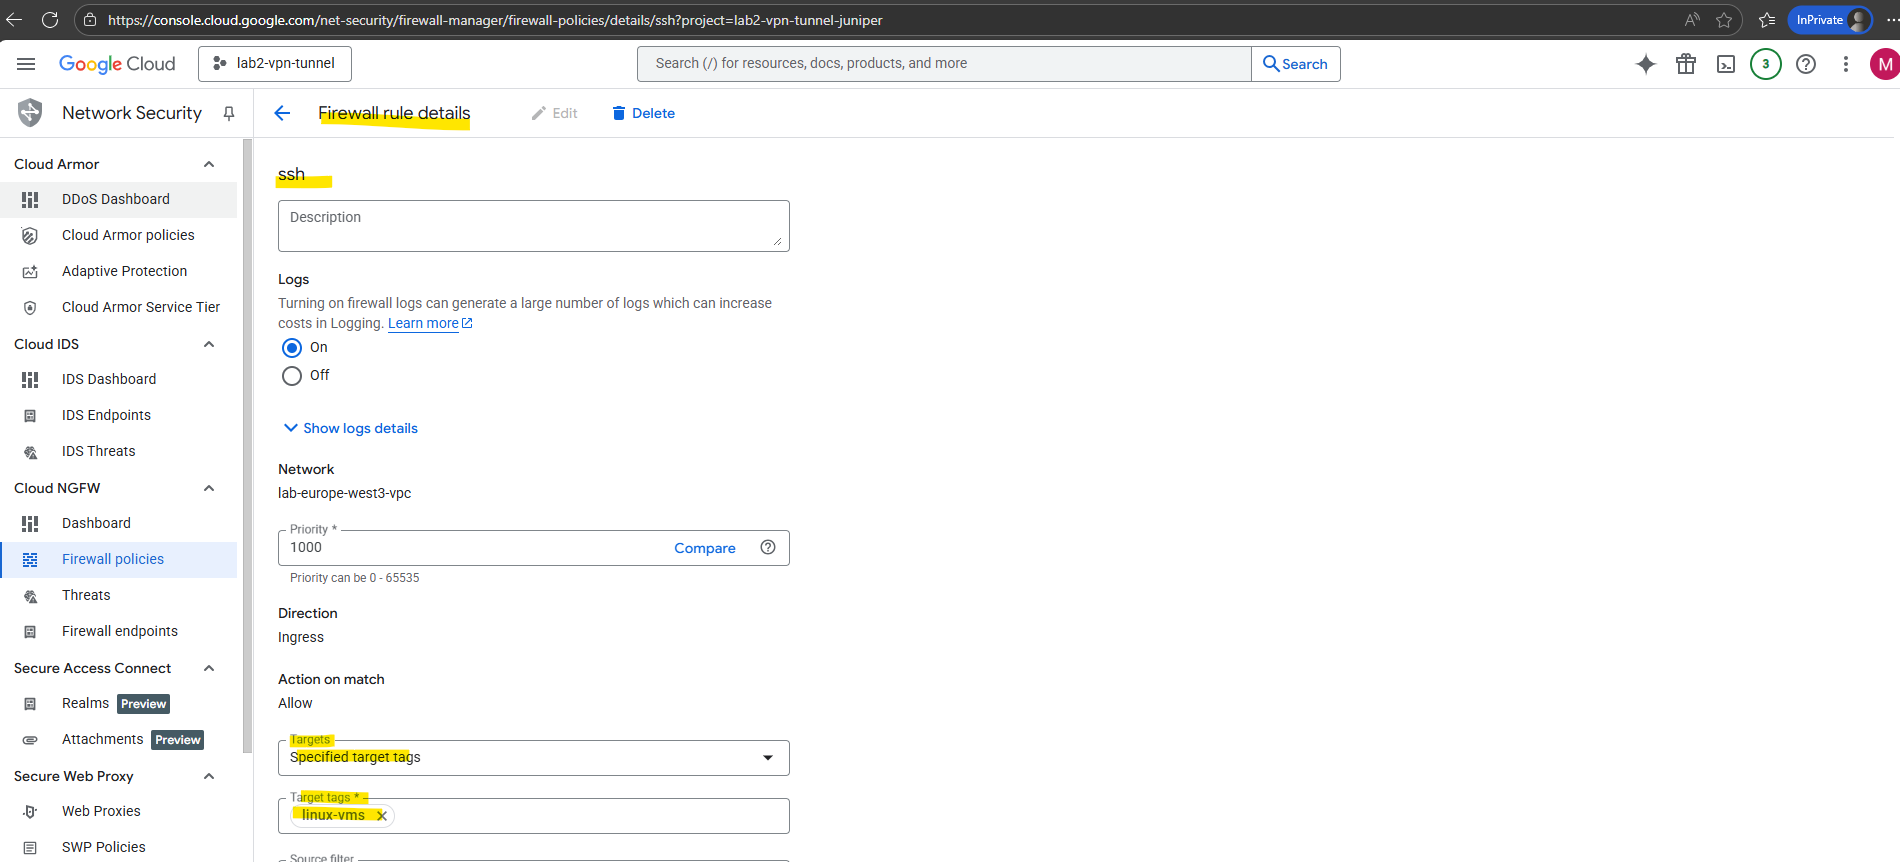
On all virtual machines in this VPC network I want to apply this firewall rule finally, I need to add this network tag as shown below.
VPC Flow Logs
VPC Flow Logs in Google Cloud capture information about network traffic flowing to and from VM instances at the subnet level.
They record details such as source and destination IPs, ports, protocols, byte counts, and whether the traffic was accepted or dropped.
This makes them a powerful tool for monitoring, troubleshooting connectivity issues, analyzing performance, and strengthening security visibility across your VPC.
VPC Flow Logs are like Azure’s NSG Flow Logs, they record network connection metadata for traffic going through a subnet.
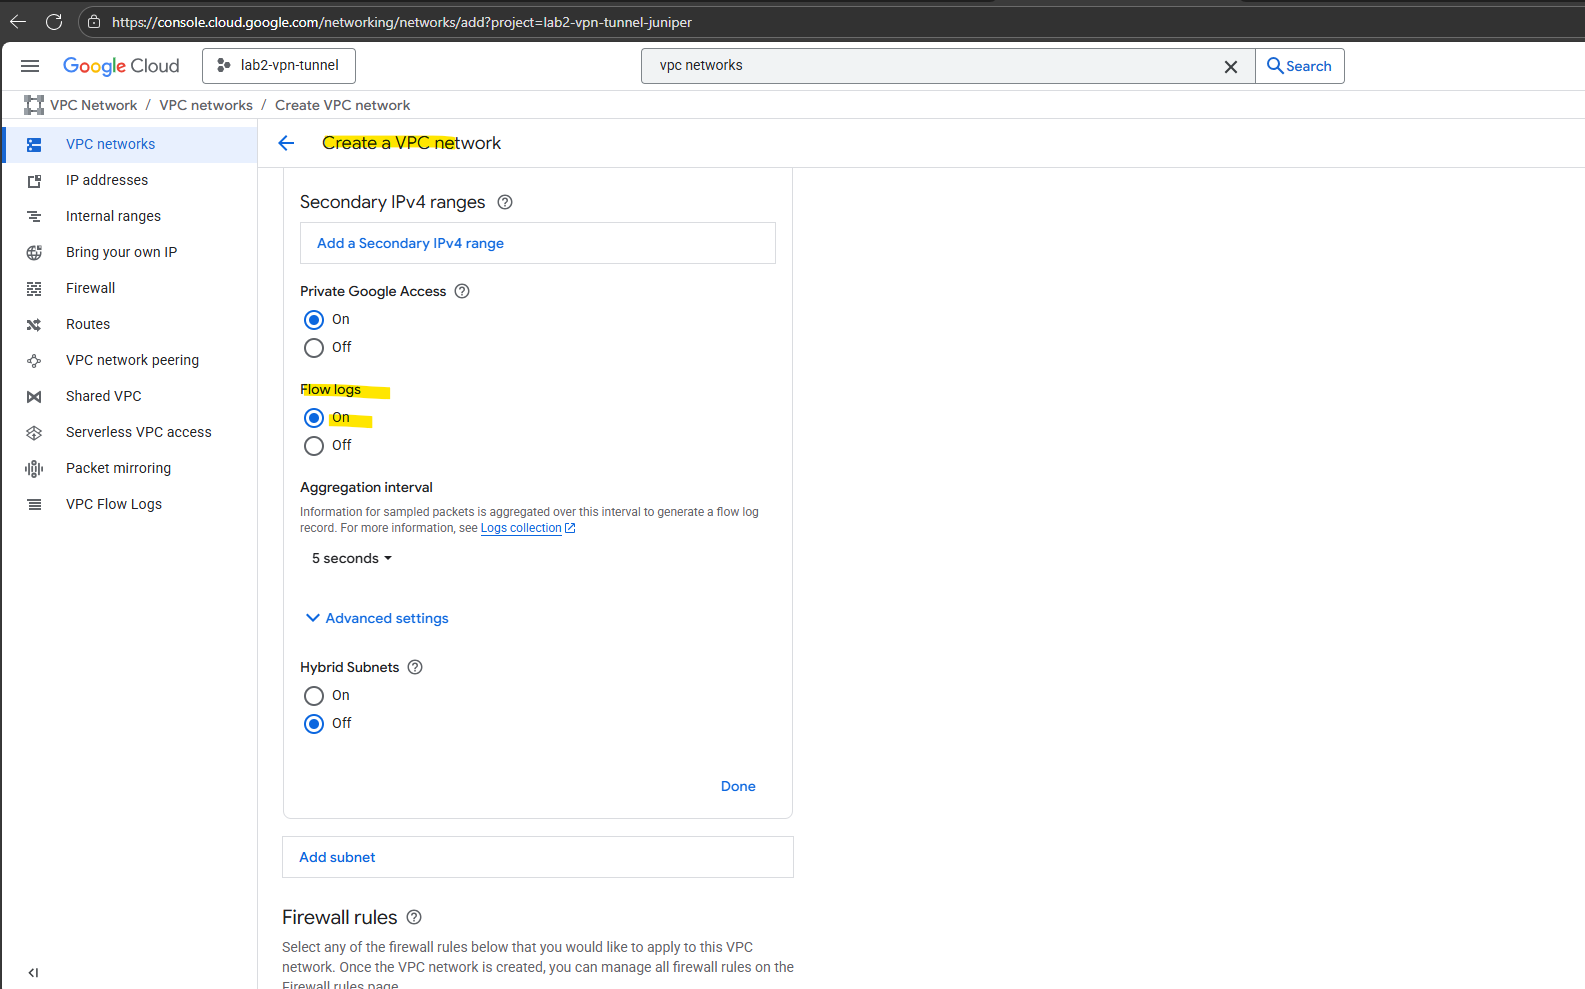
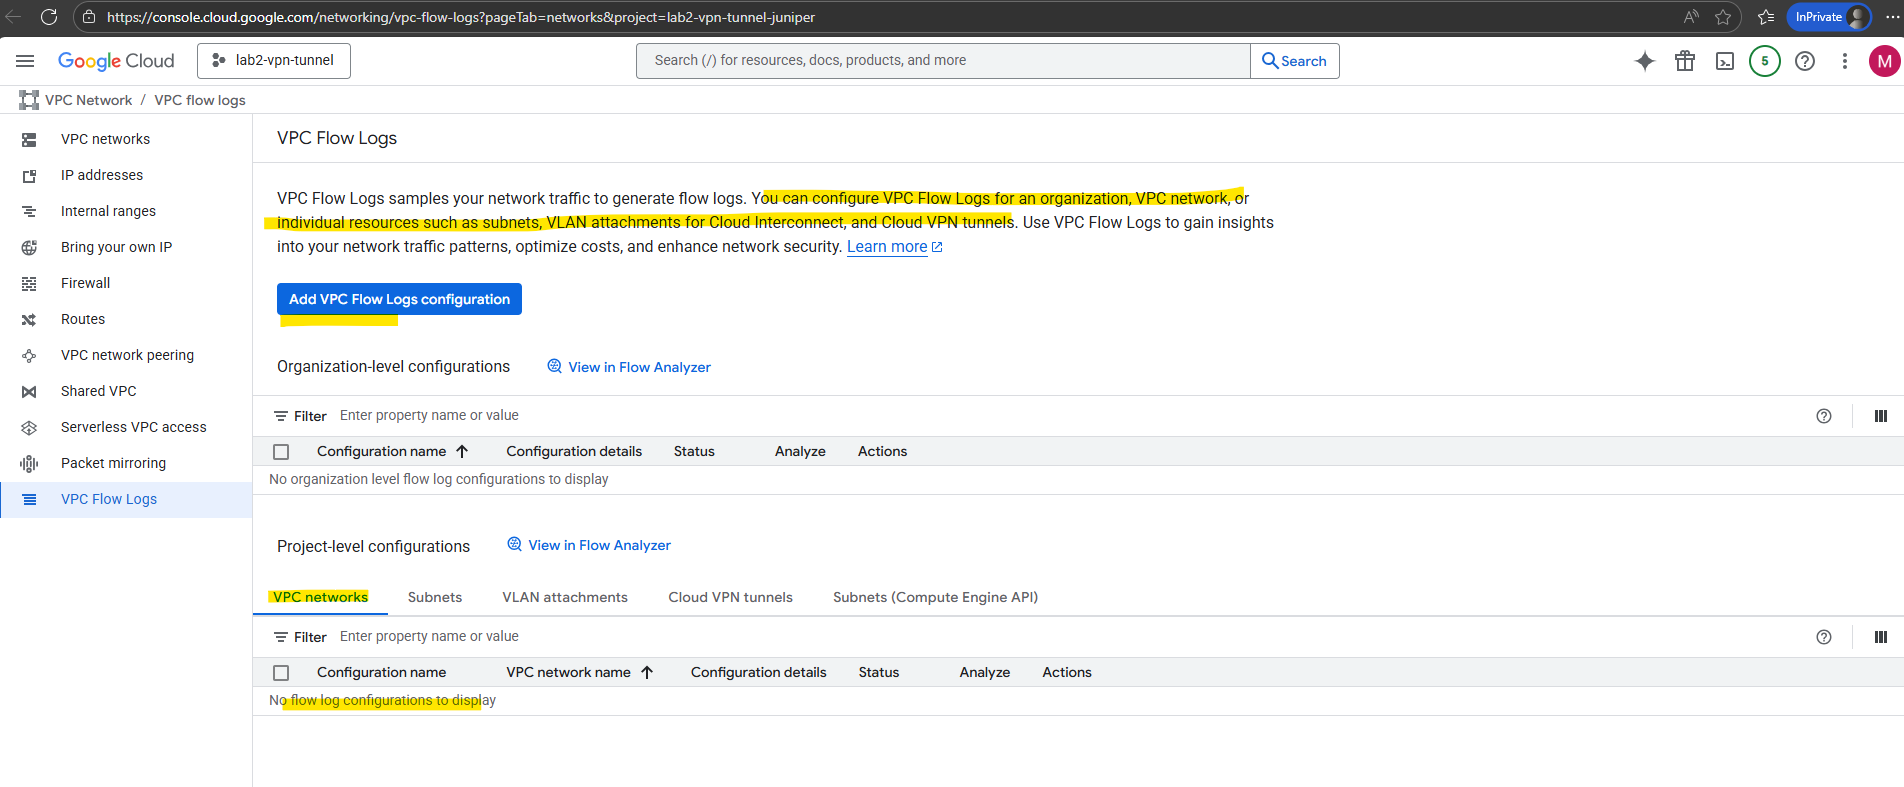
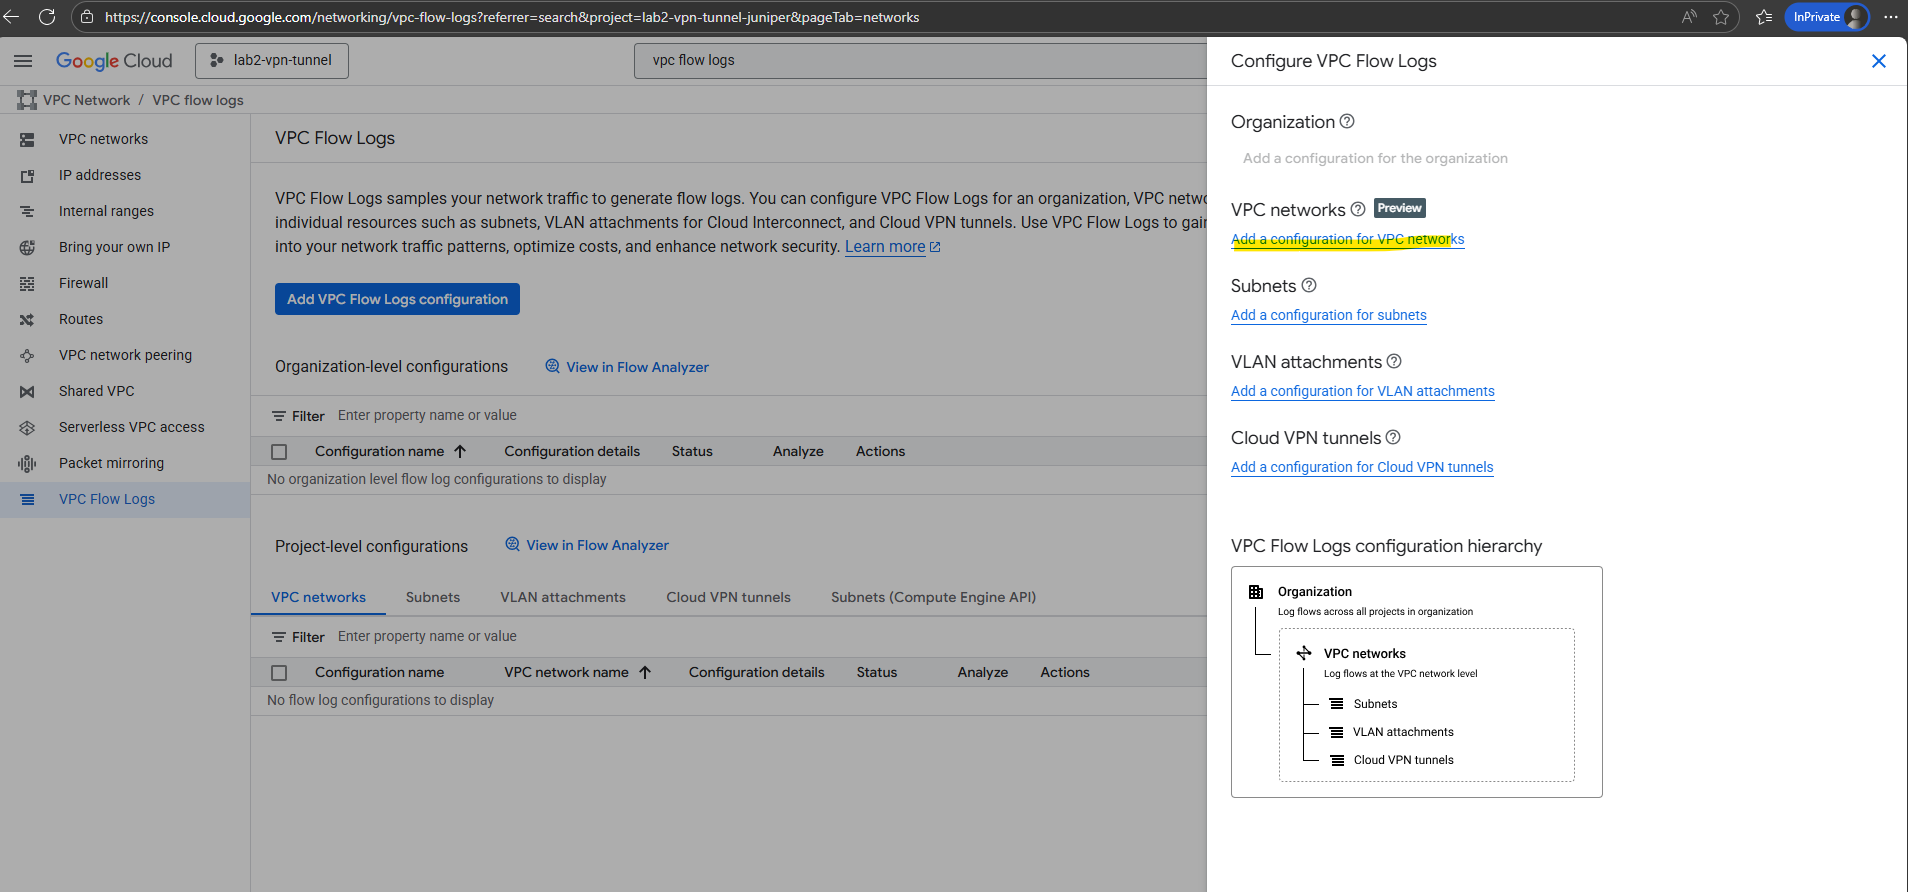
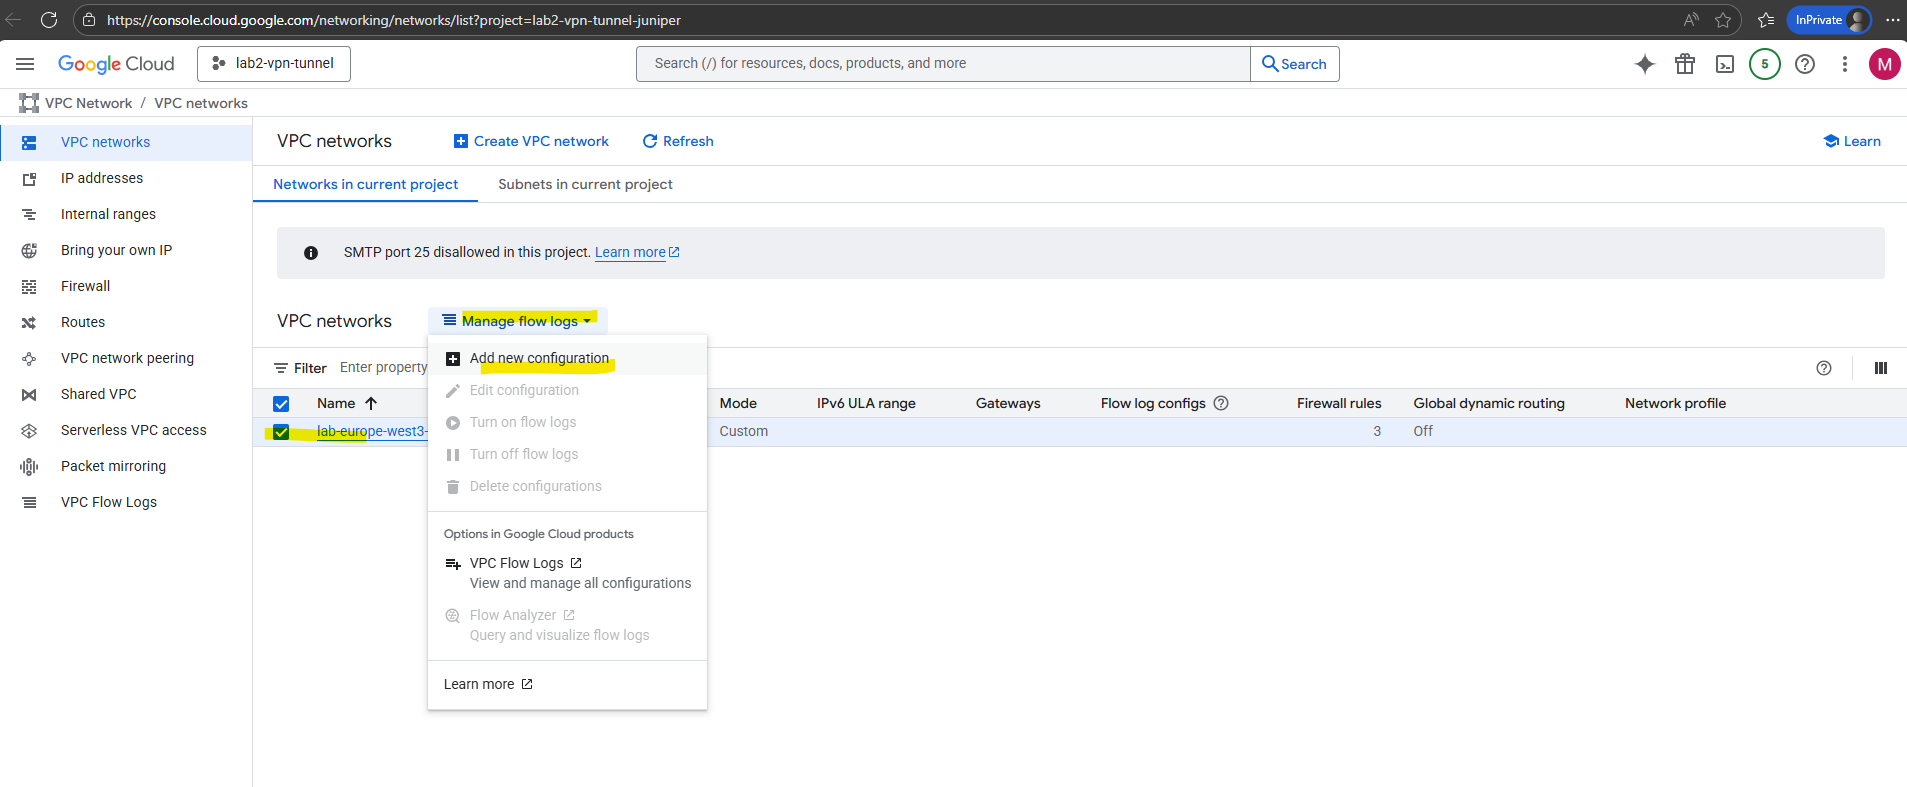
Select the desired VPC network and click on Manage flow logs -> Add new configuration.
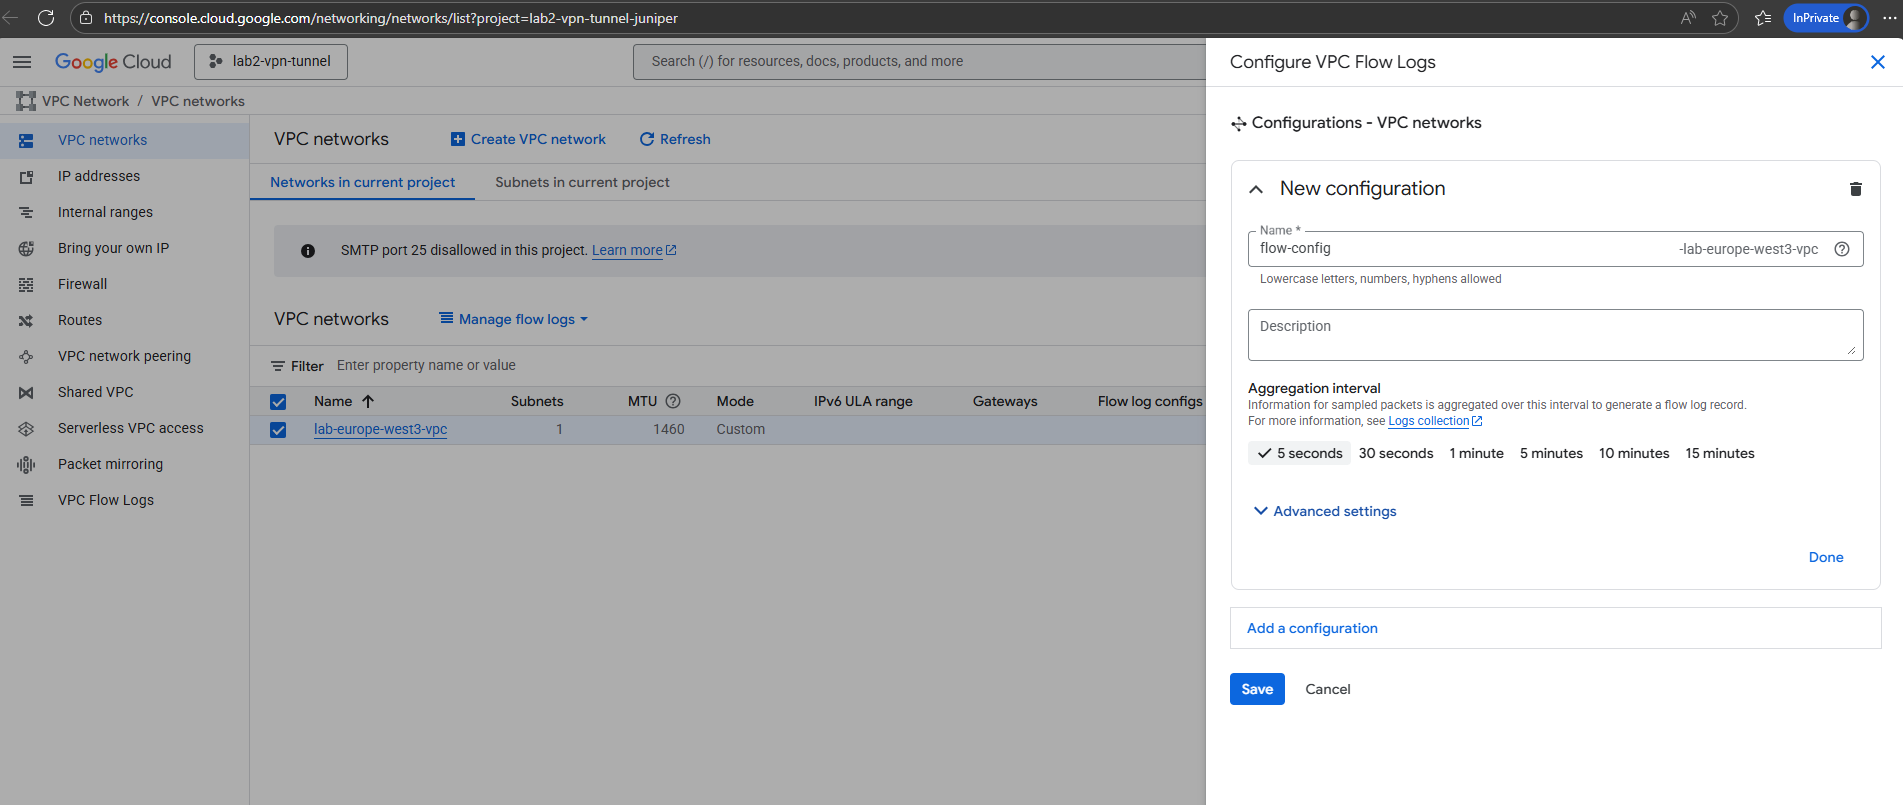
Click on Add a configuration.
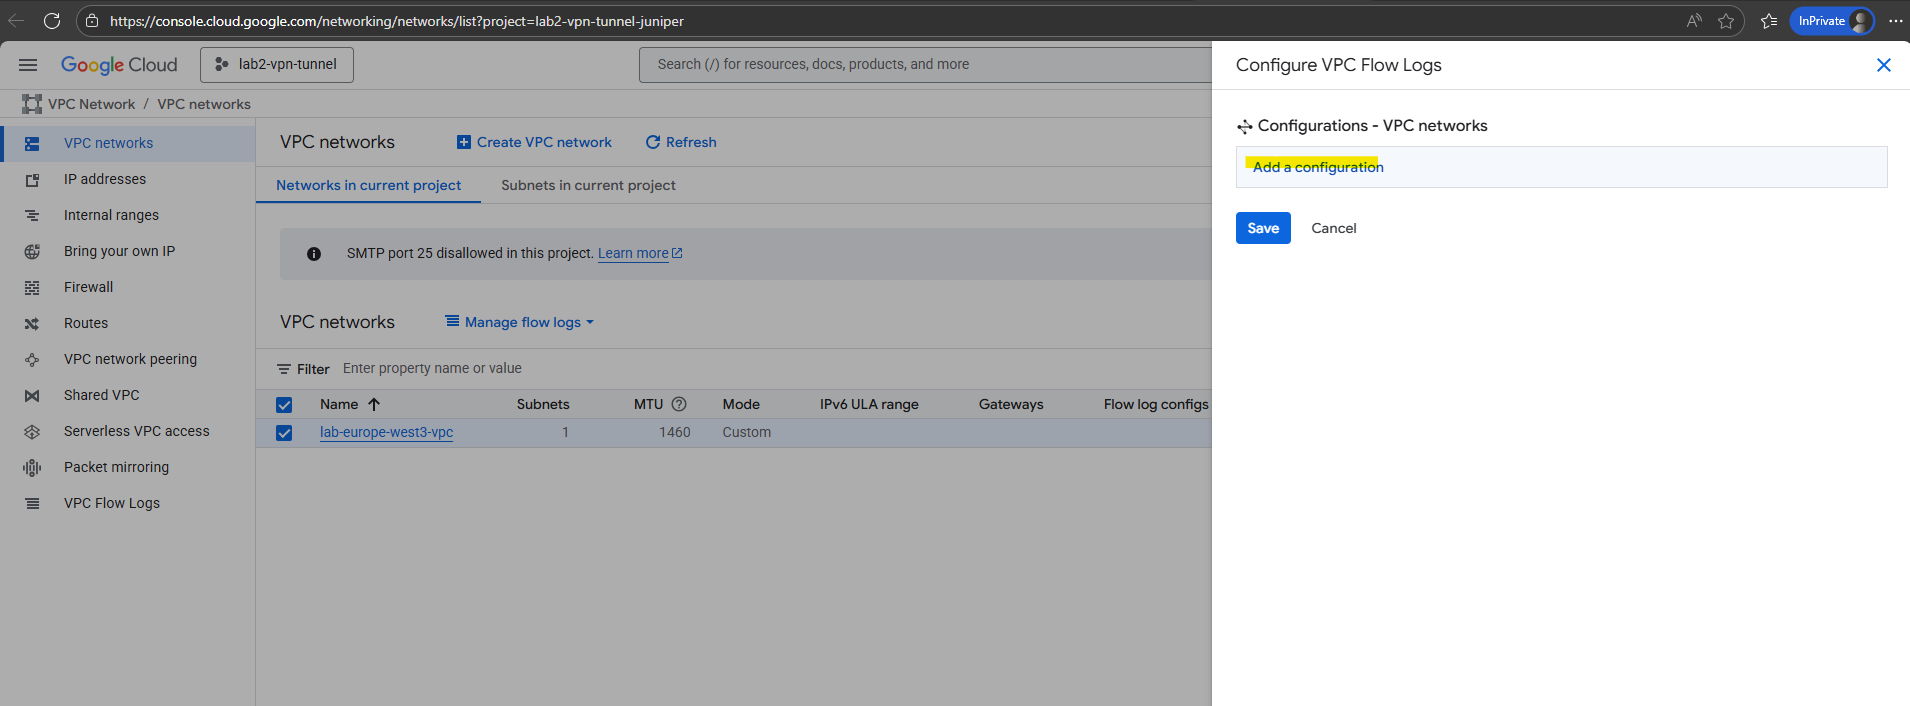
Enter a name, select the aggregation level and click on Save.
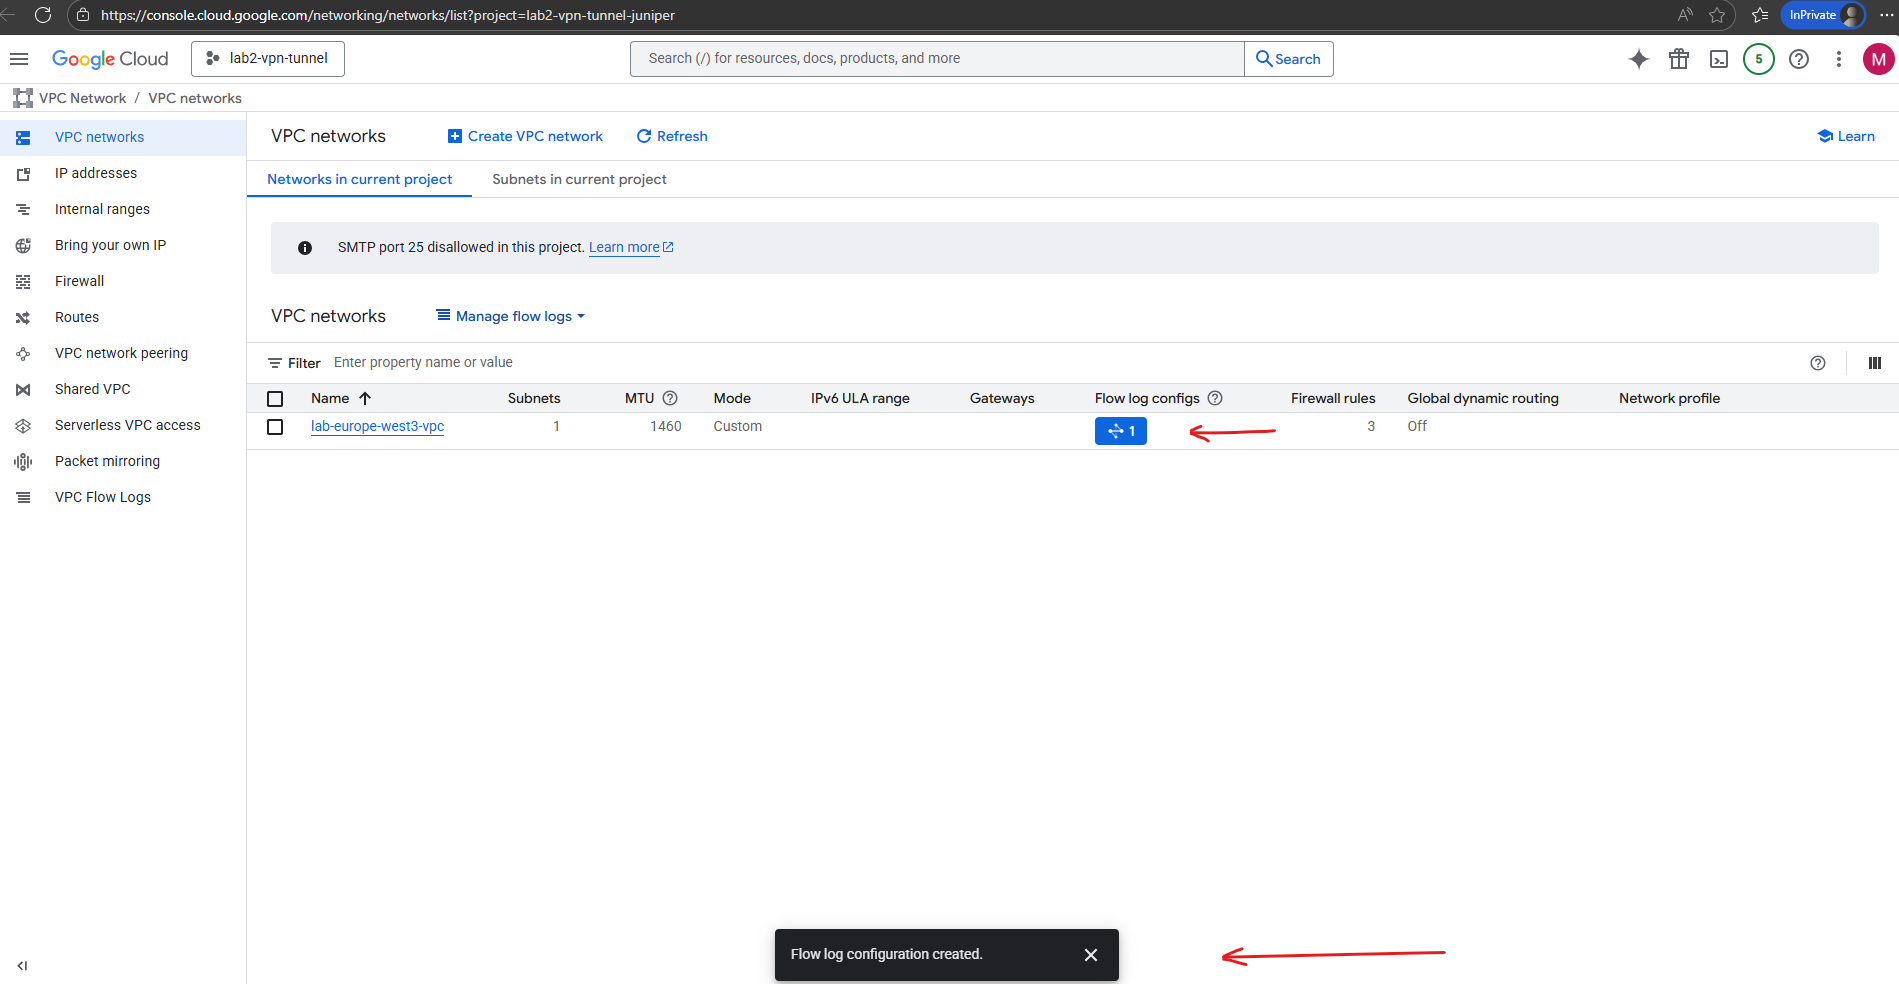
The configuration we can change anytime by clicking on the icon below.
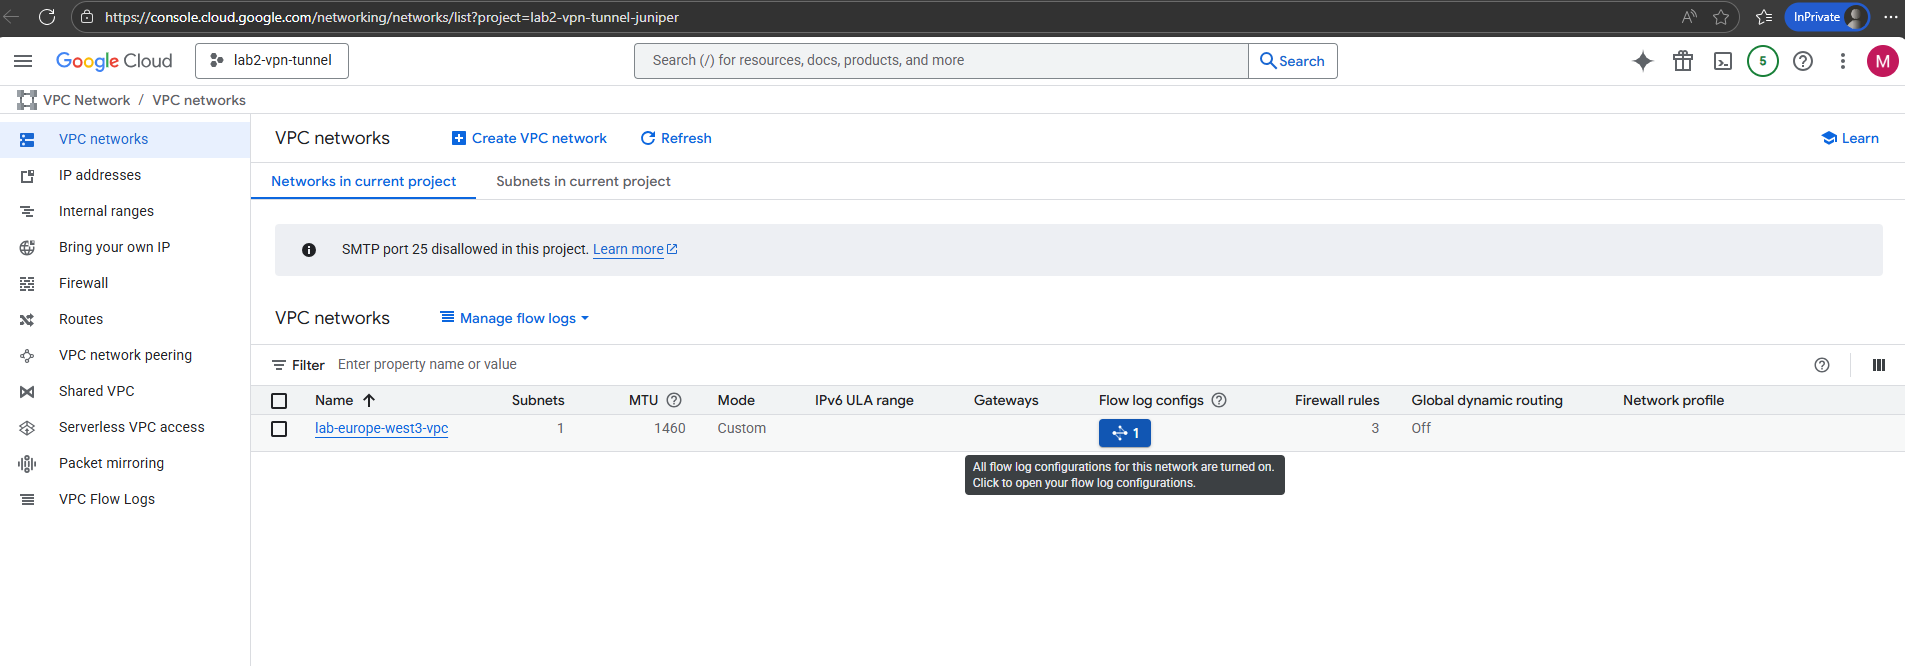
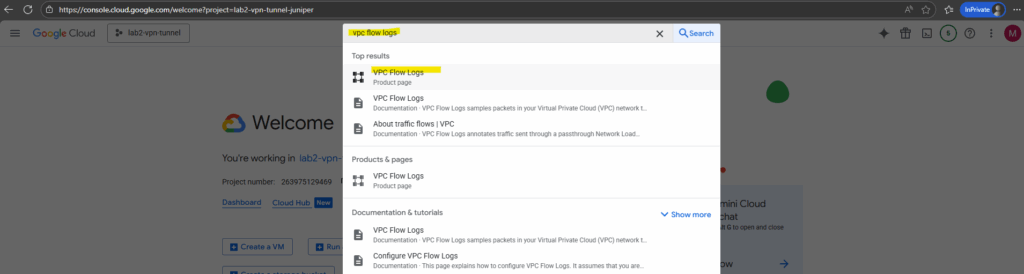
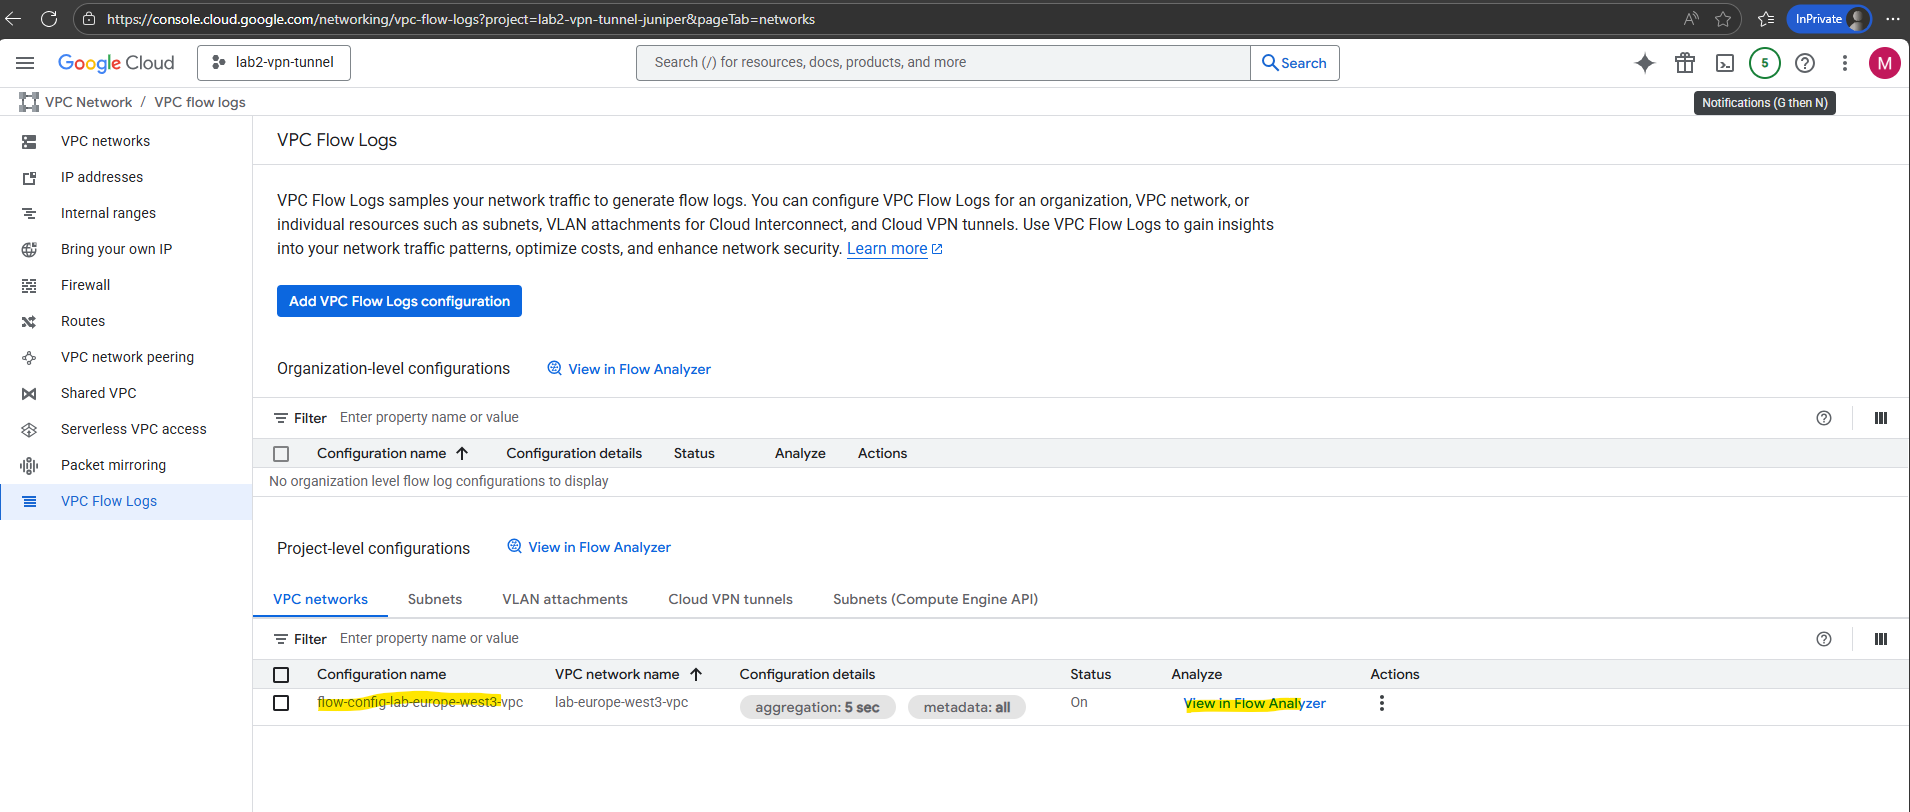
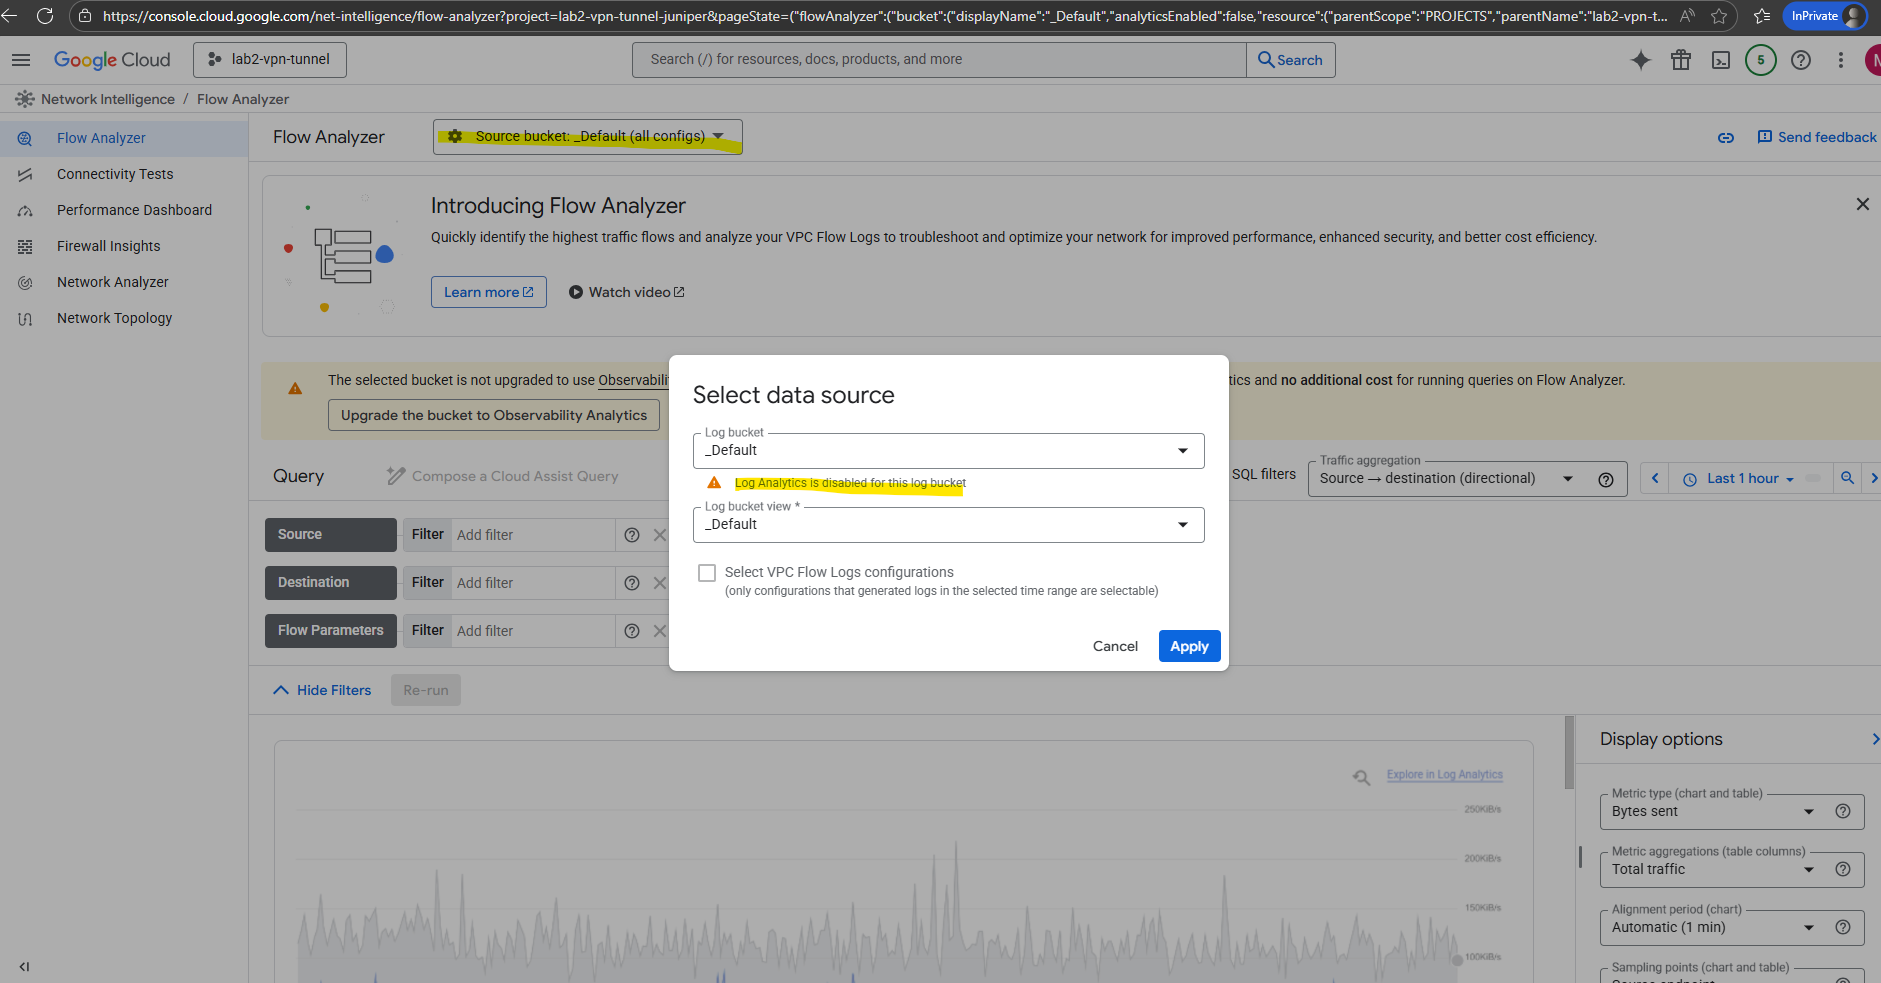
Within the VPC Flow Logs we will now see our new configuration. To analyze the flow logs click on View in Flow Analyzer below.
To finally use the flow analyzer we first need to enable log analytics.
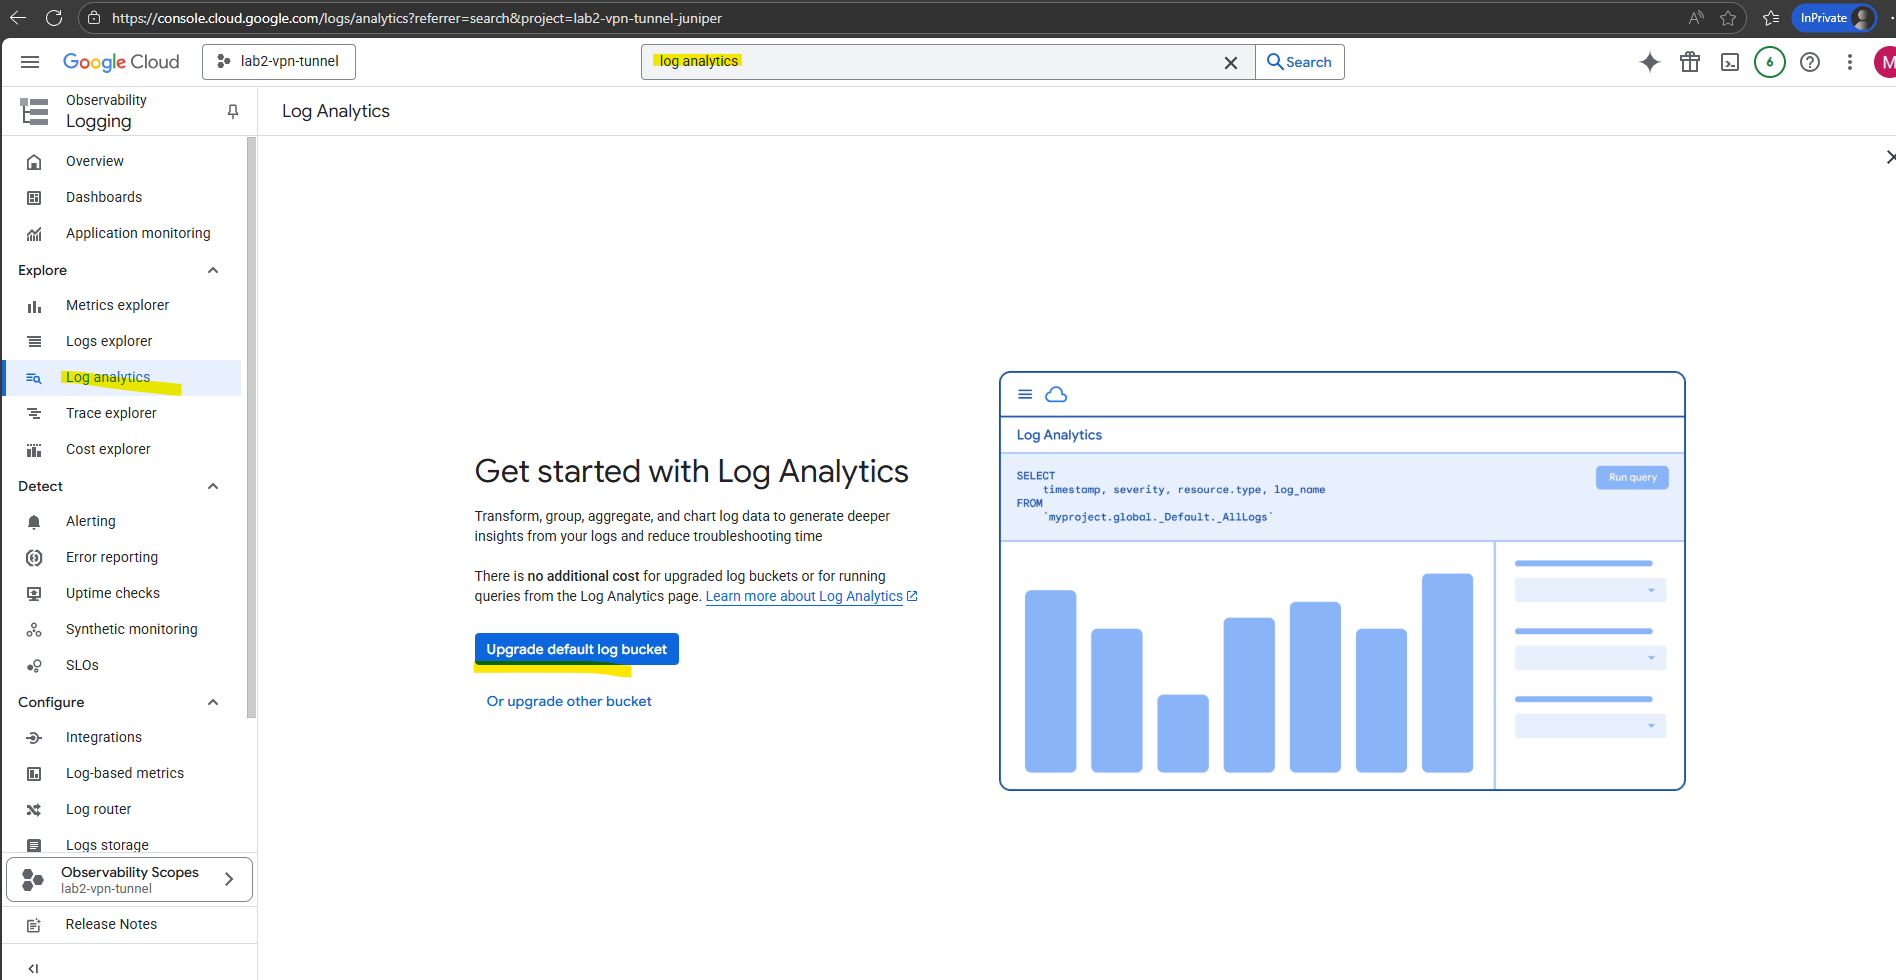
To enable log analytics for the desired bucket, search for log analytics and click below on Upgrade either the default bucket or some other.
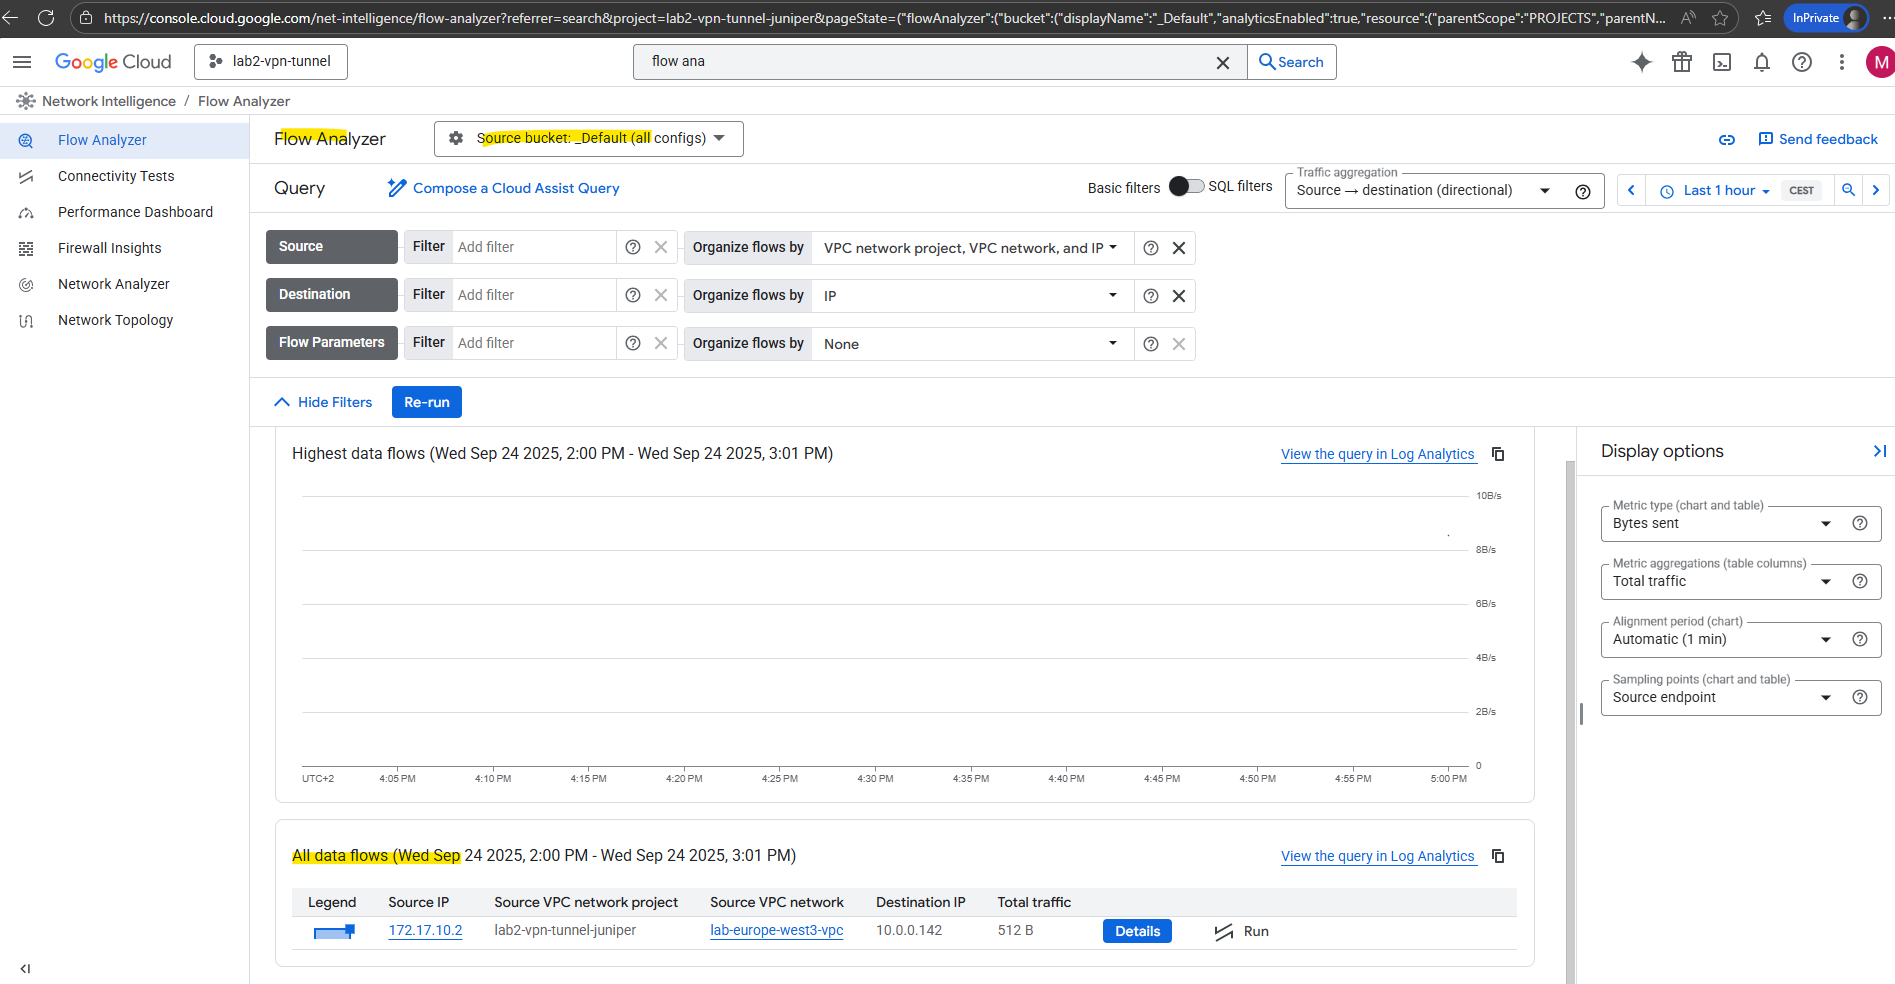
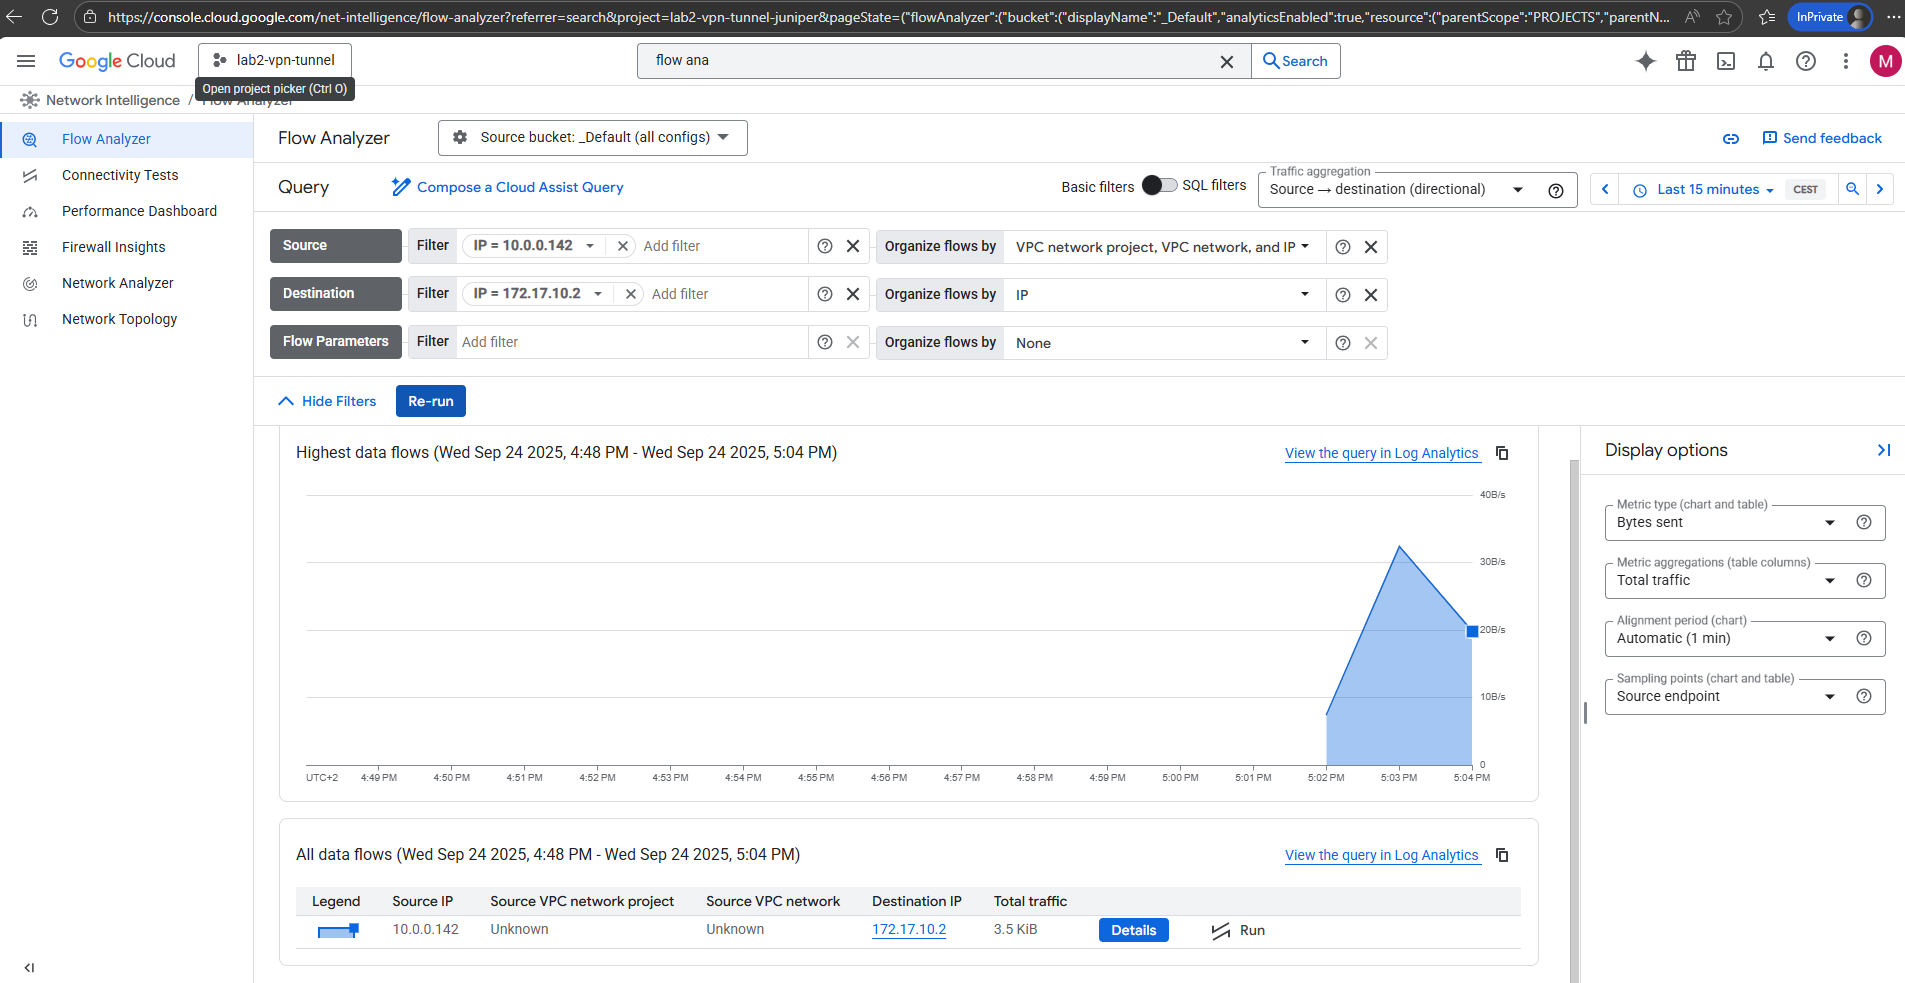
Now we can finally use the flow analyzer.
Links
Cloud Next Generation Firewall pricing
https://cloud.google.com/firewall/pricing#cloud-next-generation-firewall-pricingUse Firewall Rules Logging
https://cloud.google.com/firewall/docs/using-firewall-rules-loggingNetwork Intelligence Center
https://cloud.google.com/network-intelligence-centerFirewall Rules Logging
https://cloud.google.com/firewall/docs/firewall-rules-loggingVPC Flow Logs
https://cloud.google.com/vpc/docs/flow-logsVPC Flow Logs – Unlock traffic visibility across your network
https://www.youtube.com/watch?v=5r_FqspEI8gGoogle Cloud Observability pricing
https://cloud.google.com/stackdriver/pricingEnable Log Analytics
https://cloud.google.com/network-intelligence-center/docs/flow-analyzer/enable-log-analyticsQuery and view log entries
https://cloud.google.com/logging/docs/log-analytics