Analyzing VMware Storage Performance: From Latency to IOPS
In virtualized environments, storage is often the hidden bottleneck behind sluggish VM performance.
While CPU and memory are easy to observe, disk latency, throughput, and IOPS require a deeper dive to diagnose correctly.
Whether you’re running workloads on vSAN, Fibre Channel, iSCSI, or traditional local storage, understanding how to interpret VMware’s performance metrics is essential for maintaining responsiveness and stability.
In this post we will see the key storage performance counters in vSphere, including virtual disk, datastore and host-level metrics.
VM CPU/Memory Analysis
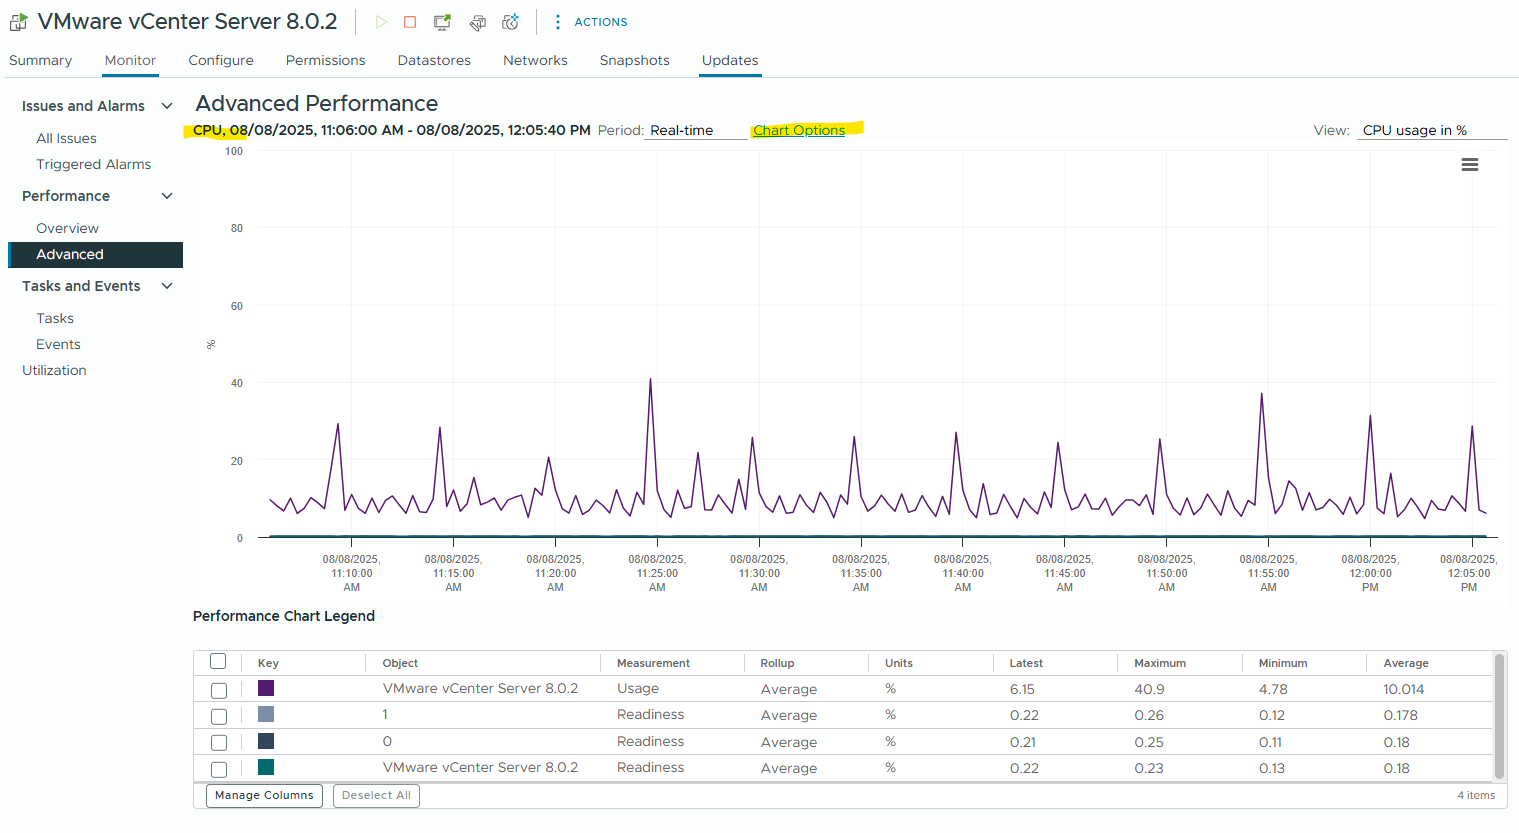
We can check the performance regarding CPU and Memory usage on the VMs Monitor tab in vSphere under Performance -> Overview or better directly Advanced like shown below.
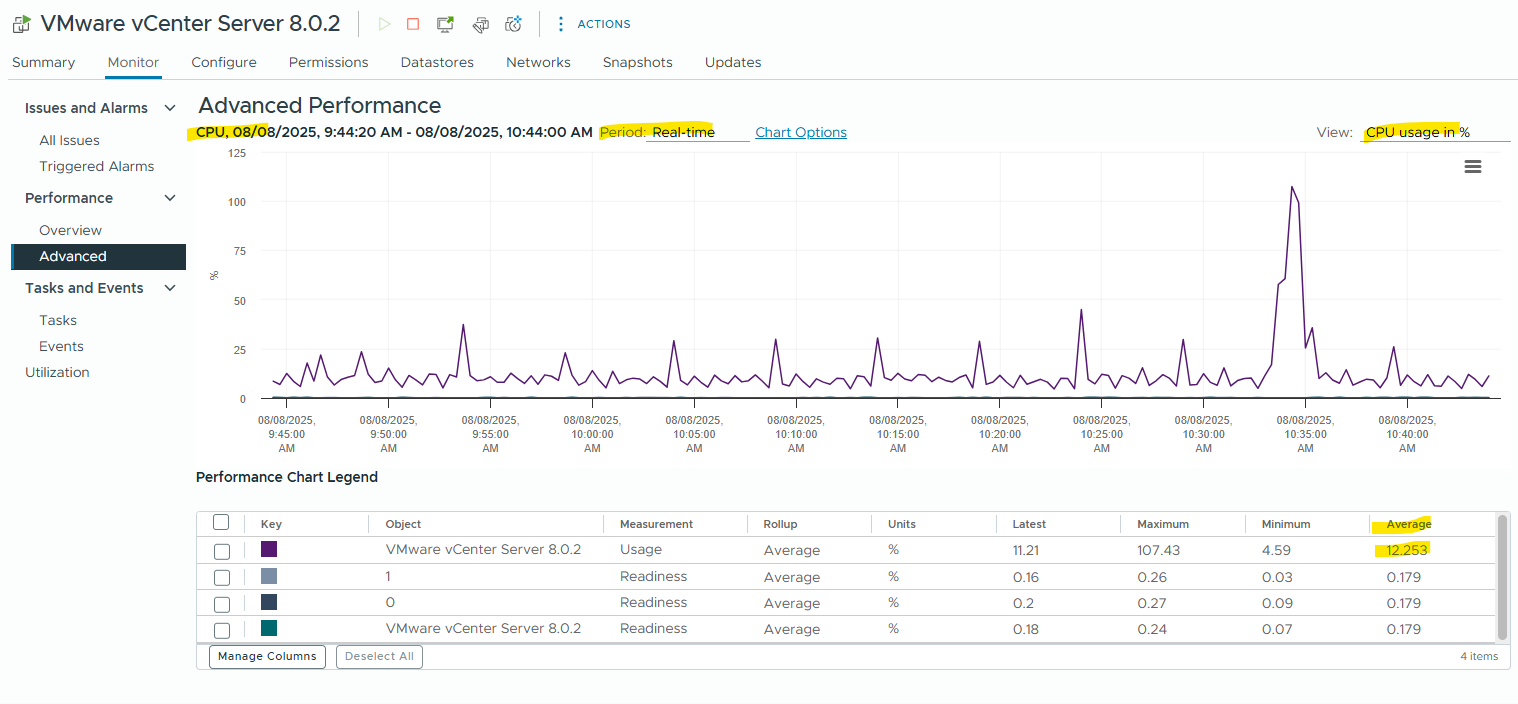
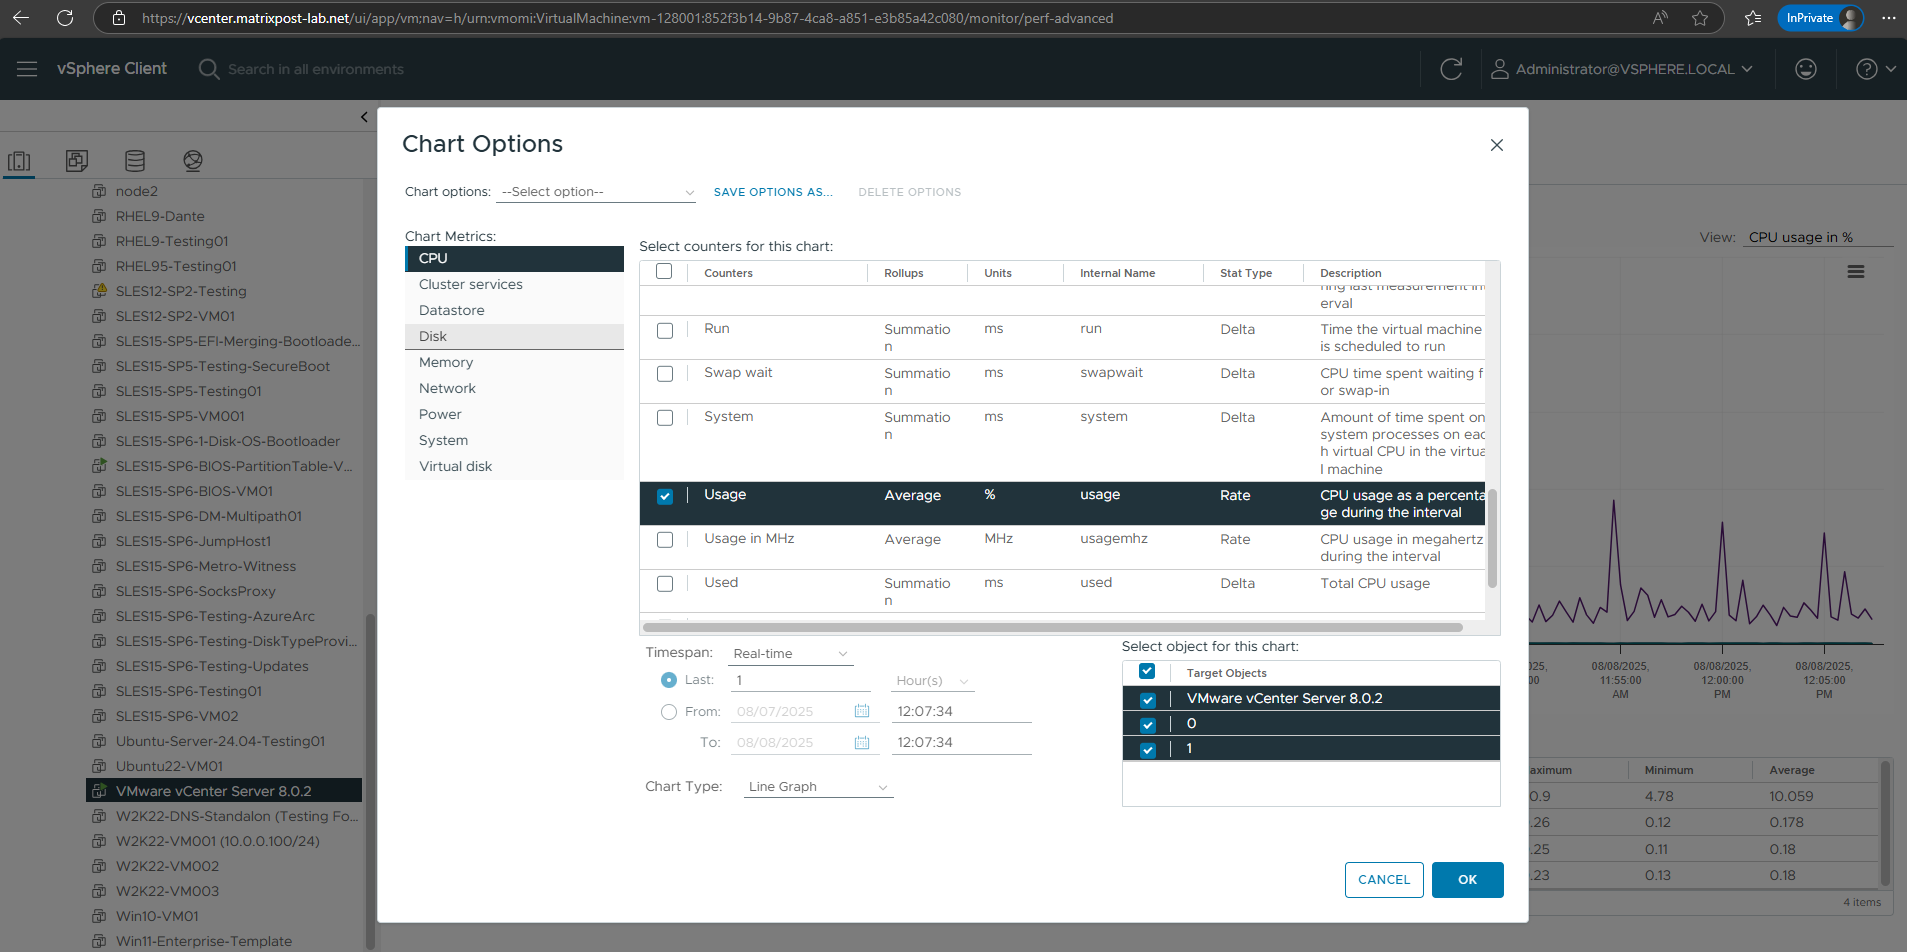
The metrics we want to see for the selected object like here CPU usage, we can define in the Chart Options below. So click on it.
By default Usage and Readiness is selected.
Usage ==> CPU usage as a percentage during the interval.
Readiness ==> Percentage of time that the virtual machine was ready, but could not get scheduled to run on the physical CPU,
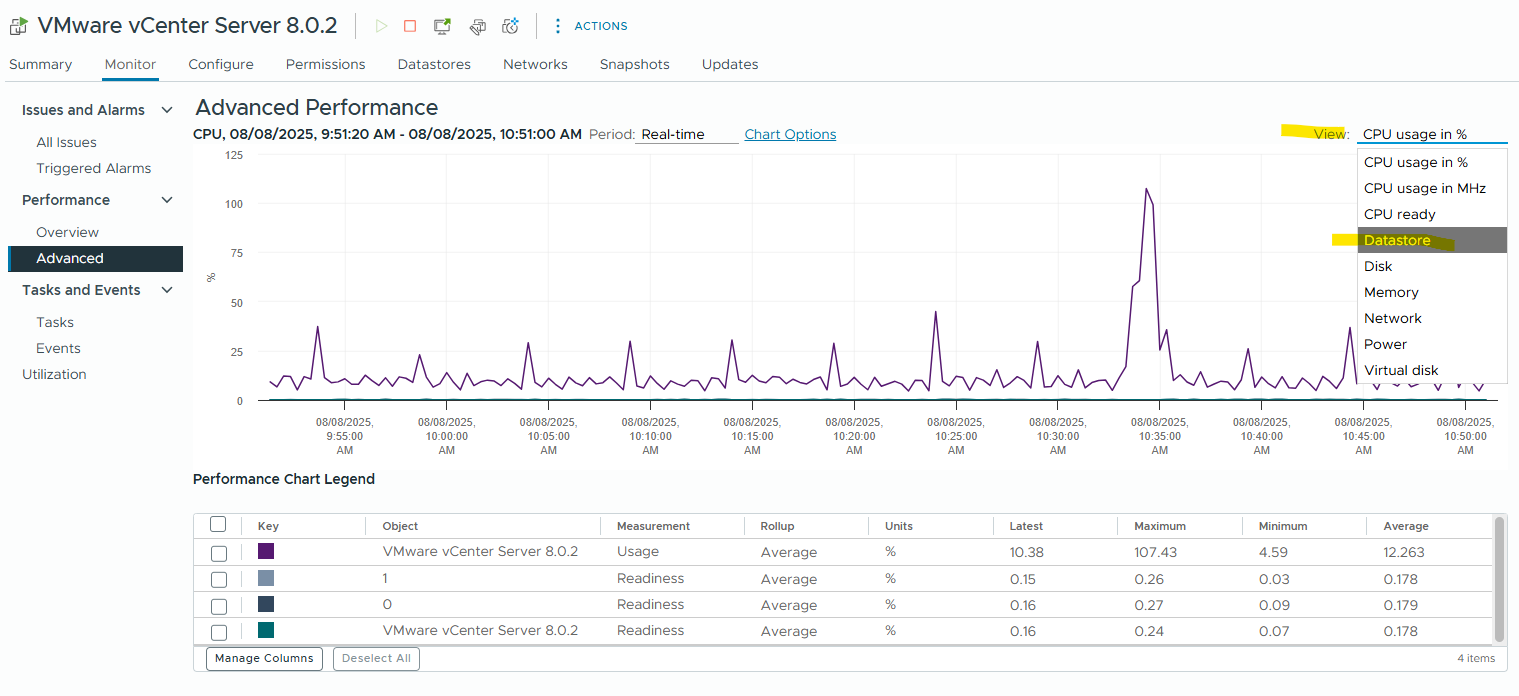
VM Storage I/O Analysis
Same for the storage analysis, just switch below under View to the desired object. I will first analyze the datastore performance the VM is running on.
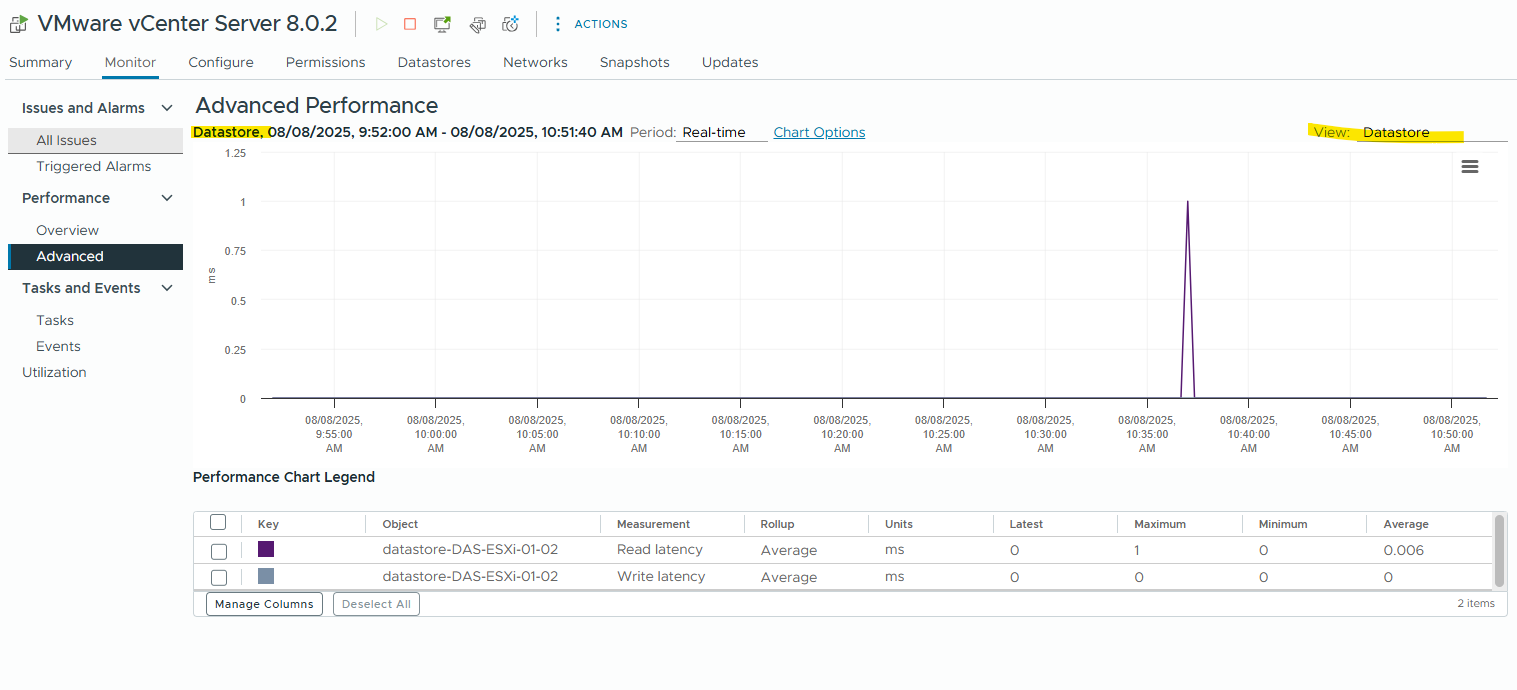
Datastore Analysis
Below we can see the read/write latency for the datastore our VM is using for its disks. The latency is measured in milliseconds (ms).
This metric tells you how long storage takes to respond to I/O operations, and it directly affects VM responsiveness.
Acceptable latency values are:
Read Latency < 5 ms good | 5-20 ms warning | > 20 ms critical
Write Latency < 10 ms good | 10-30 ms warning | > 30 ms criticalThese are general benchmarks for non-vSAN storage (iSCSI, NFS, FC, local SSD/SAS). For flash-based arrays, expect even lower latencies (<1–2 ms).
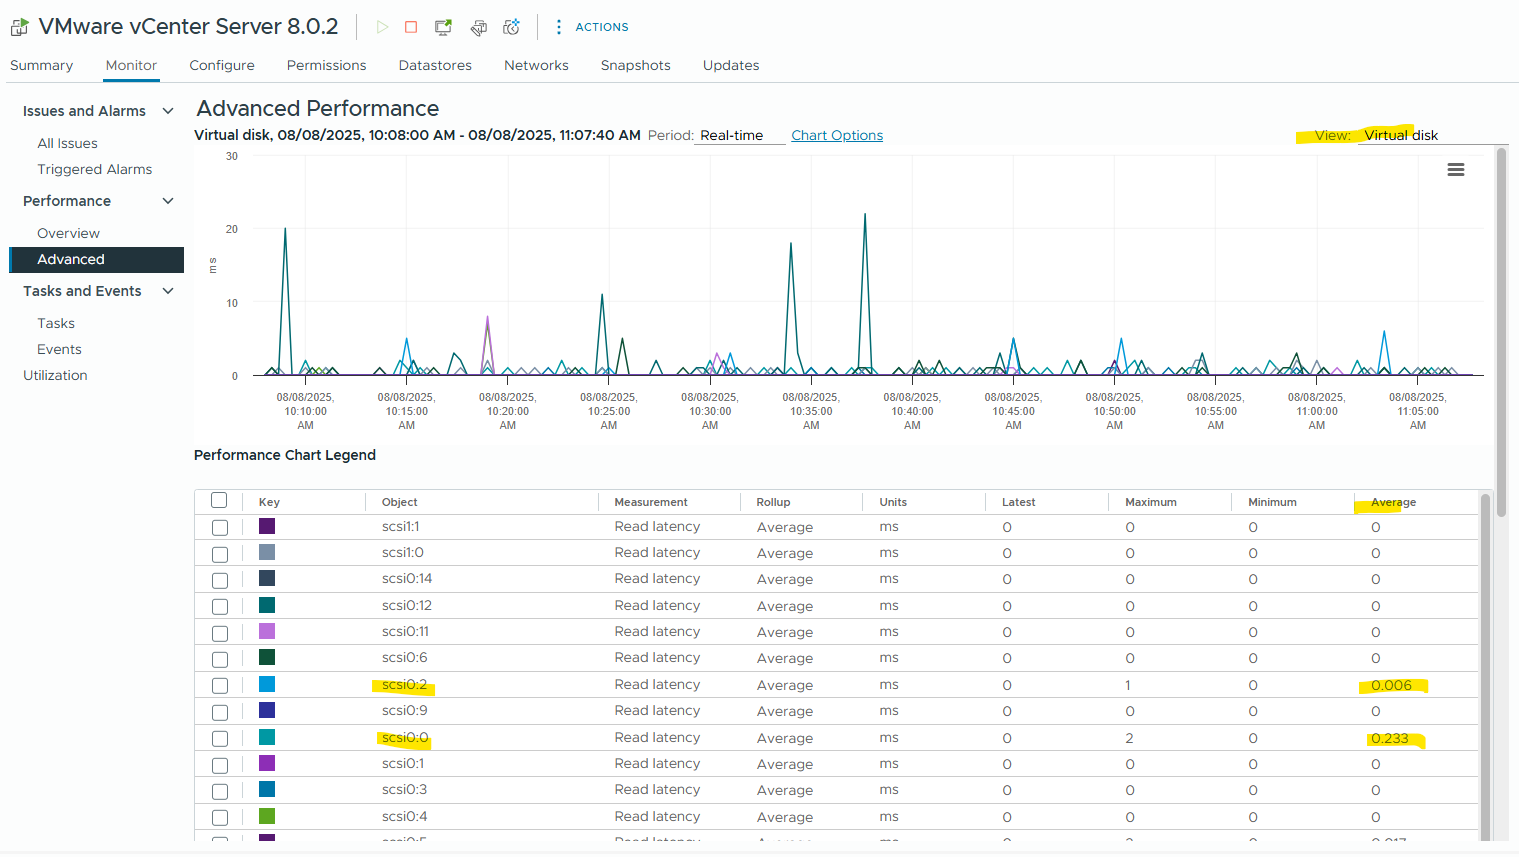
Virtual Disk Analysis
The Virtual Disk latency is slightly different from datastore-level latency, and it gives a per-VM view of how that VM experiences I/O.
It’s essentially the end-to-end I/O delay that the VM sees, and one of the best indicators of storage performance from the VM’s point of view.
This is the latency from the perspective of the virtual machine, measured in milliseconds, and includes:
- Queueing within the VM
- VMkernel handling
- Datastore and storage stack latency
- Storage array response
Acceptable latency values are:
Read < 5 ms good | 5-20 ms warning | > 20 ms critical
Write < 10 ms good | 10-30 ms warning | > 30 ms criticalThese thresholds are the same as datastore latency, because high virtual disk latency is often caused by high datastore or storage path latency.
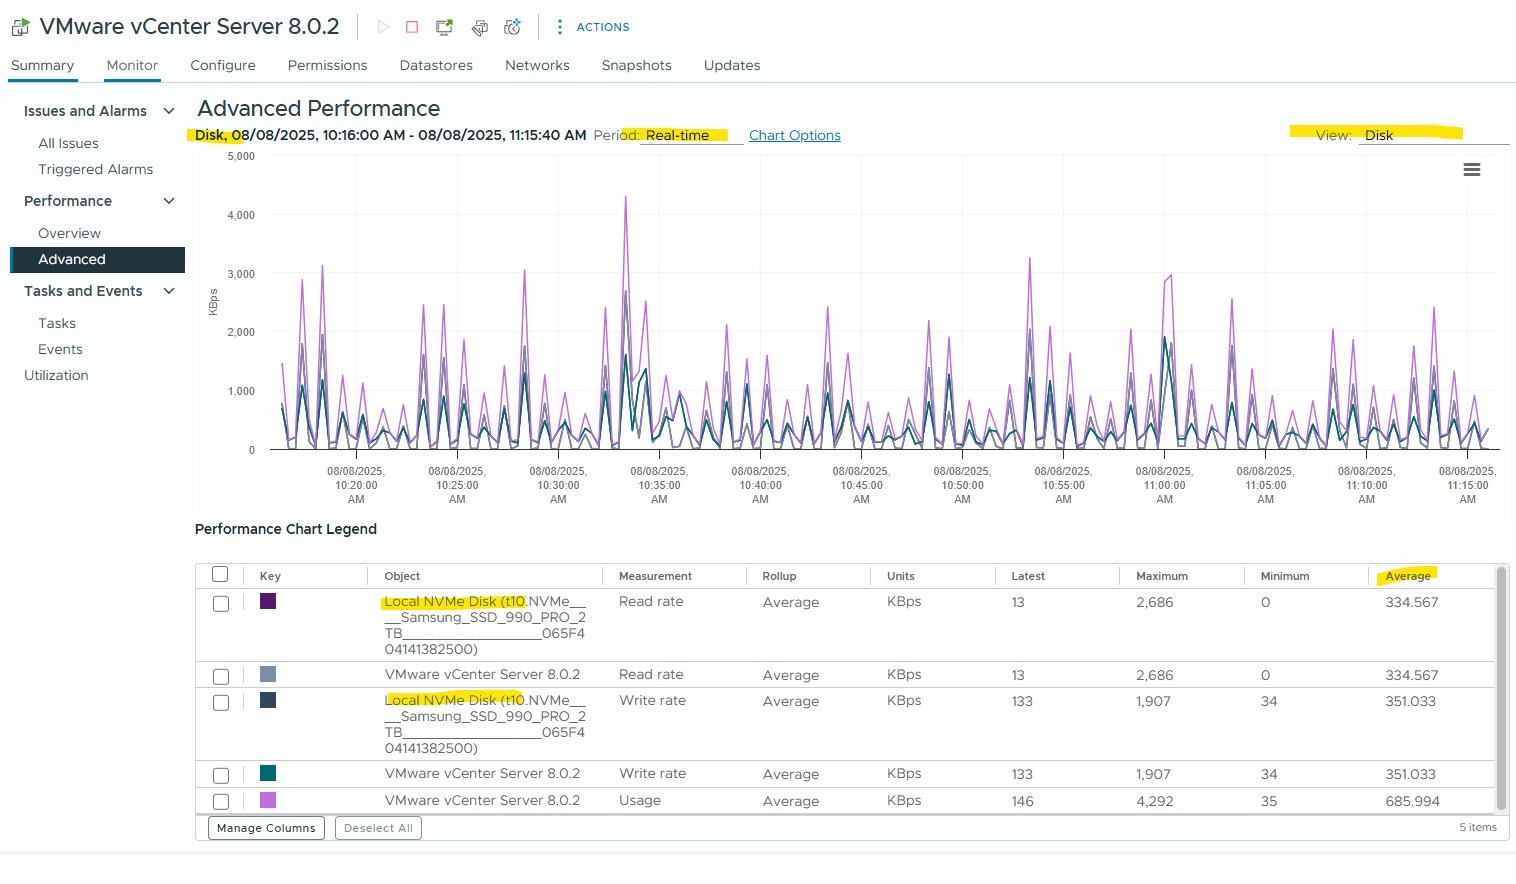
Disk Analysis
The Disk is our ESXi host’s physical storage layer (used primarily for local disks or pass-through devices)
Disks does not include SAN storage over Fibre Channel (FC), iSCSI targets, NFS datastores or vSAN disk groups. It includes just physical storage devices directly attached to the ESXi host.
About how to analyze SAN storage you will find in the next section below.
Acceptable rate values are: (throughput usage is relative to your disk type)
~100 MBps max (100,000 kBps) for HDD, ~300–550 MBps for SATA SSD and 1,000+ MBps for NVMe SSD
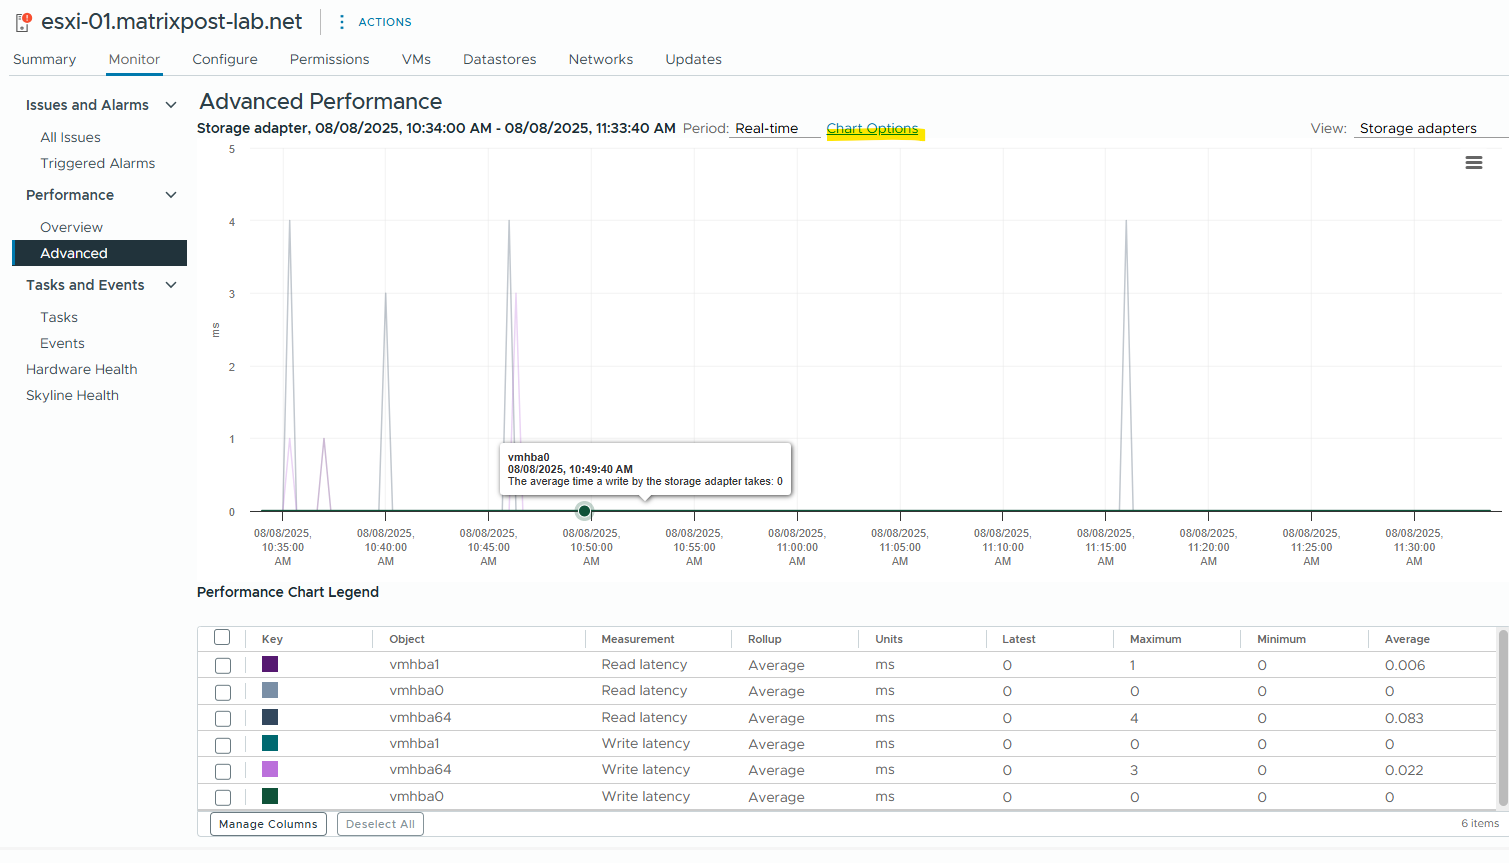
Host (SAN) Storage Analysis
We can also analyze our SAN storage performance in vSphere by using the monitor tab from our ESXi hosts.
Storage Adapter (HBA/iSCSI) selection shows IOPS, latency, and throughput per storage protocol path.
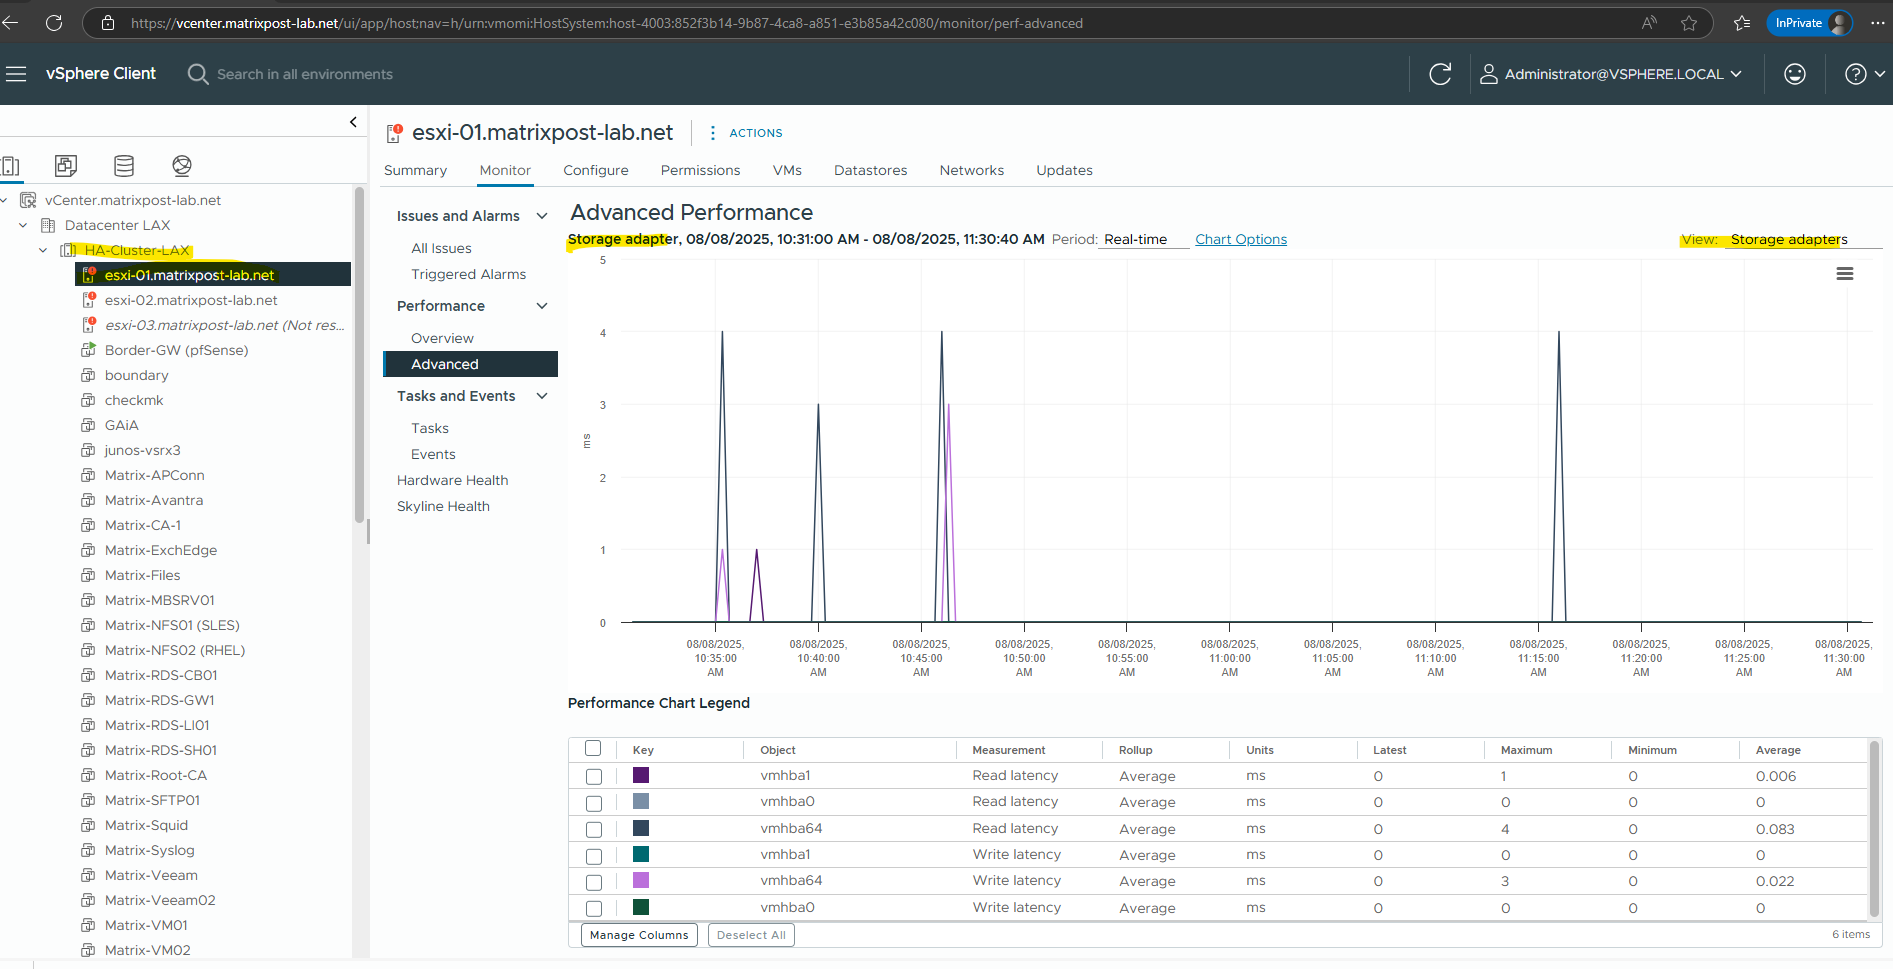
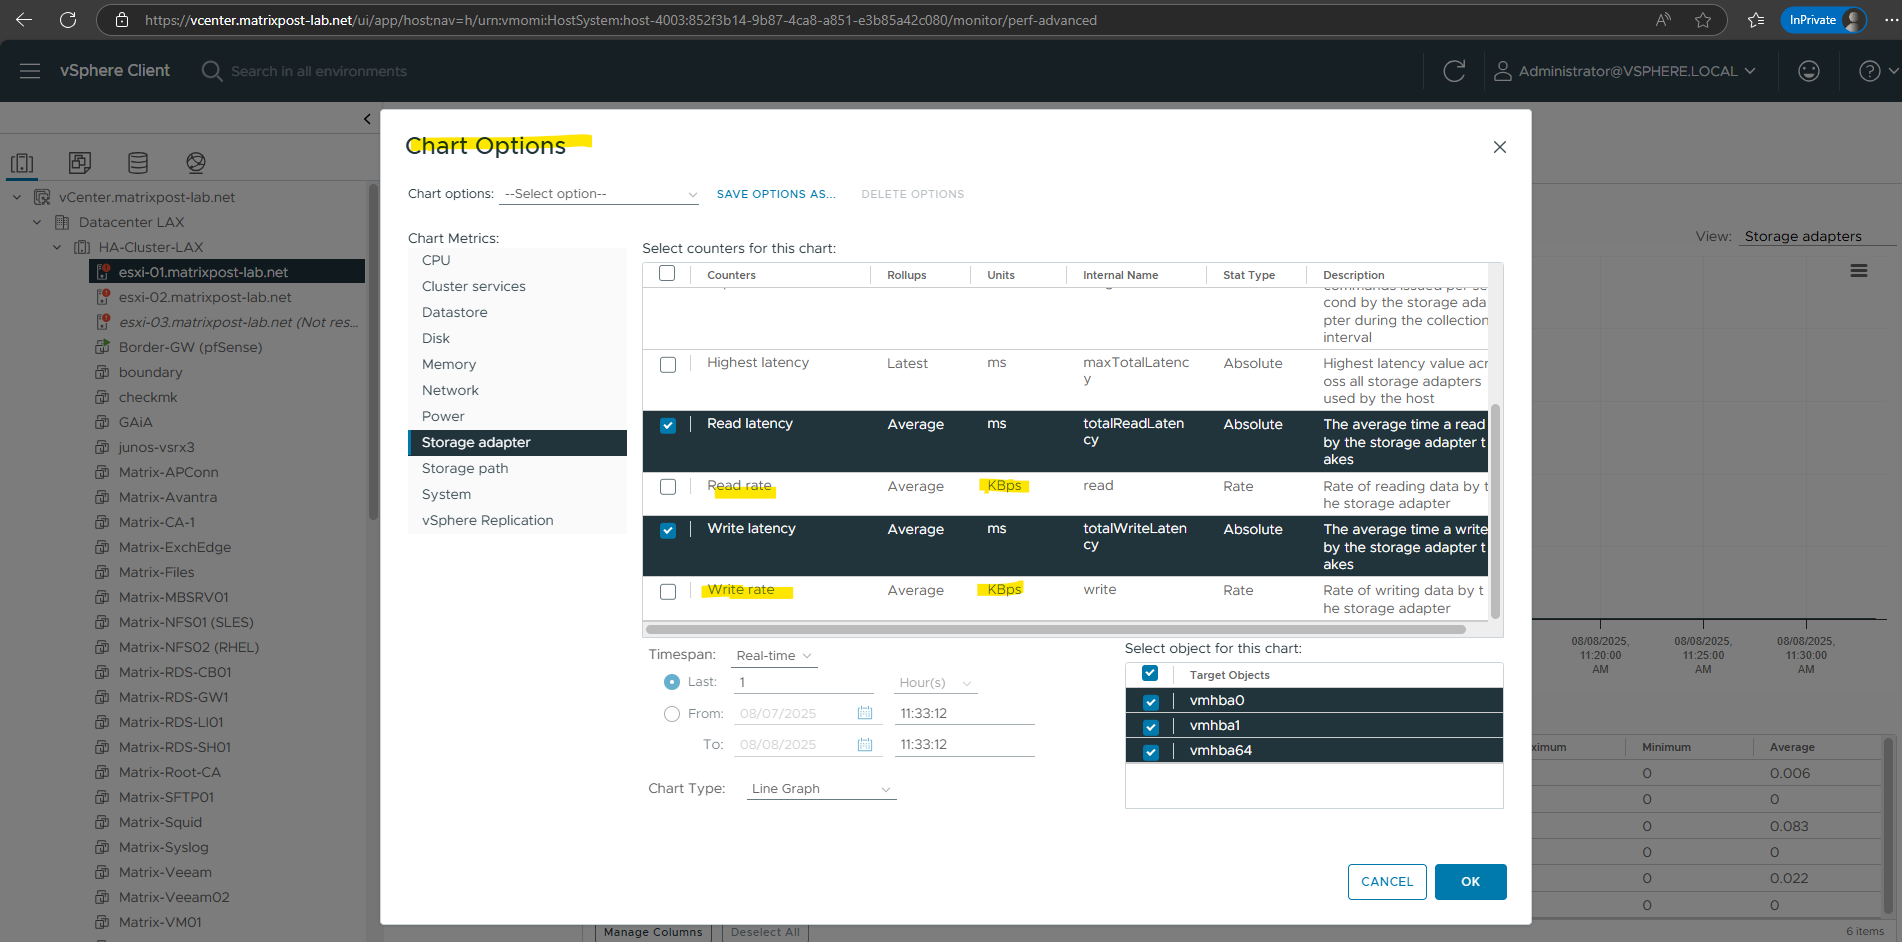
To also analyze the throughput per storage protocol path, we need to click on Chart Options below.
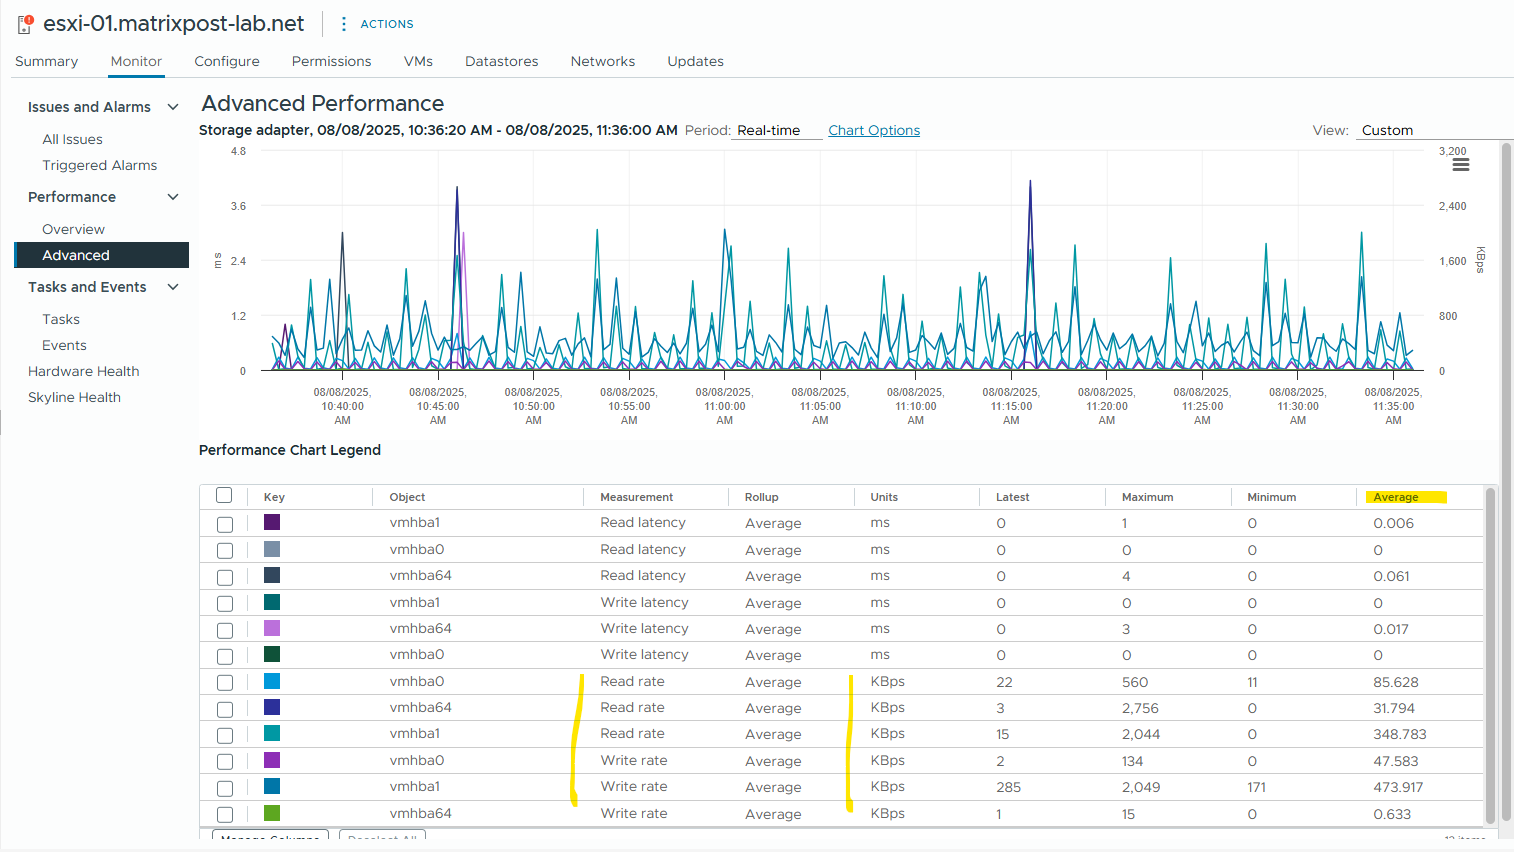
Select Read rate and Write rate in KBps.
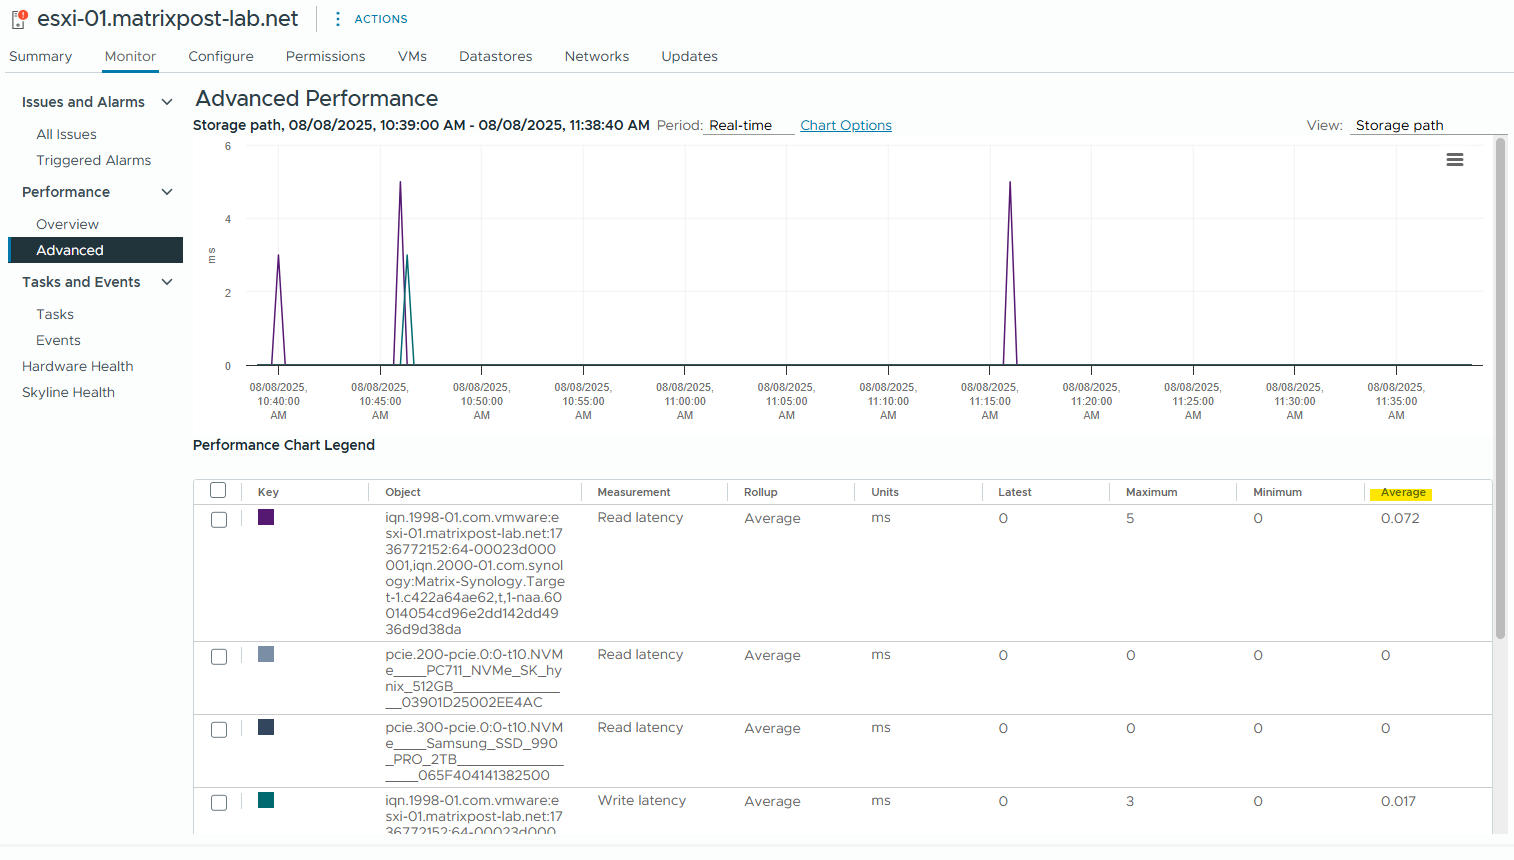
We can also analyze the storage path to see I/O behavior in milliseconds (ms) per active path to a LUN.
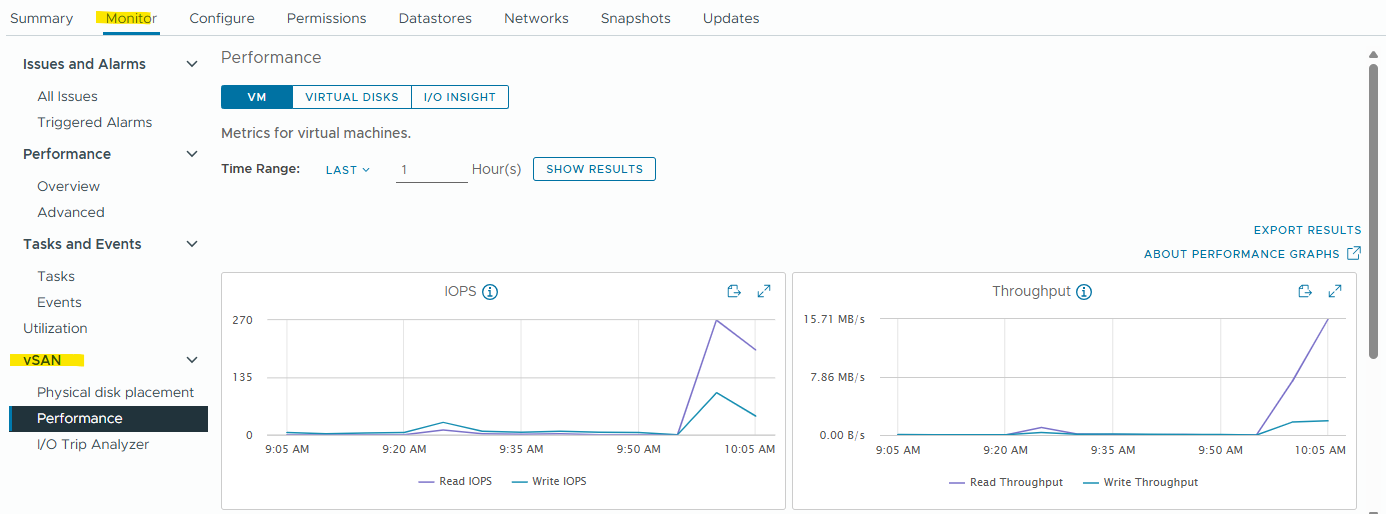
vSAN Analysis
vSAN typically handles tens of thousands of IOPS per disk group depending on your hardware.
Below we will see the IOPS (Input/Output Operations Per Second) which measures how many read/write operations our VM is doing.
The selected VM has:
- ~270 Read IOPS
- ~99 Write IOPS
which are fairly low to moderate usage levels.
Idle VM / OS boot ==> 0–50 IOPS
Light application workload ==> 50–500 IOPS
Web/App server ==> 500–5,000 IOPS
Database server ==> 2,000–50,000+ IOPS
VDI (virtual desktops) ==> 100–2,000 IOPS per user
Heavy workloads (e.g., backups, indexing) ==> 10,000+ IOPS
Links
vSphere Storage
https://techdocs.broadcom.com/us/en/vmware-cis/vsphere/vsphere/7-0/vsphere-storage-7-0.html