Mastering Azure Update Manager – Part 4
In Part 3 we saw how to patch SUSE Linux Enterprise by using the Azure Update Manager and some troubleshooting.
Now in this part we will see how to get notified about patch installation states (like e.g. Succeeded or Failed) per email by using Azure Monitor alerts.
We will use queries to set up alerts for our deployed Azure resources. We can create queries using Azure Resource Graph tables, or we can combine Azure Resource Graph tables and Log Analytics data from Azure Monitor Logs.
Logs created from patching operations such as update assessments and installations are stored by Azure Update Manager now in Azure Resource Graph (ARG). You can view up to last seven days of assessment data, and up to last 30 days of updated installation results.
Source: https://learn.microsoft.com/en-us/azure/update-manager/manage-alerts
Further we will see how to use the Azure Resource Graph Explorer to manually trigger custom queries for Azure Update Manager to see patching results.
Introduction
Logs created from operations like update assessments and installations are stored by Azure Update Manager in Azure Resource Graph.
Resource Graph is a service in Azure designed to be the store for Azure service details without any cost or deployment requirements.
Update Manager uses Resource Graph to store its results. You can view the most recent update assessment history for the last 7 days and update installations history for the last 30 days from the Resource Graph.
Update Manager sends the results of all its operations into Azure Resource Graph as logs, which are available for 30 days. Listed here are the structure of logs being sent to Azure Resource Graph.
Source: https://learn.microsoft.com/en-us/azure/update-manager/query-logs
Azure Monitor (AUM Alert Rules)
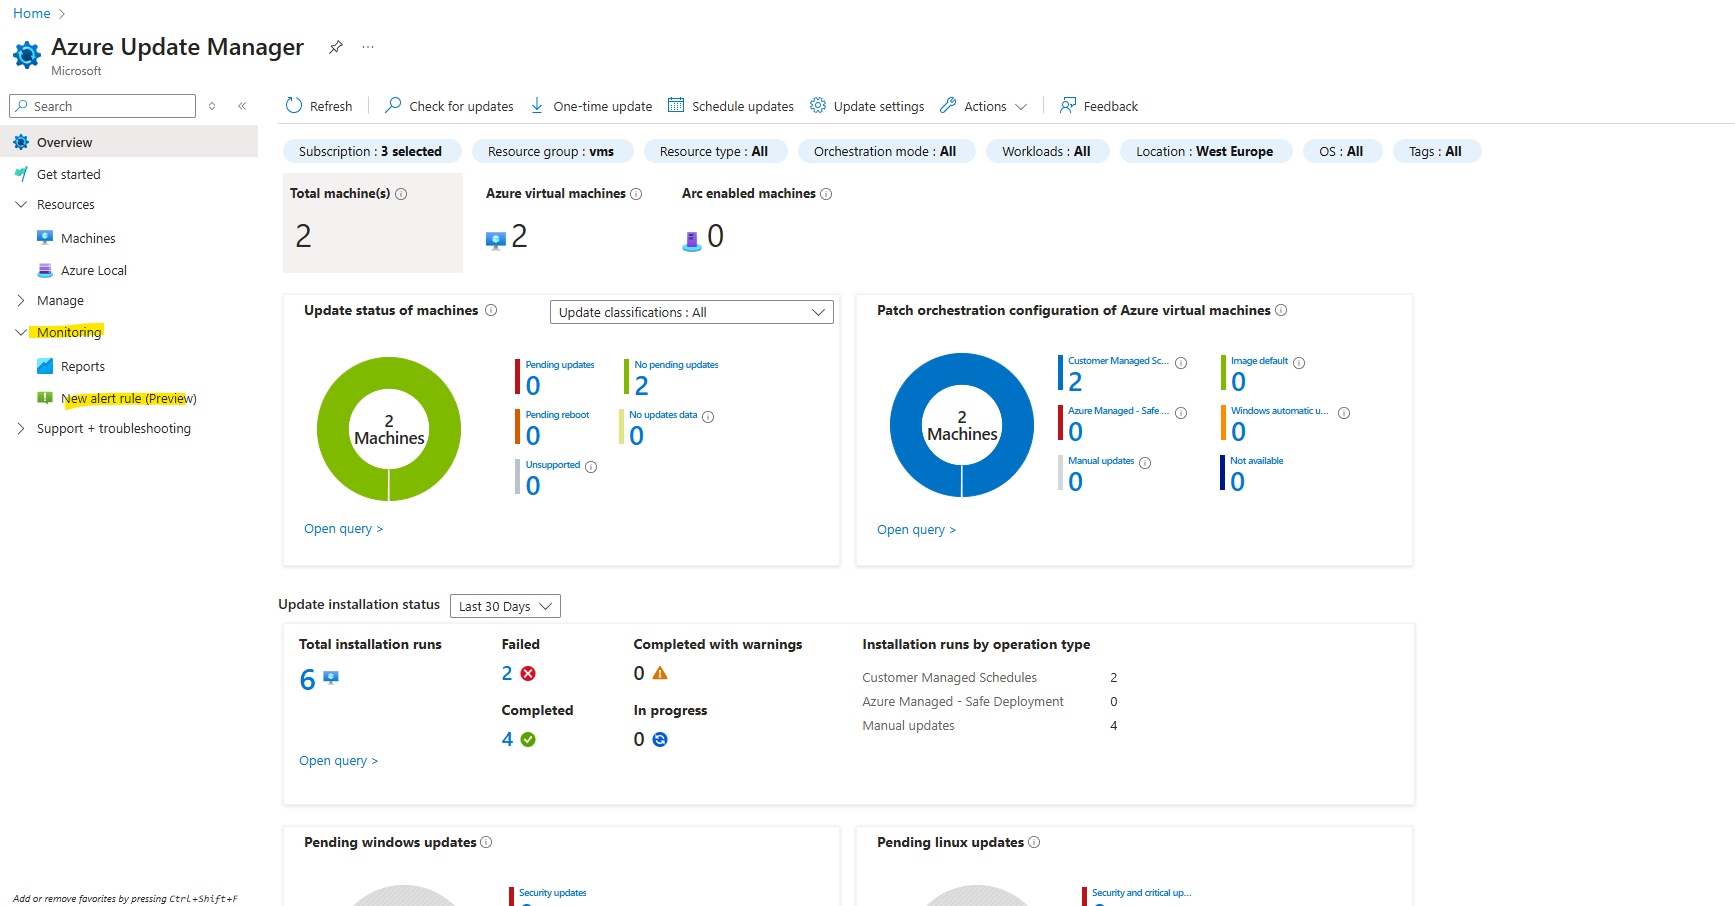
For Azure Update Manager we can enable Alerts (preview) to address events as captured in updates data.
Logs created from patching operations such as update assessments and installations are stored by Azure Update Manager in Azure Resource Graph (ARG).
You can view up to last seven days of assessment data, and up to last 30 days of updated installation results.
Alert rules based on ARG query requires a managed identity with reader role assigned for the targeted resources.
Since around September 2023 Azure offers public preview support (as of today still in preview) for also querying ARG from Azure Monitor (Log Analytics) by using the arg(“”) call operator.
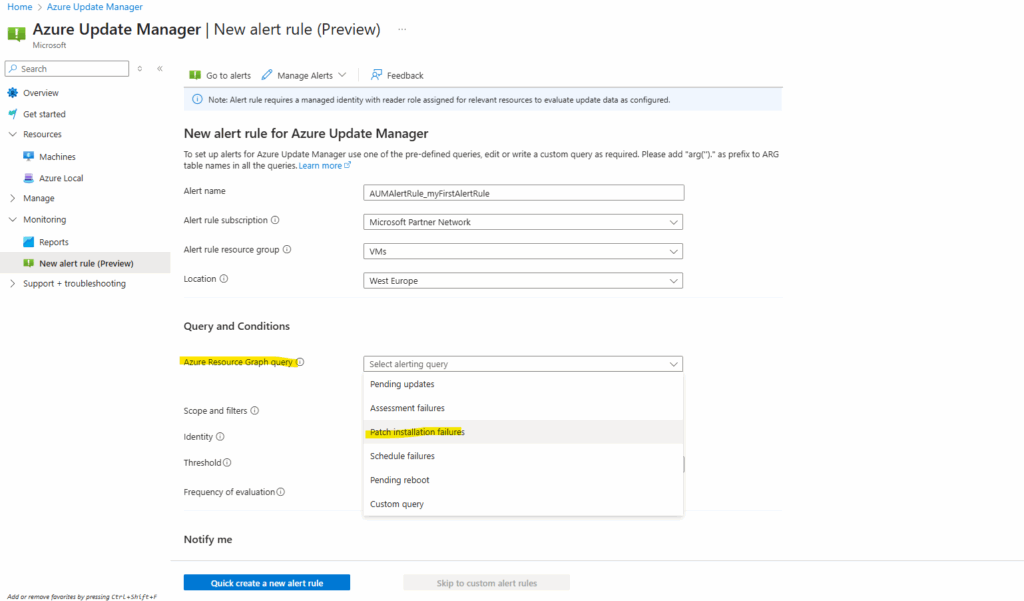
To enable alerts click on Monitoring -> New alert rule.
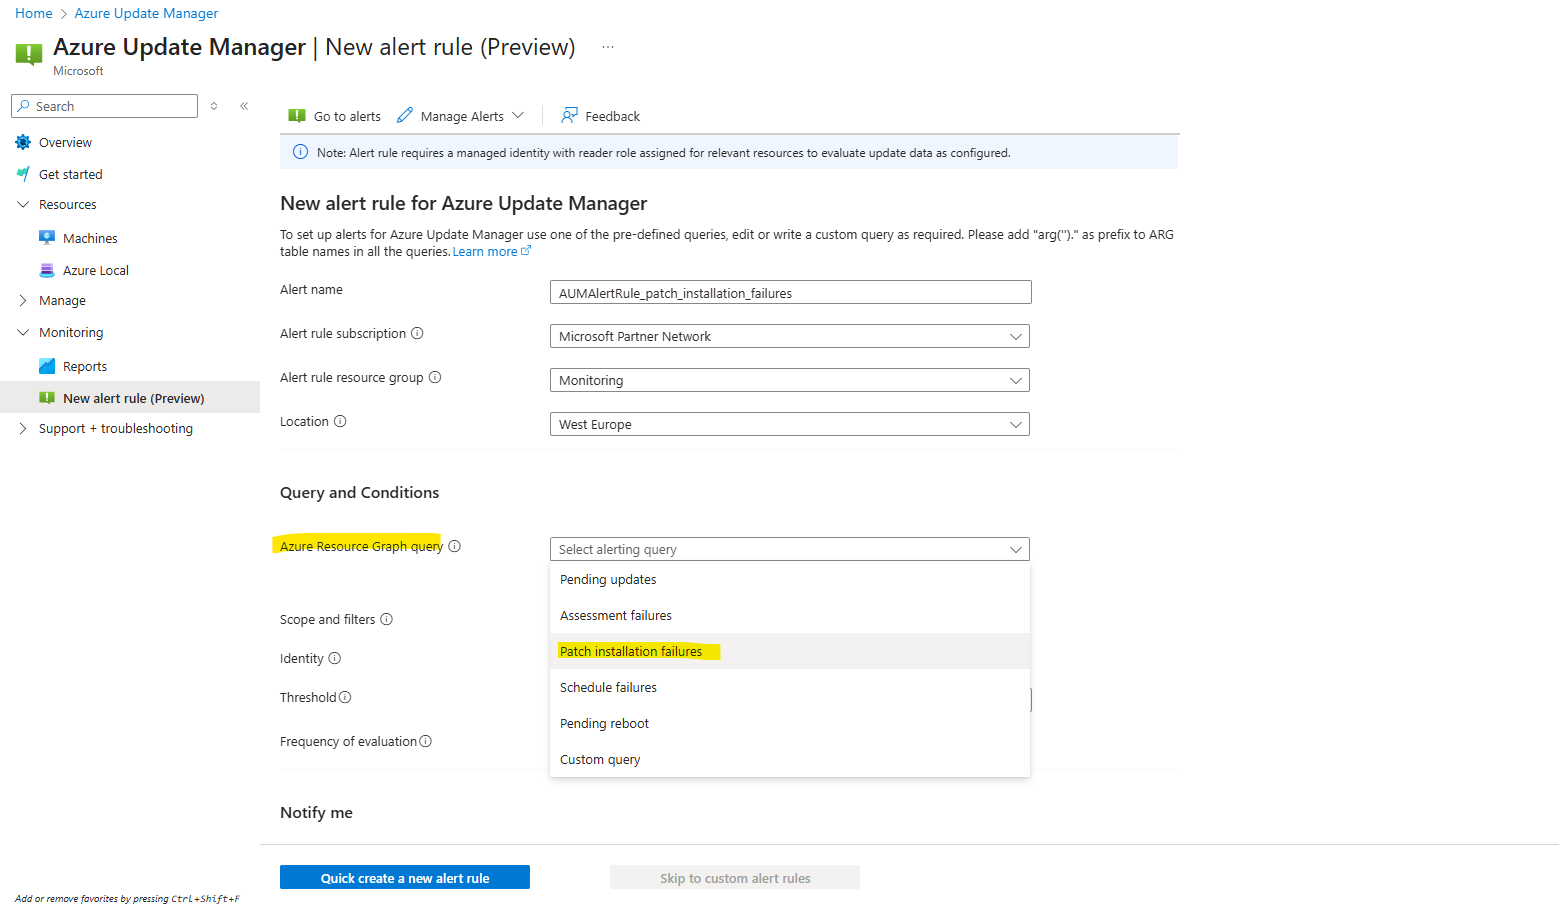
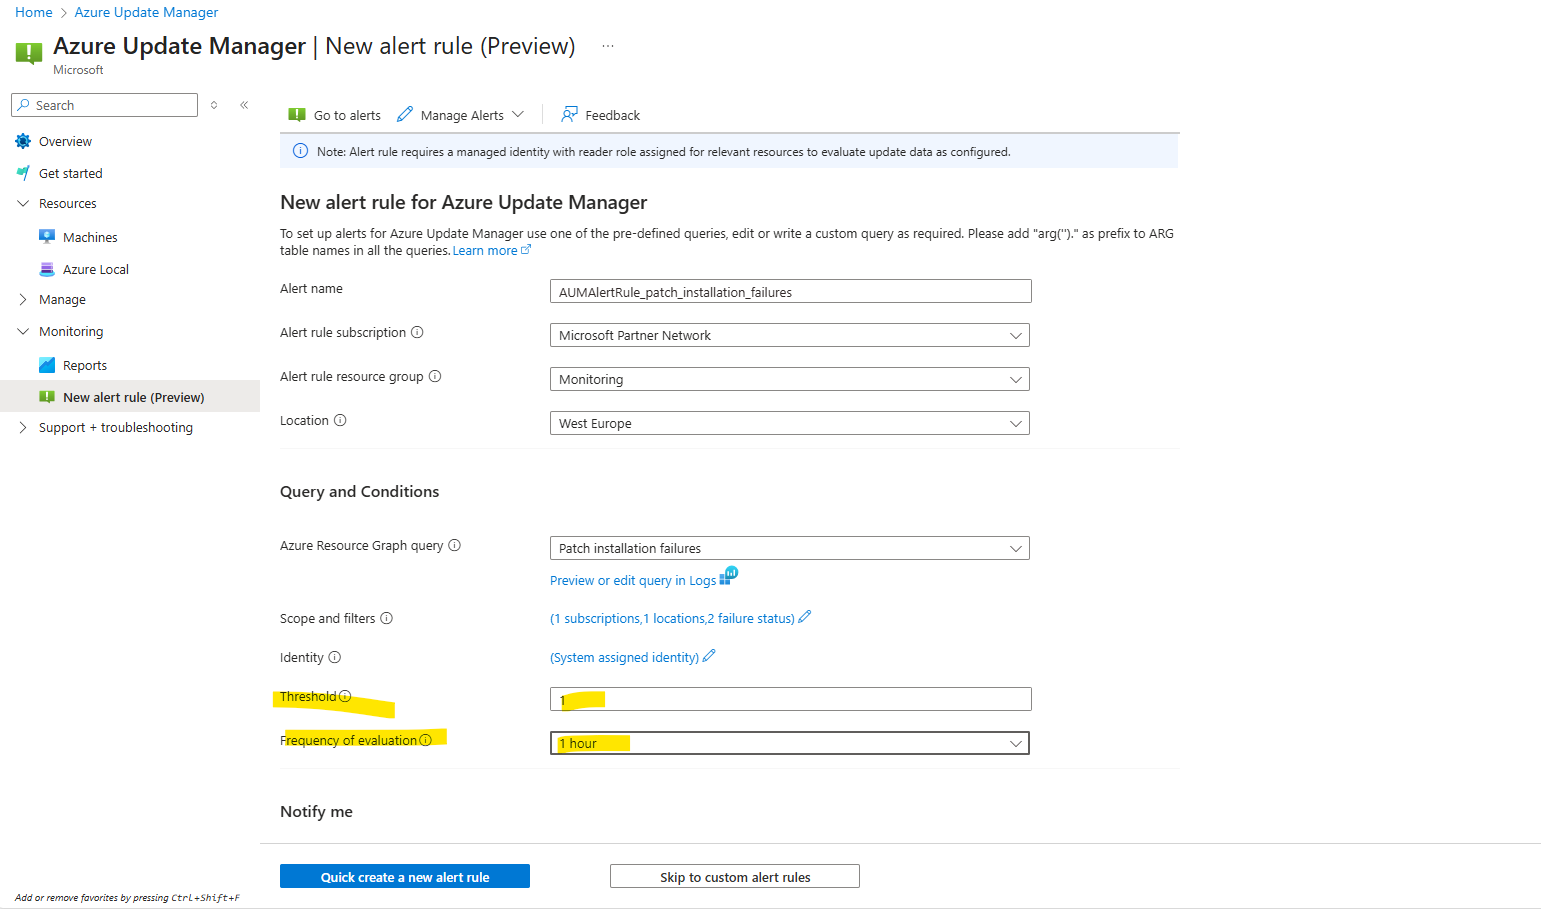
Enter a name for the new alert rule, specify the subscription which will be auto populated as the scope of the alert rule and select the location in which this alert will be created.
This subscription is where the alert rule will be created, same with location.
Further select which Azure Resource Graph query you want to use to query for alert events, I want to get notified about patch installation failures.
We can also select here Custom query to adjust the query to our needs. We will see later down some samples and the syntax we need to use to create our own queries.
The pre-defined Patch installation failures query we selected above finally will looks like below.
The portal injects arg(‘ ‘) to tell the Azure Monitor alert engine “go query Resource Graph, not Log Analytics.”
Log Analytics alert rules normally run KQL over Log Analytics tables.
Azure Monitor now also supports querying ARG directly inside alerts. You can run cross-service queries by using any client tools that support Kusto Query Language (KQL) queries, including the Log Analytics web UI, workbooks, PowerShell, and the REST API.
More about here https://techcommunity.microsoft.com/blog/azureobservabilityblog/query-azure-resource-graph-from-azure-monitor/3918298.
arg('').patchinstallationresources
| where type in~ ("microsoft.compute/virtualmachines/patchinstallationresults", "microsoft.hybridcompute/machines/patchinstallationresults")
| where subscriptionId in~ ("e42b83 ..................... 378a2a61")
| where location in~ ("westeurope")
| where properties.status in~ ("Failed","CompletedWithWarnings") // "CompletedWithWarnings" and other statuses can also be considered
| where properties.lastModifiedDateTime > ago(1d)
| parse id with vmResourceId "/patchInstallationResults" *
| project vmResourceId
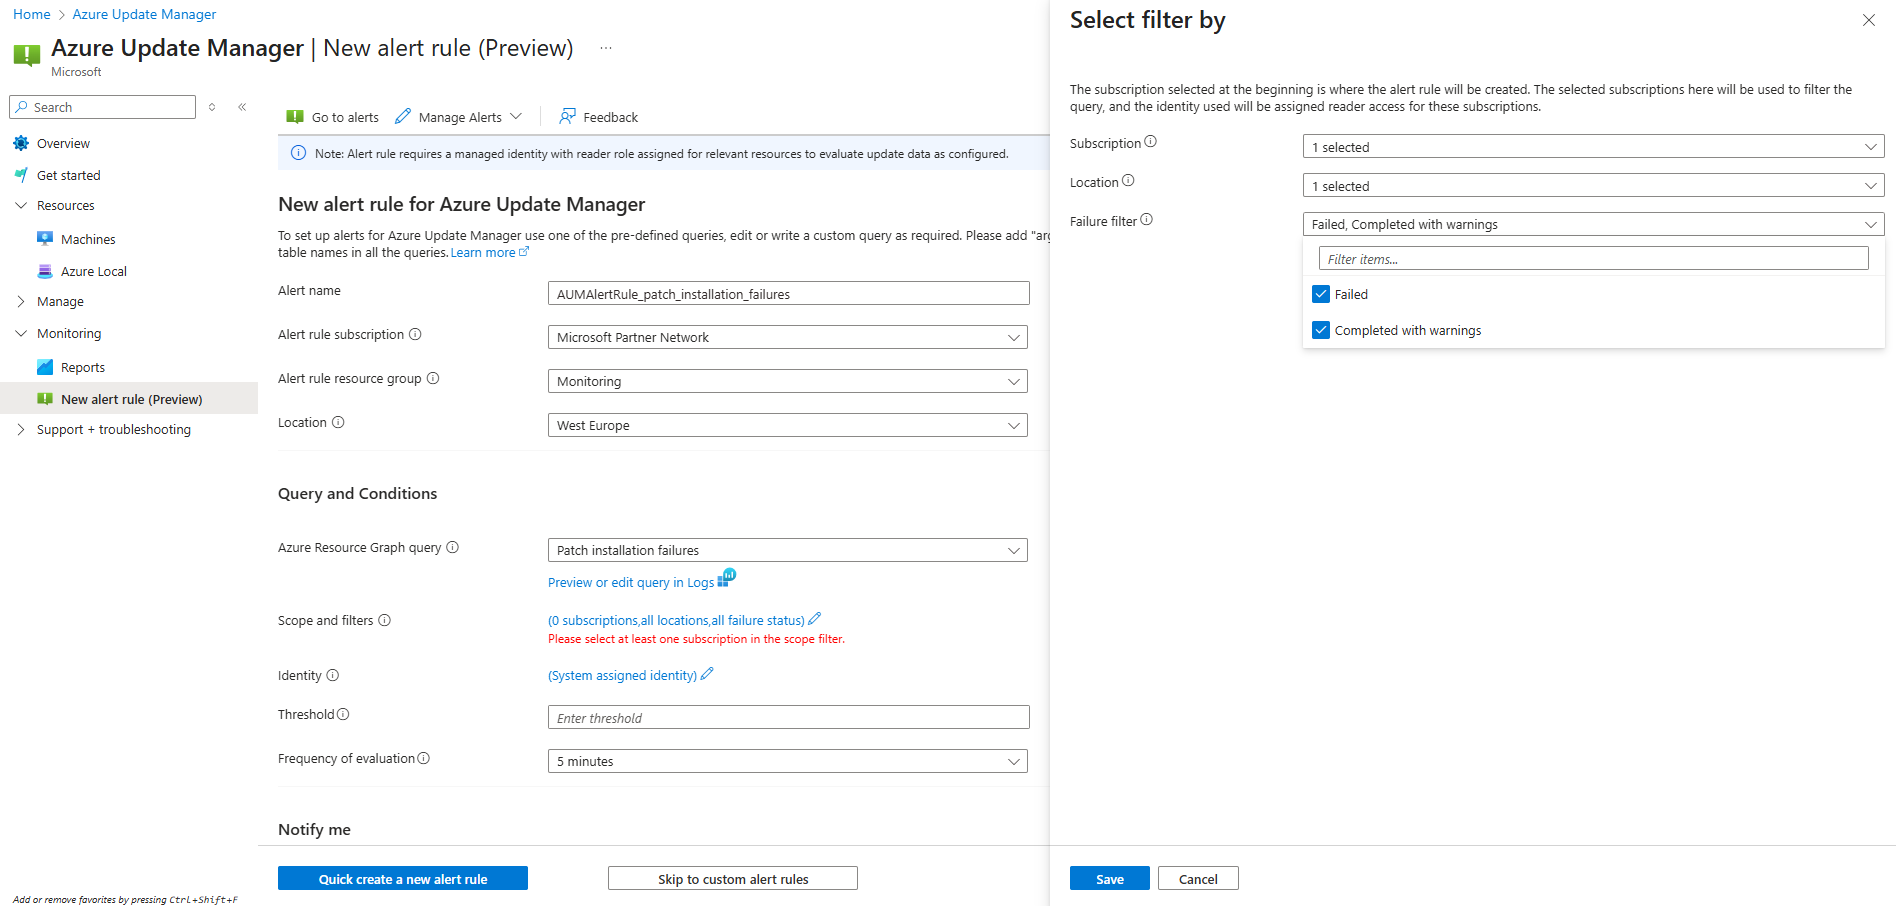
| distinct vmResourceIdFor the scope and filters click on the link below to configure them.
The selected subscriptions here will be used to filter the query (resources to include from in the query), and the identity used will be assigned reader access for these subscriptions (more about below).
Same with location, select which should be included in the query.
For the failure filter I will select both, failed and completed with warnings to include in the query.
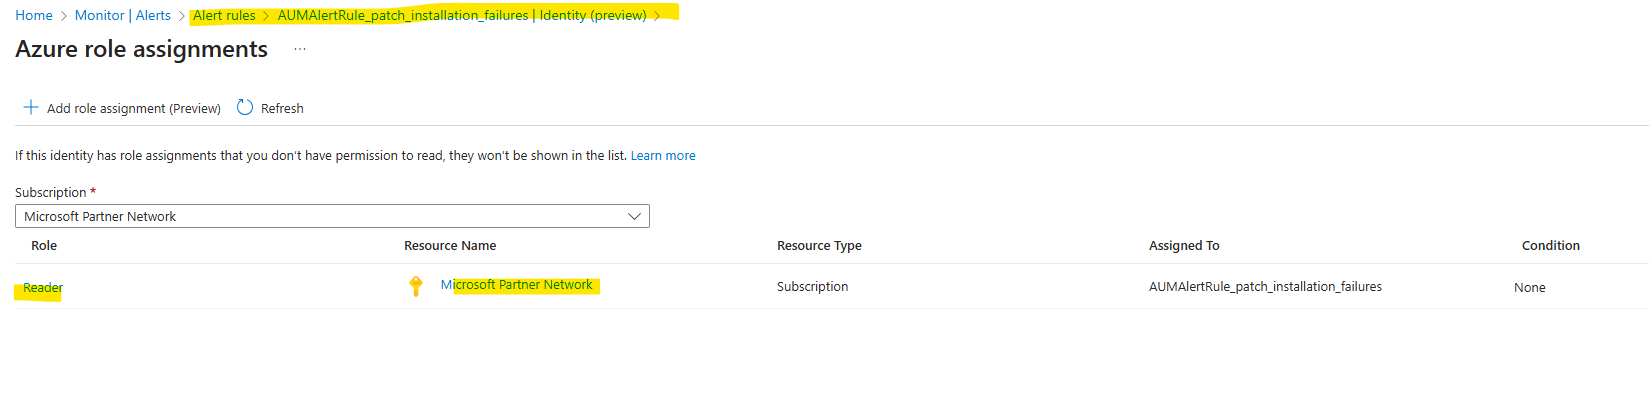
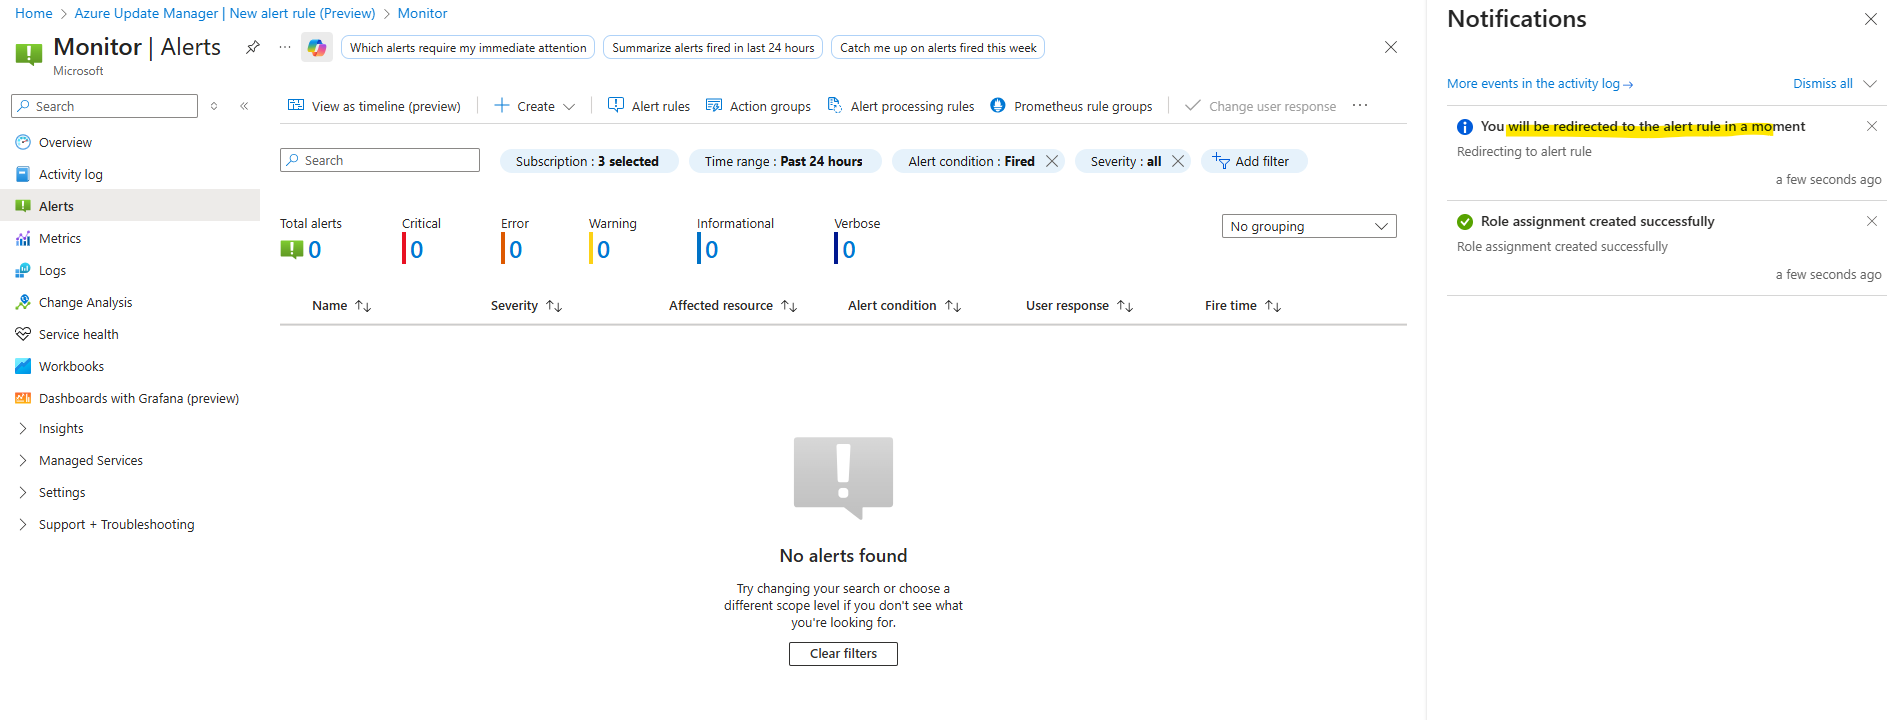
As mentioned above, to the system assigned identity (enabled by default) of the new alert rule will be automatically assigned the reader access role for the selected subscriptions (automatically just here when creating a new Azure Update Manager alert rule, not when creating a new general alert rule like shown here). We can verify this role assignment by clicking below under Settings -> Identity on the Azure role assignments button.
Some Azure Monitor alert rules don’t need an identity because the platform already has access to built-in signals like metrics and activity logs. But when an alert queries customer-owned data sources such as a Log Analytics workspace or Azure Resource Graph, Azure Monitor creates a system-assigned managed identity that must be granted the right RBAC role to read that data. This ensures alerts can run securely without over-privileged access.
In that case we won’t find under Settings here the menu point with Identity.
Our alert here needs to access the Azure Resource Graph and therefore needs at least read permissions.
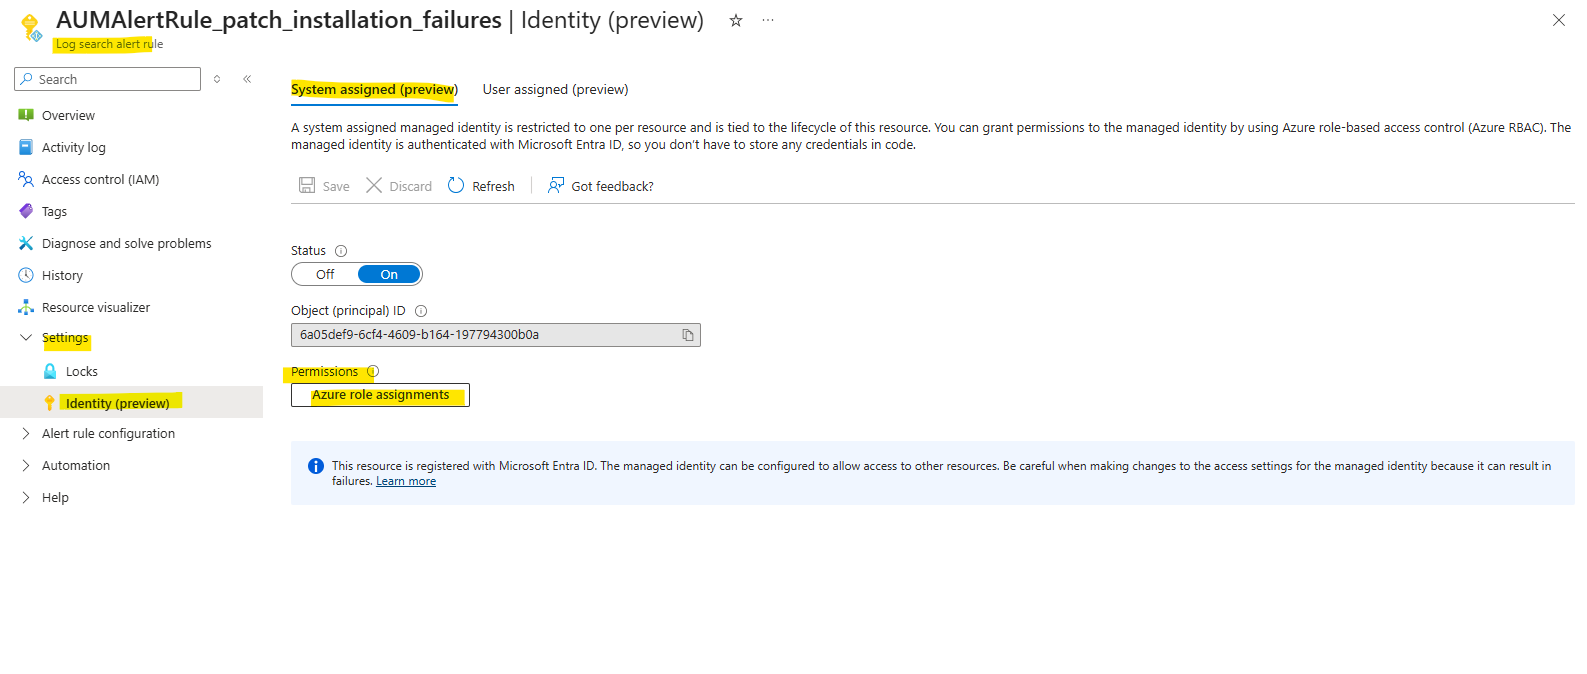
Here we can see that the reader role was successfully assigned to the managed identity our our new alert rule. Therefore the alert rule can query the logs of the subscription (Azure Update Manager logs).
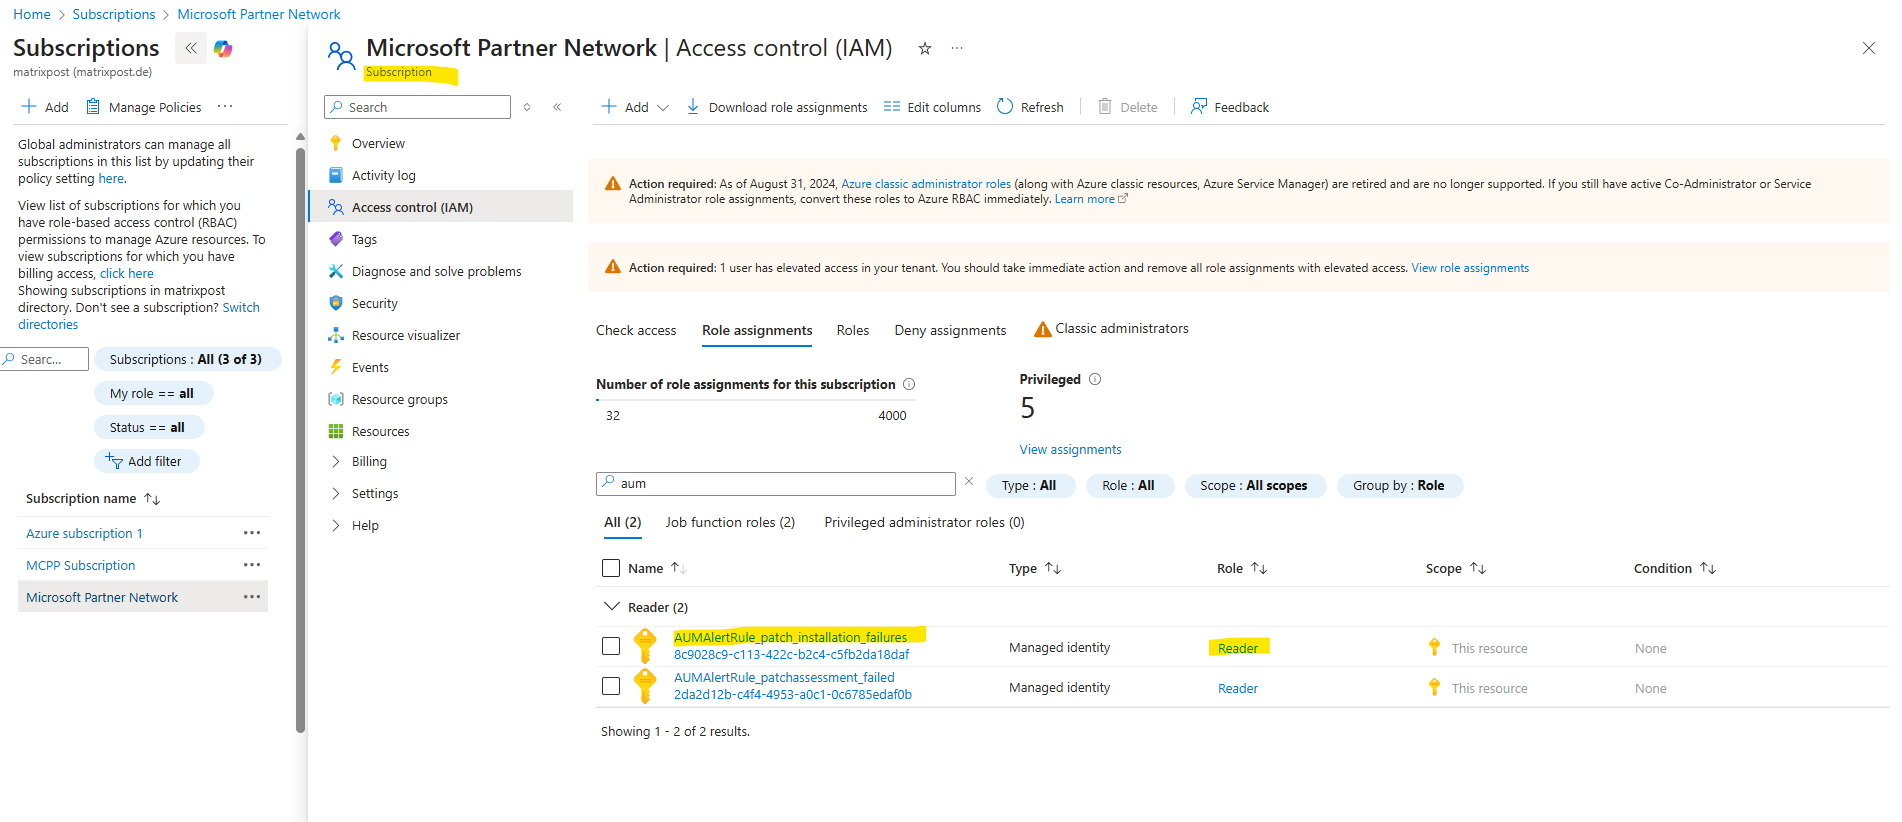
Or verify it directly on the subscription under Access control (IAM).
Back to the settings of our new alert rule. For the Threshold I will set 1. The frequency I will set to 1 hour, so each hour the alert rule will be run. For production use you may want run this evaluation just once per day, so adjust it to your needs.
Use a query that checks for failedPatchCount >= 1
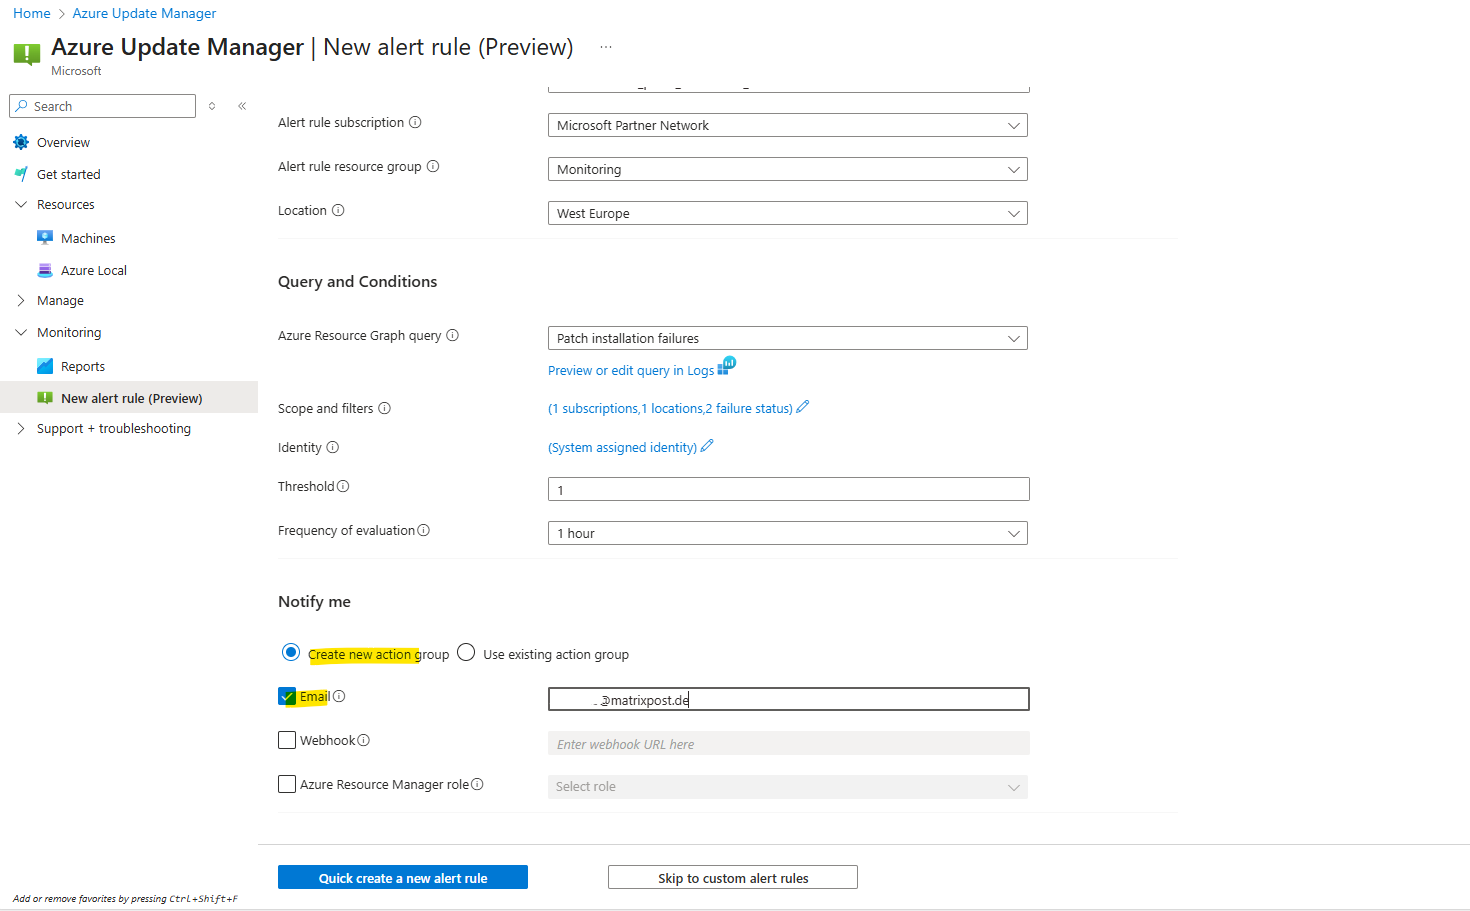
Then finally I will check Email to get notified per email when patch failure or warnings will be raised by Azure Update Manager.
To fire up email notifications we also need to either create a new Azure Monitor action group or selecting an existing if available. Below I will create a new action group.
Click on Quick create a new alert rule.
When a new action group with email notification is created, the assigned email recipient will get an email notifying about that you’ve been added to an Azure Monitor action group.
To see the new alert rule and action group, navigate to Azure Monitor. We also need to adjust one more setting in order our alert rule will be fired also if just one patch installation failure will occur.
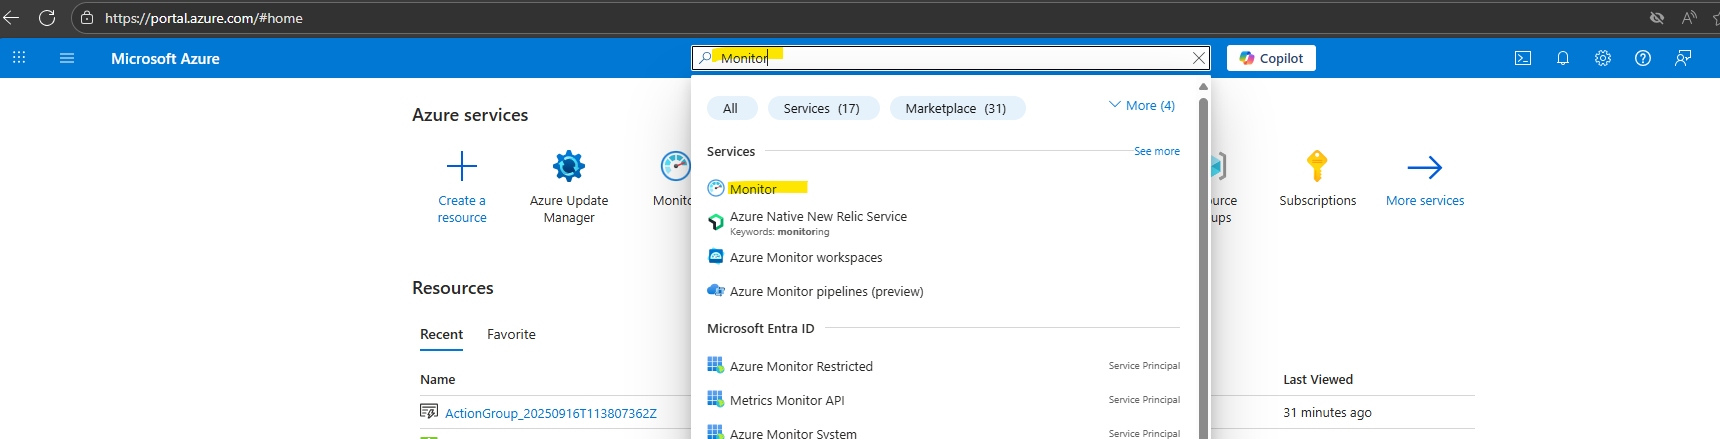
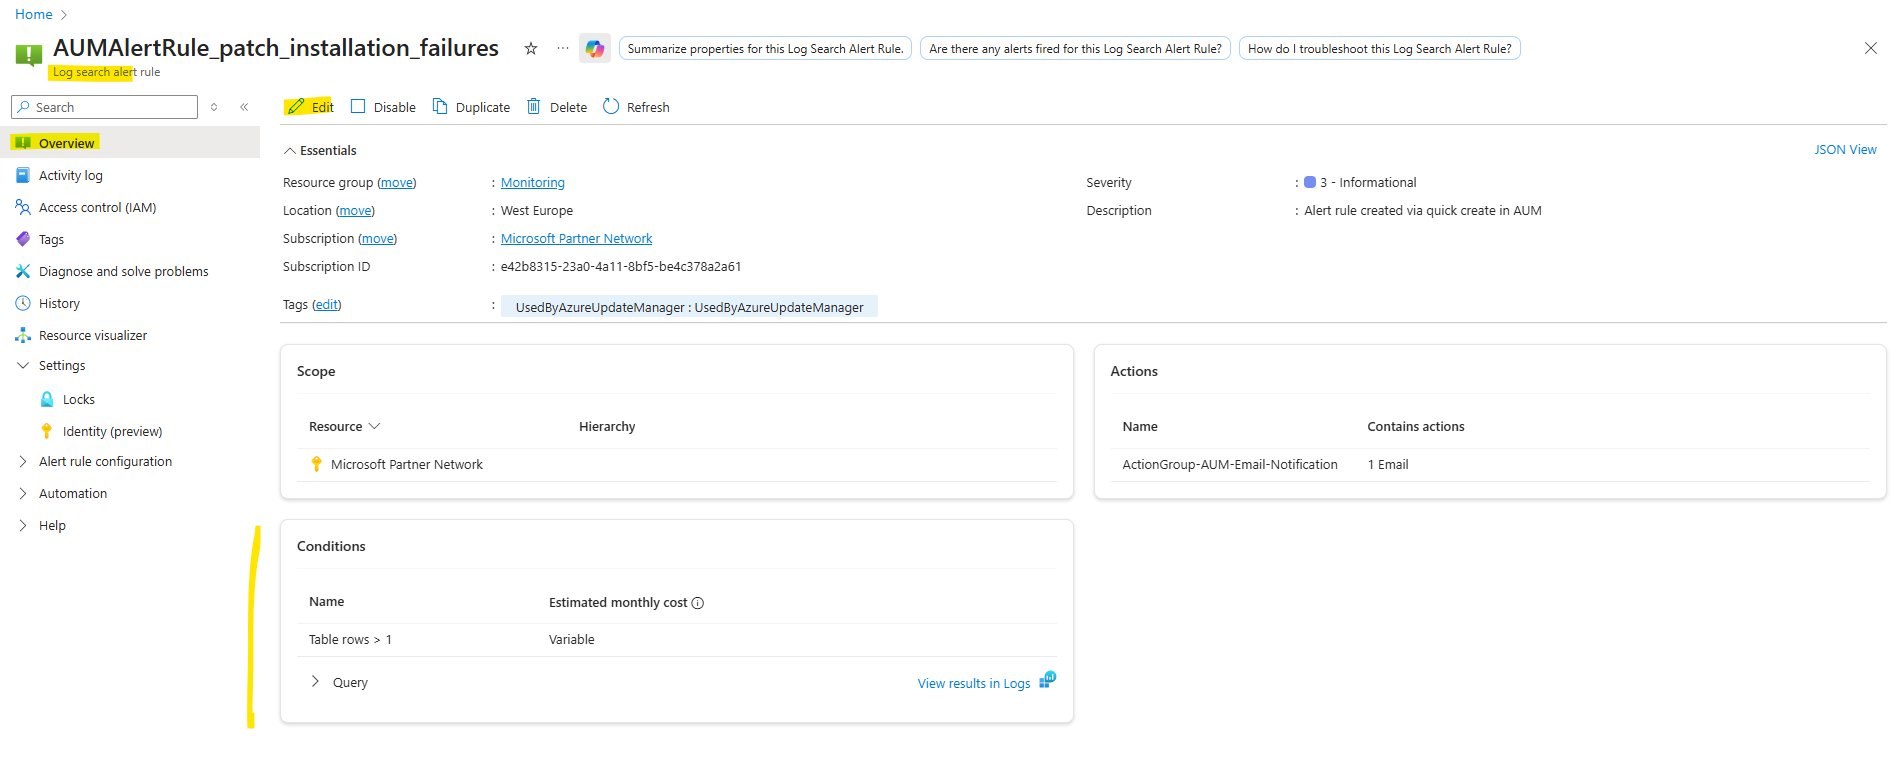
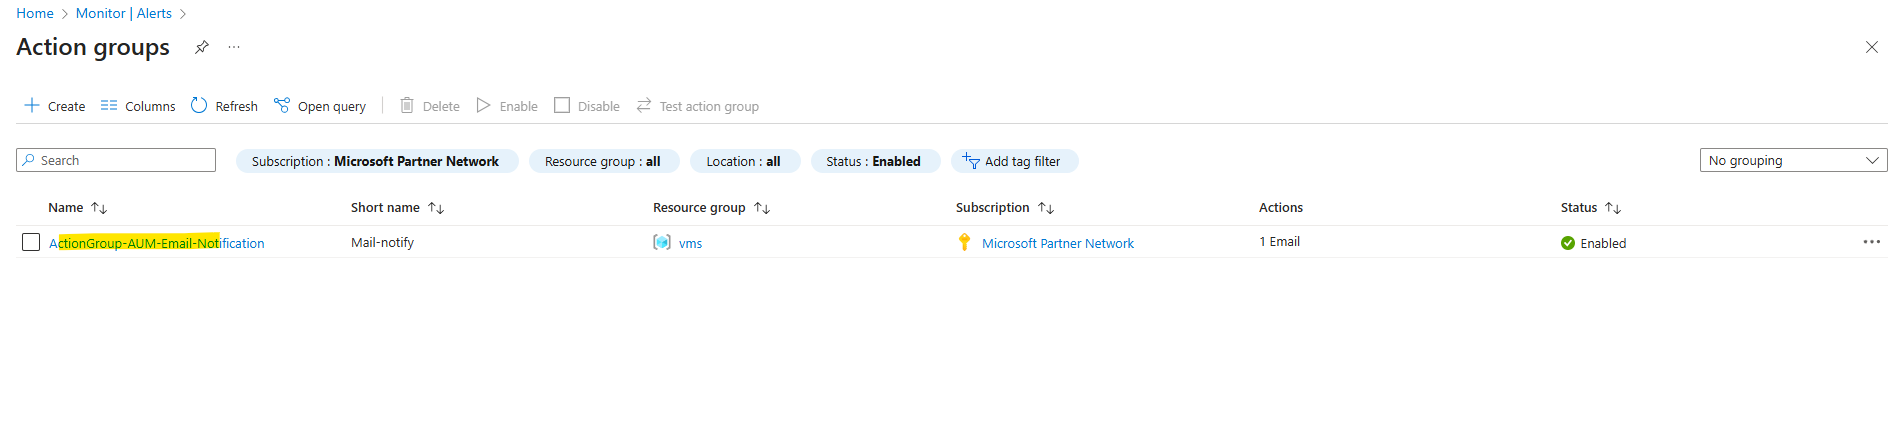
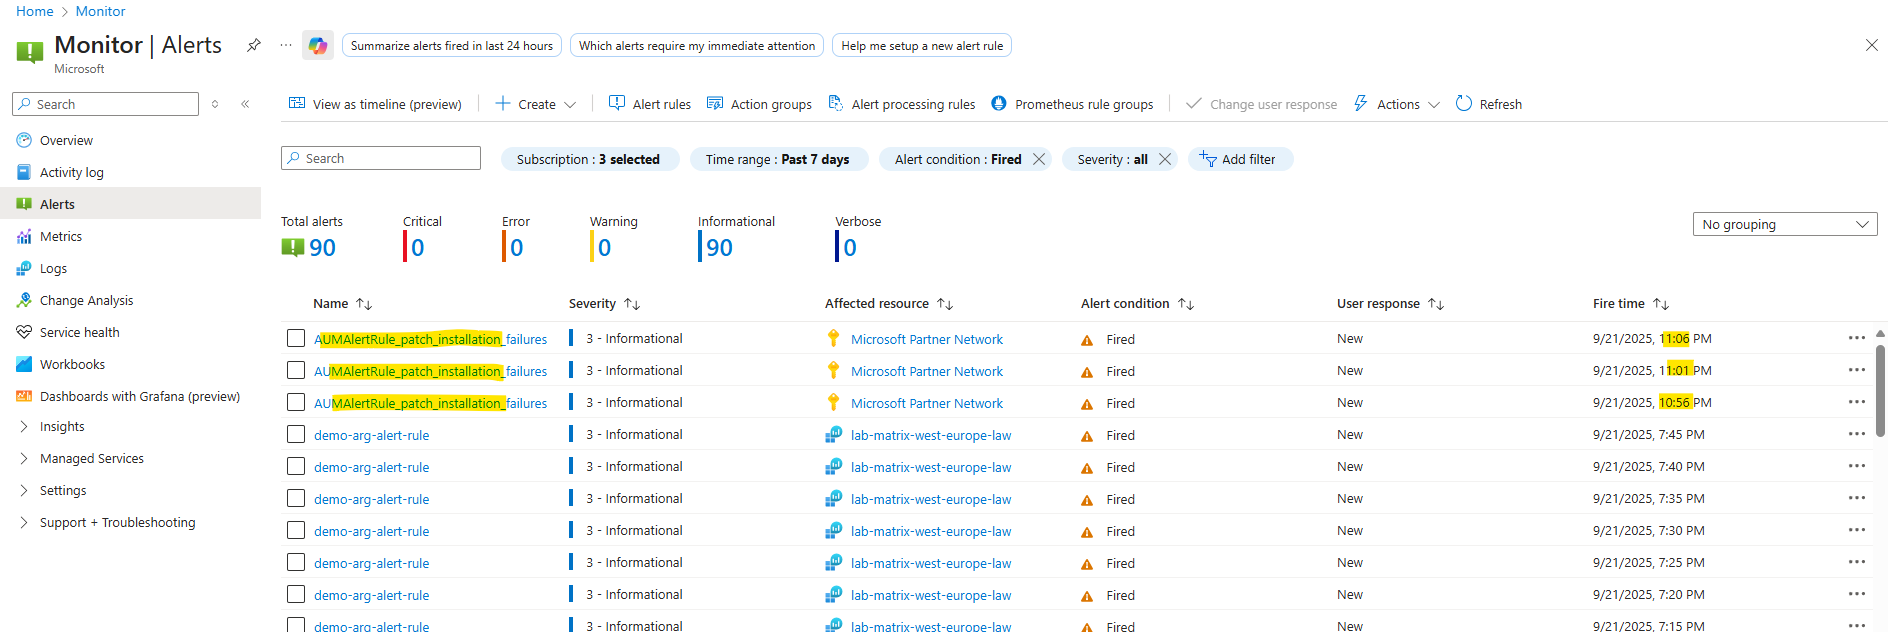
In Azure Monitor navigate to Alerts -> Alert rules as shown below.
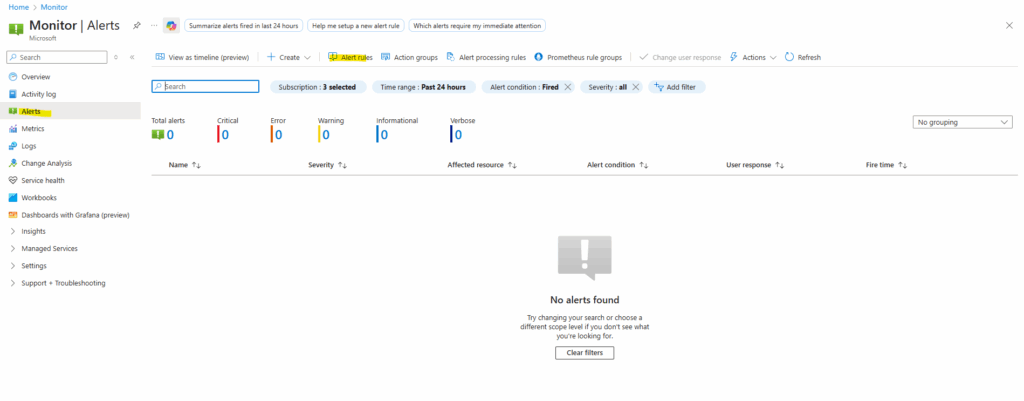
Here we will see our newly created alert rule.
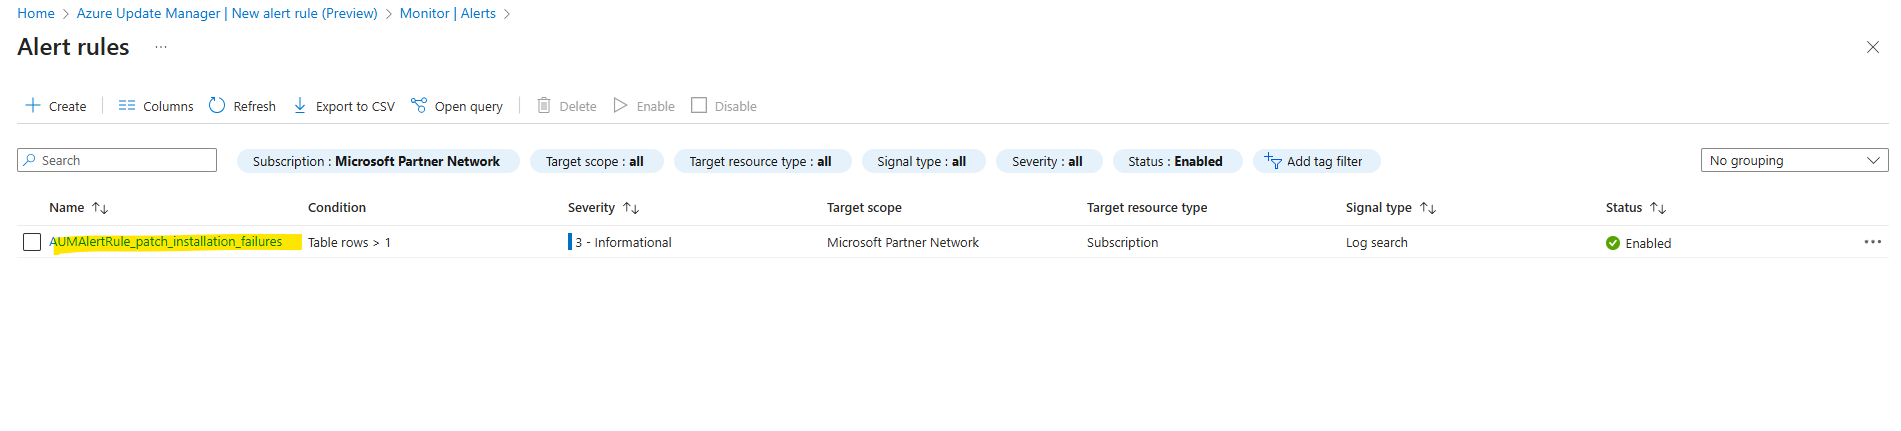
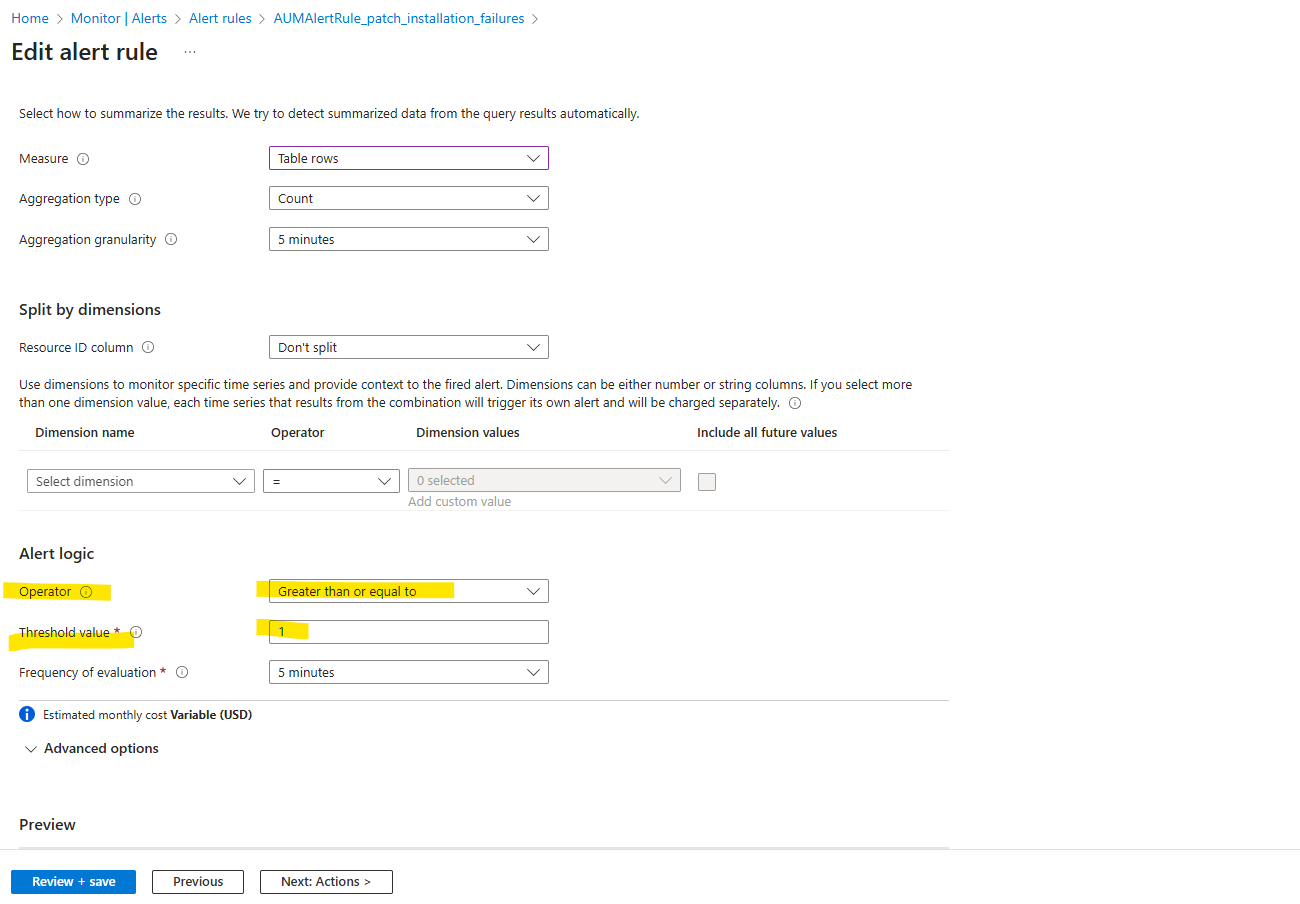
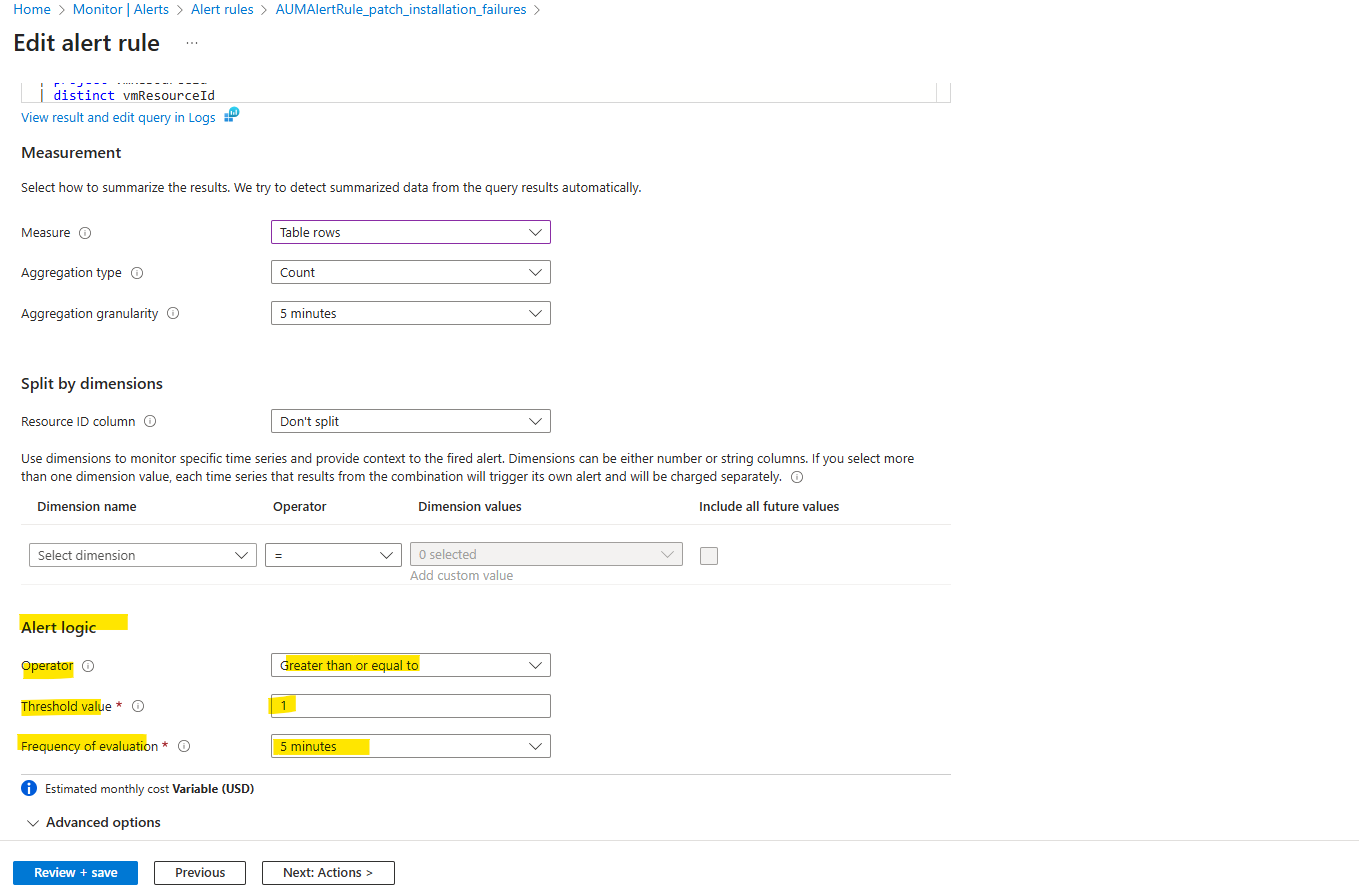
As mentioned we also need to edit the rule to adjust the alert logic to also fire an alert in case just one patch installation failure will be raised. Click on Edit.
For Operator under Alert logic, select Greater than or equal to, in case we leave the default setting on Greater than, our new alert will be not fired in case just one patch installation failure will be raised and therefore just one table row will be returned.
For our Azure Update Manager alert rule here, the aggregation granularity setting below with 5 minutes by default is effectively ignored because the query’s ago(1d) clause returns a single, cumulative count over the entire 24-hour period.
Aggregation granularity only becomes relevant when the query itself uses functions like bin() to group data into smaller time windows, allowing the alert rule to check for a condition (e.g., a count >=1) on each of those individual time bins rather than on the total period.
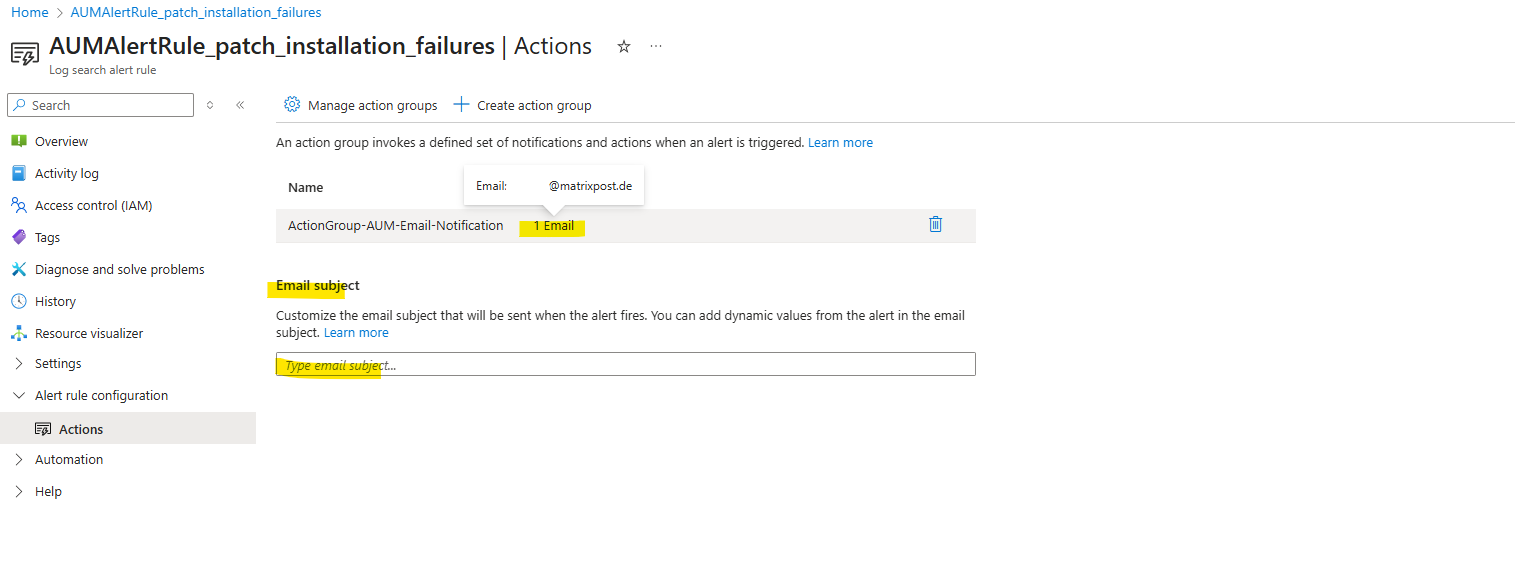
On the new alert rule under Alert rule configuration -> Actions we will see our newly created Action Group which is associated with the alert rule. We can set here also add a custom email subject.
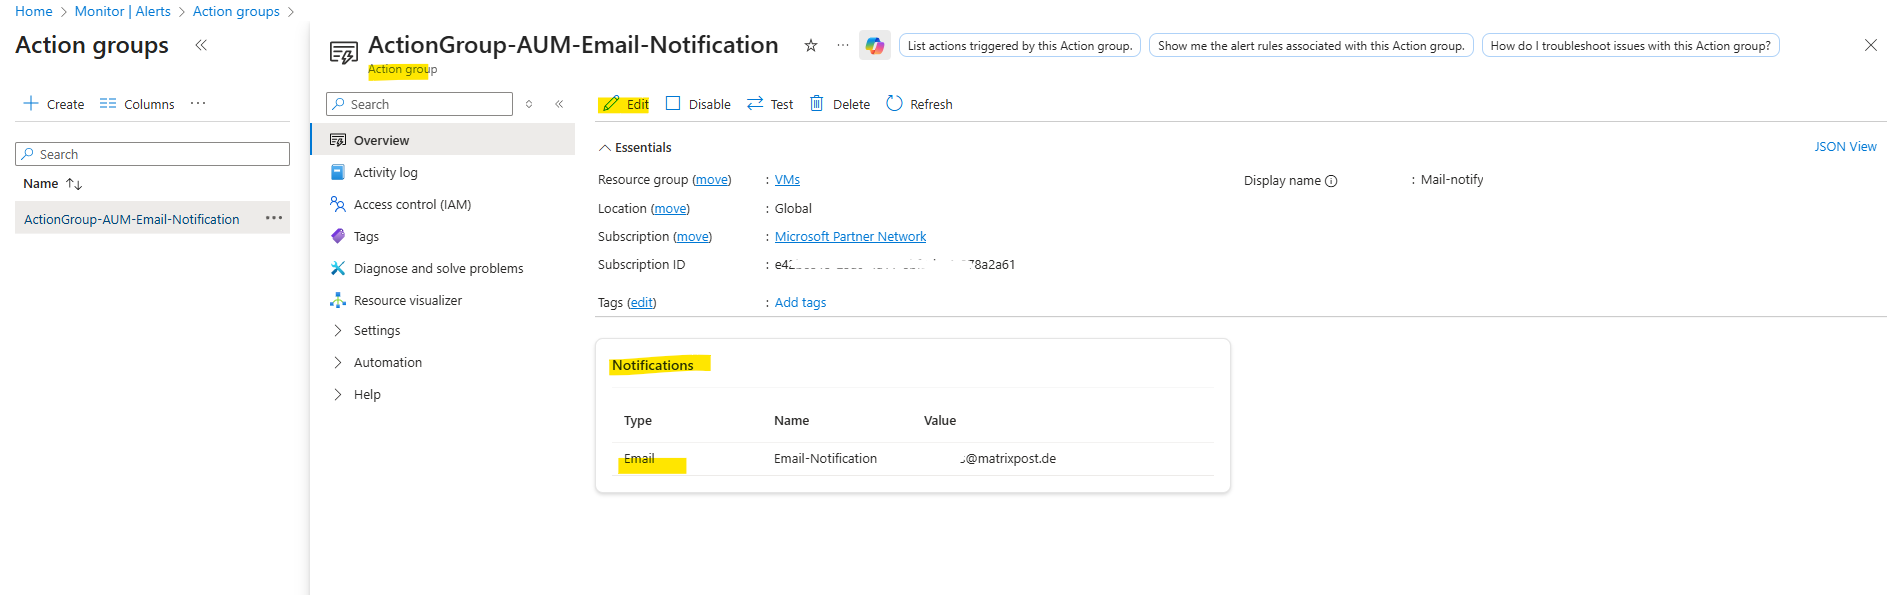
We can also navigate from Azure Monitor -> Alerts directly to the created action groups.
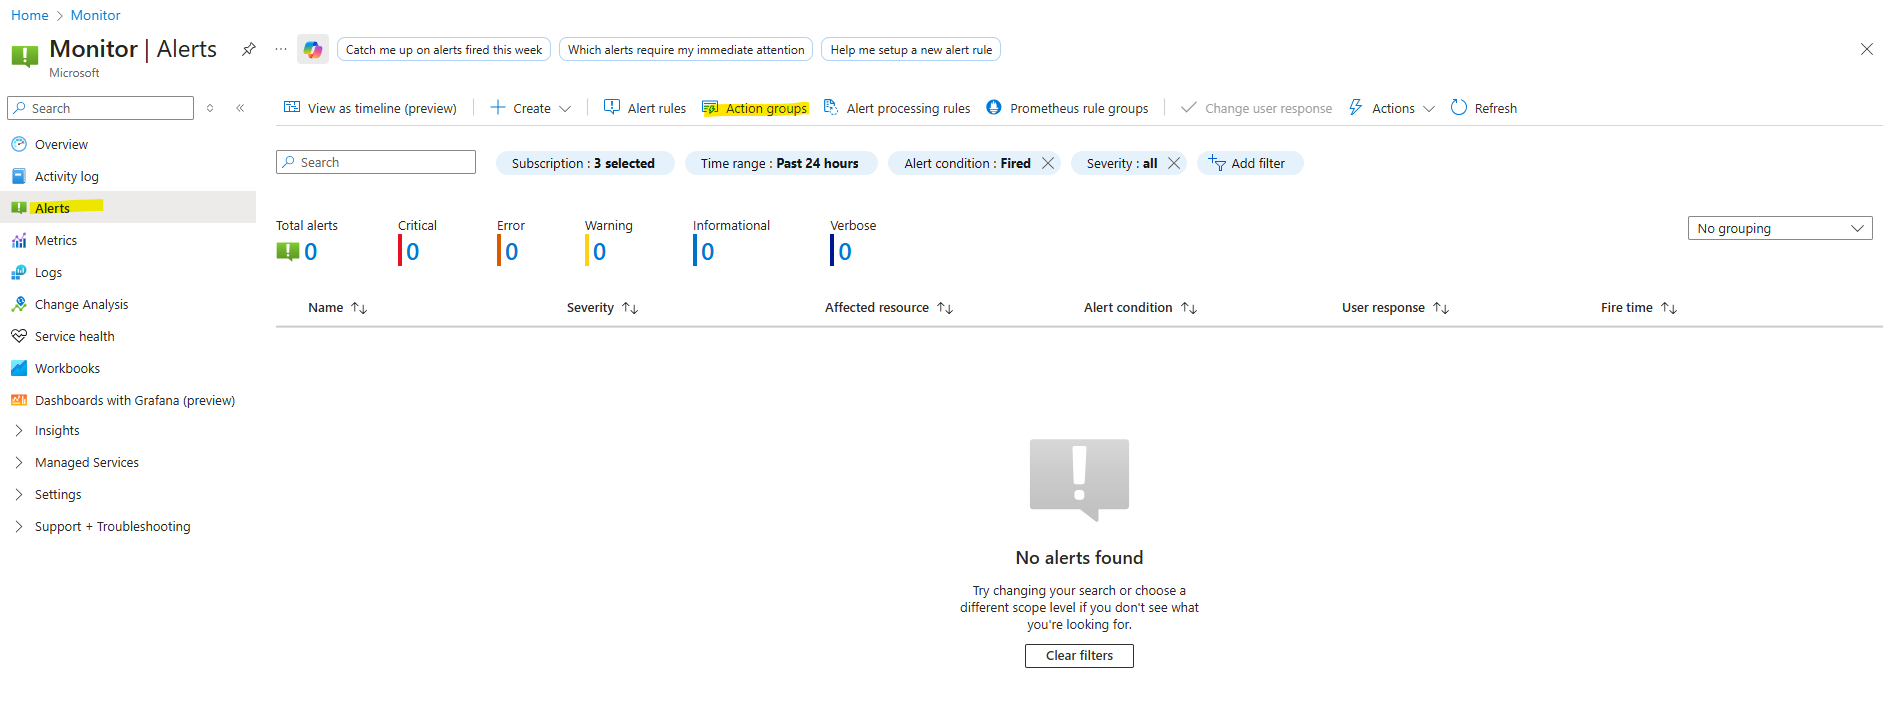
Here we can edit the action group and changing the email recipient.
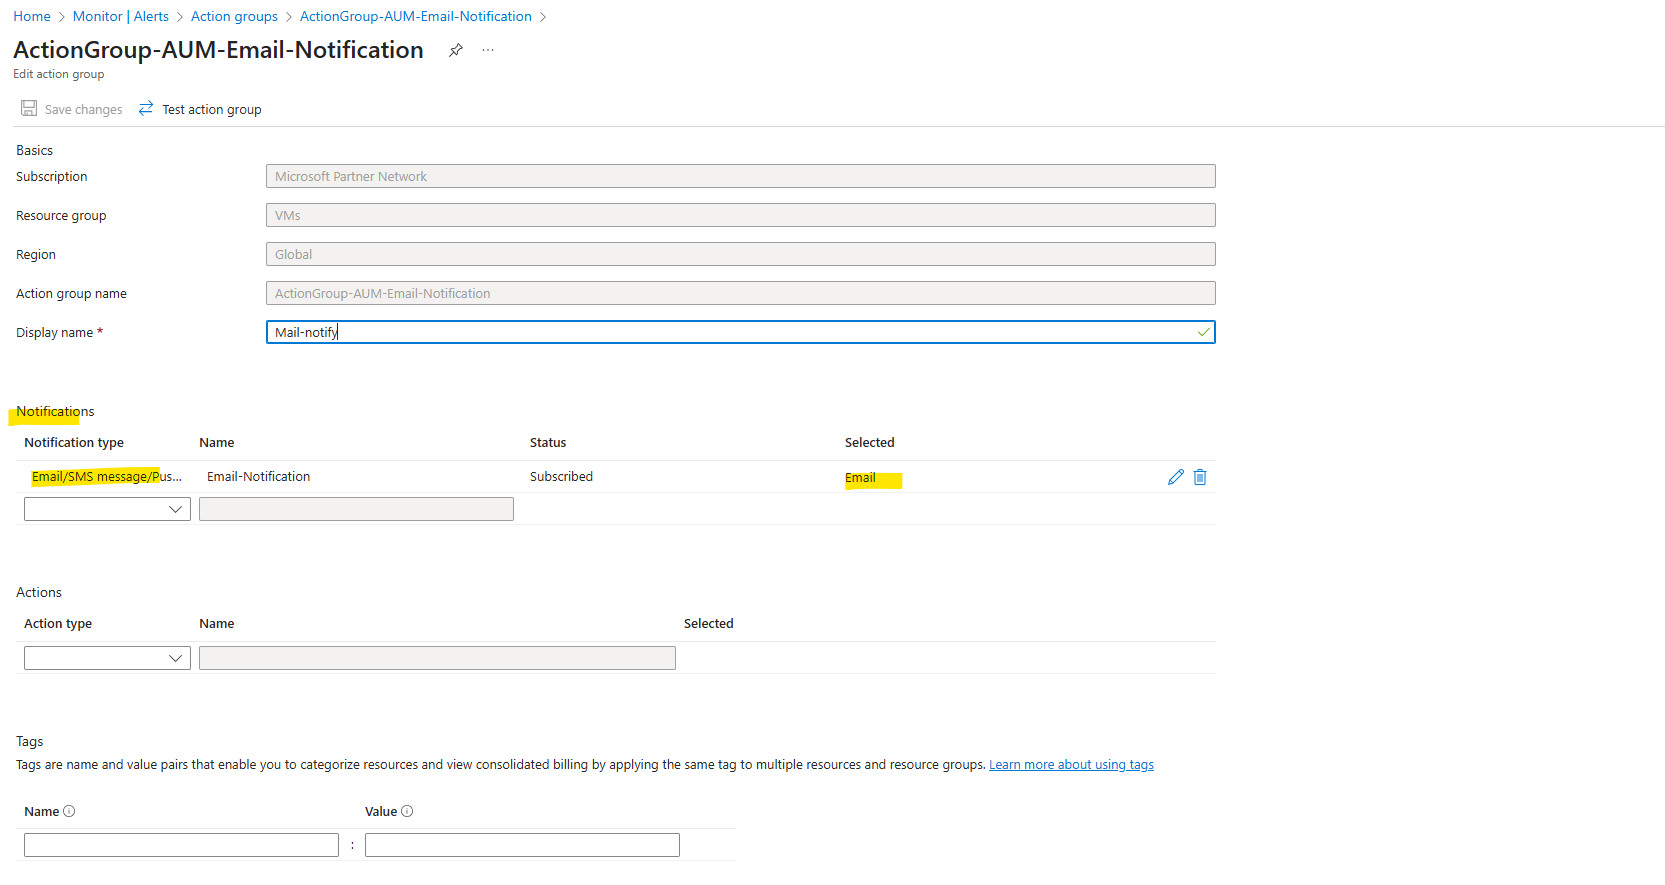
The use of Azure Monitor action groups we will also see in my post about monitoring scheduled events for Azure virtual machines.
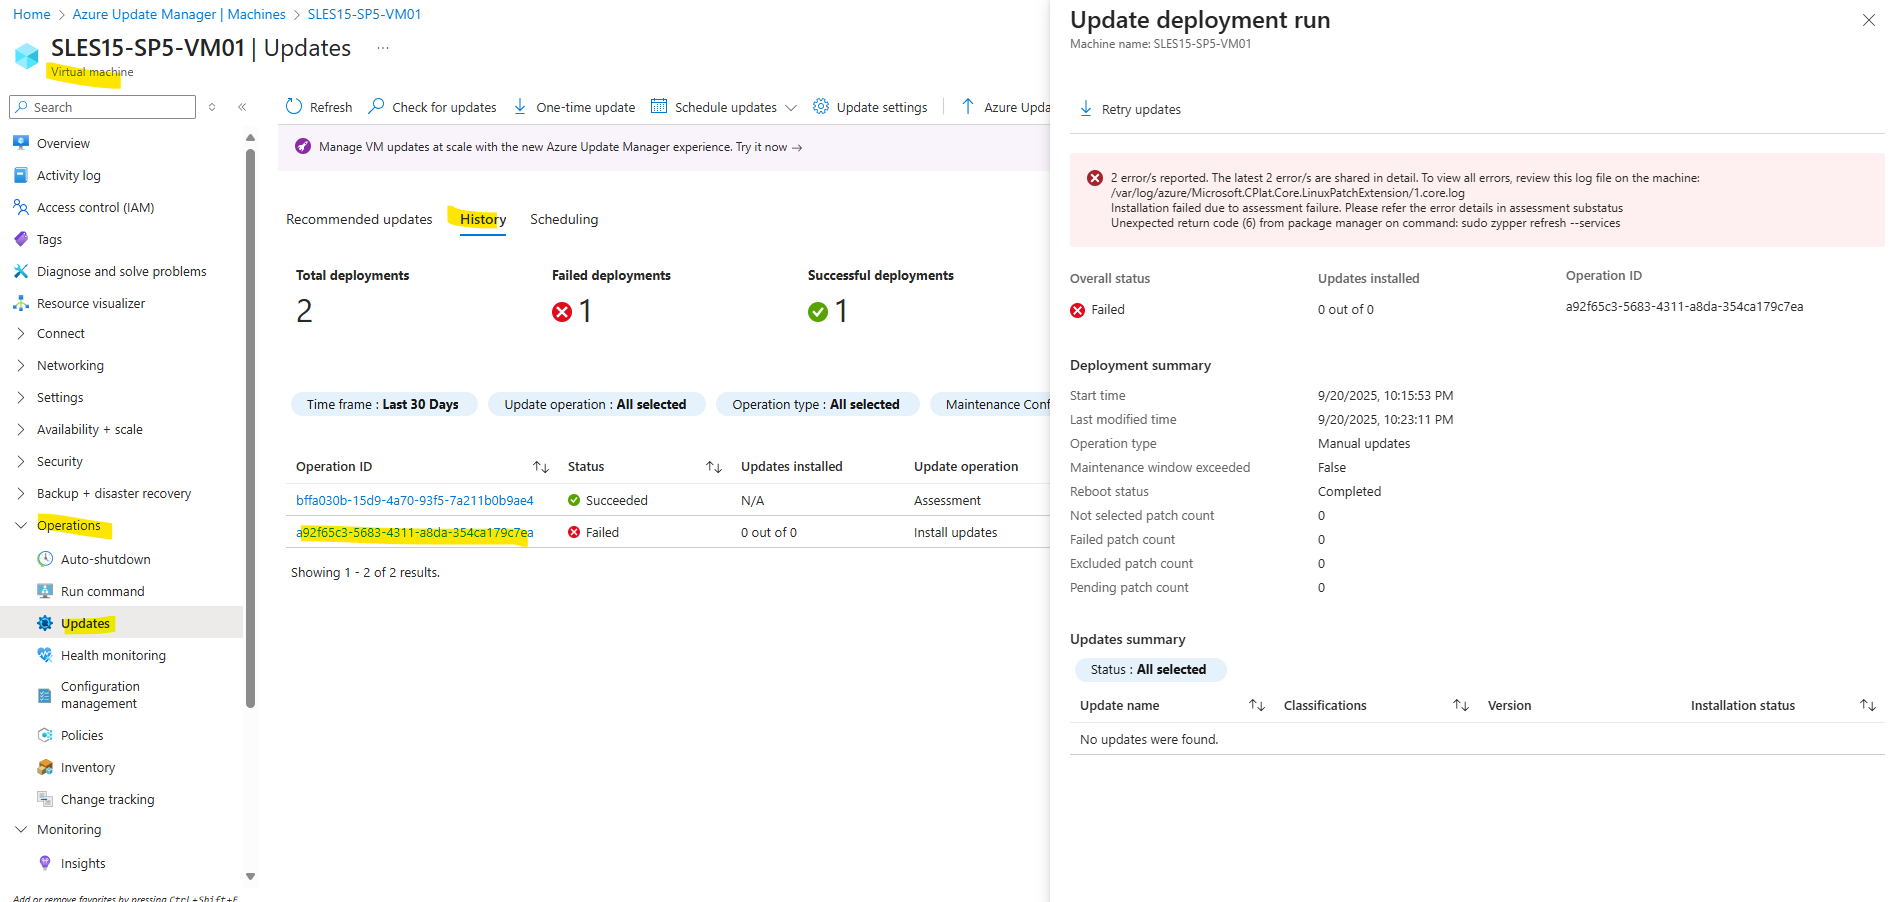
To demonstrate Azure Update Manager alerts, I was using a SUSE SLES 15 VM on which no repositories were configured, therefore the sudo zypper refresh command when updates will be triggered by Azure Update Manager, finally will fail and we can use this patch installation failure to test if an alert is fired successful.
Looks good an the alert is fired all 5 minutes (just for testing purpose).
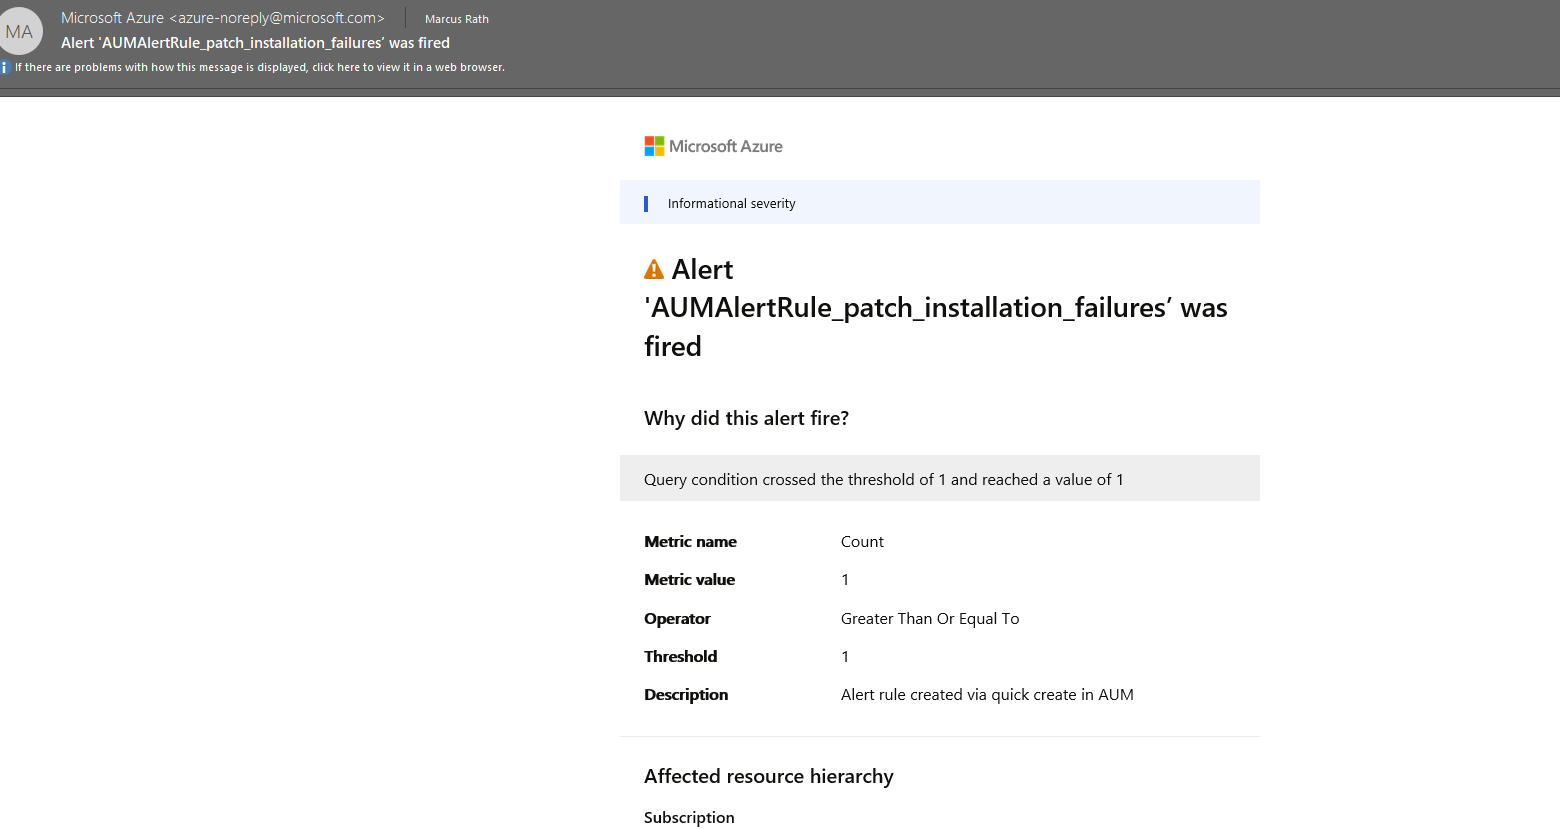
Also an email is sent as configured by using the action group.
I was changing the frequency of evaluation from 1 hour to 5 minutes to immediately fire the alerts for demonstration purpose.
As mentioned for production use we may want to set this to just run once per day.
Creating custom Azure Update Alert Rules
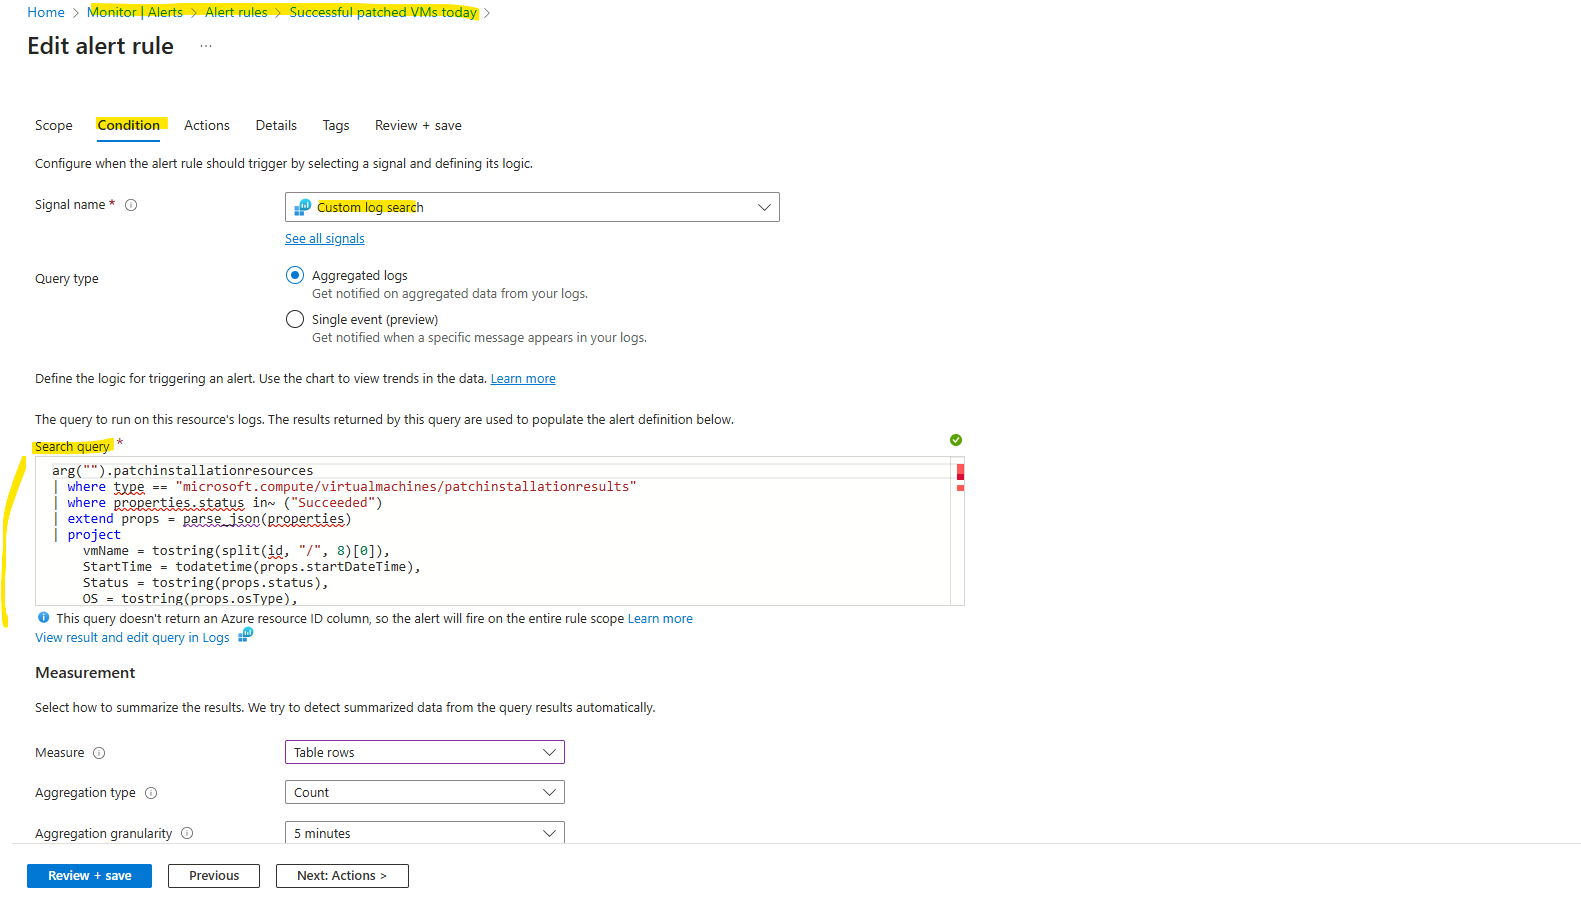
Below I will creating just for demonstration purpose a new custom alert rule. This alert rule will use the following query below.
The query returns all successful patch installation runs for Azure VMs for the current day. Each row shows the VM name, start time, patch counts (installed, failed, pending, etc.), reboot requirements, OS type, and any error messages.
arg("").patchinstallationresources
| where type == "microsoft.compute/virtualmachines/patchinstallationresults"
| where properties.status in~ ("Succeeded")
| extend props = parse_json(properties)
| project
    vmName = tostring(split(id, "/", 8)[0]),
    StartTime = todatetime(props.startDateTime),
    Status = tostring(props.status),
    OS = tostring(props.osType),
    RebootStatus = tostring(props.rebootStatus),
    Installed = toint(props.installedPatchCount),
    Failed = toint(props.failedPatchCount),
    Pending = toint(props.pendingPatchCount),
    Excluded = toint(props.excludedPatchCount),
    NotSelected = toint(props.notSelectedPatchCount),
    ErrorMessage = tostring(props.errorDetails.message),
    ErrorCode = tostring(props.errorDetails.code)
| where StartTime >= startofday(now())
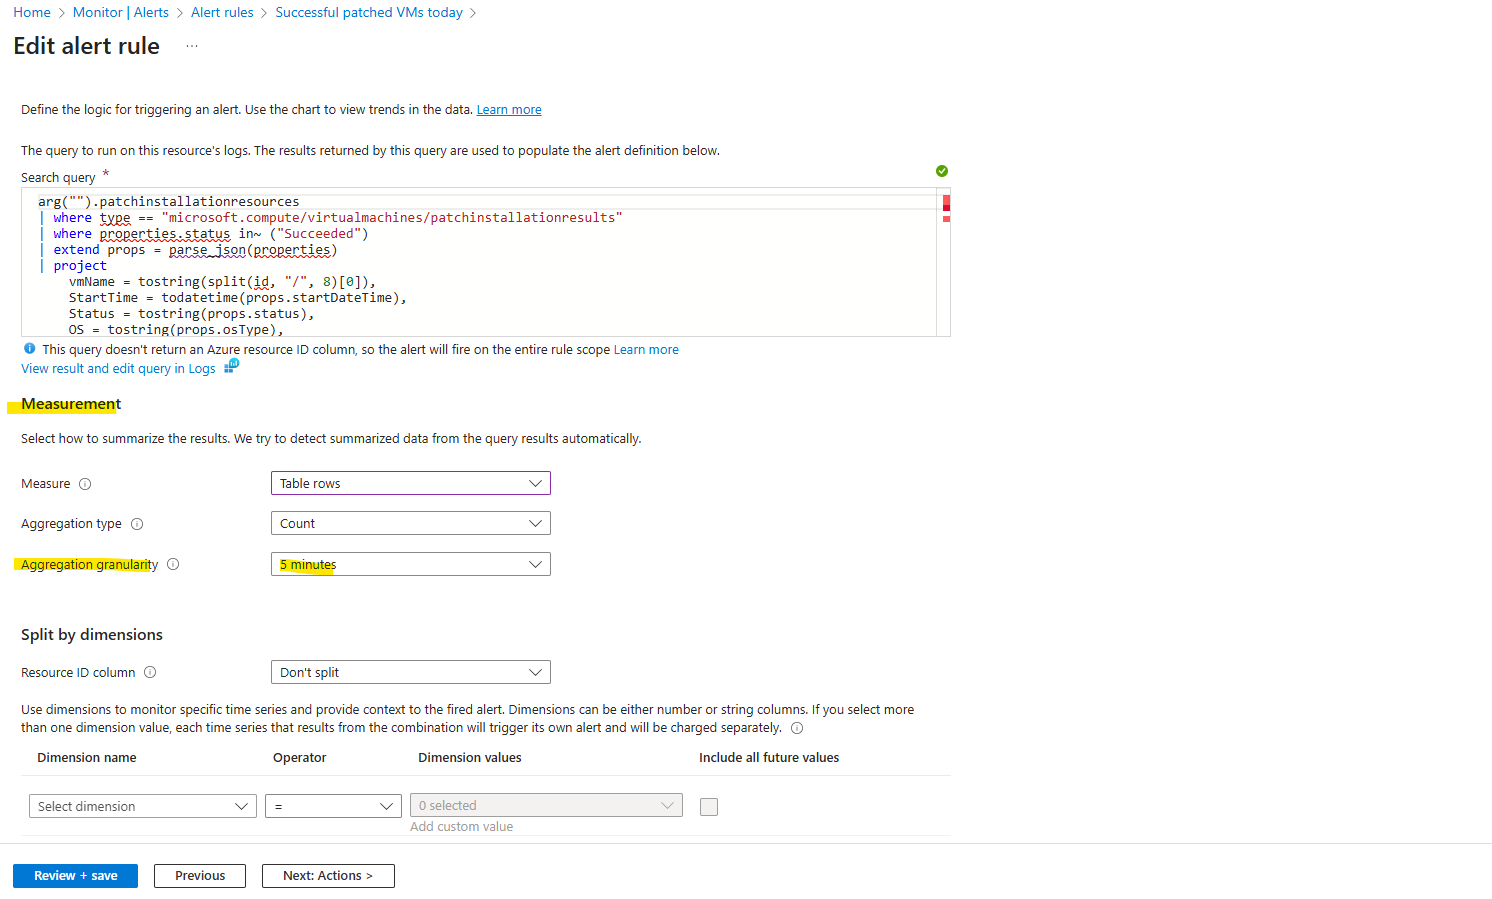
As already mentioned for the default pre-defined patch installation failure query above, the aggregation granularity setting below with 5 minutes by default is also here effectively ignored because the query’s | where StartTime >= startofday(now()) clause returns a single, cumulative count over the entire actual day period.
Aggregation granularity only becomes relevant when the query itself uses functions like bin() to group data into smaller time windows, allowing the alert rule to check for a condition (e.g., a count >=1) on each of those individual time bins rather than on the total period.
Measure options:
Count -> Takes the value inside the numeric column(s) in our query result and evaluates them.
Table rows -> Looks only at the number of rows returned by our query, not at the values inside like for Count. Usually Table rows as the measure → only makes sense if the query actually returns multiple rows.
Frequency of evaluation → evaluationFrequency
How often the query is executed. Here run the query every 5 minutes.
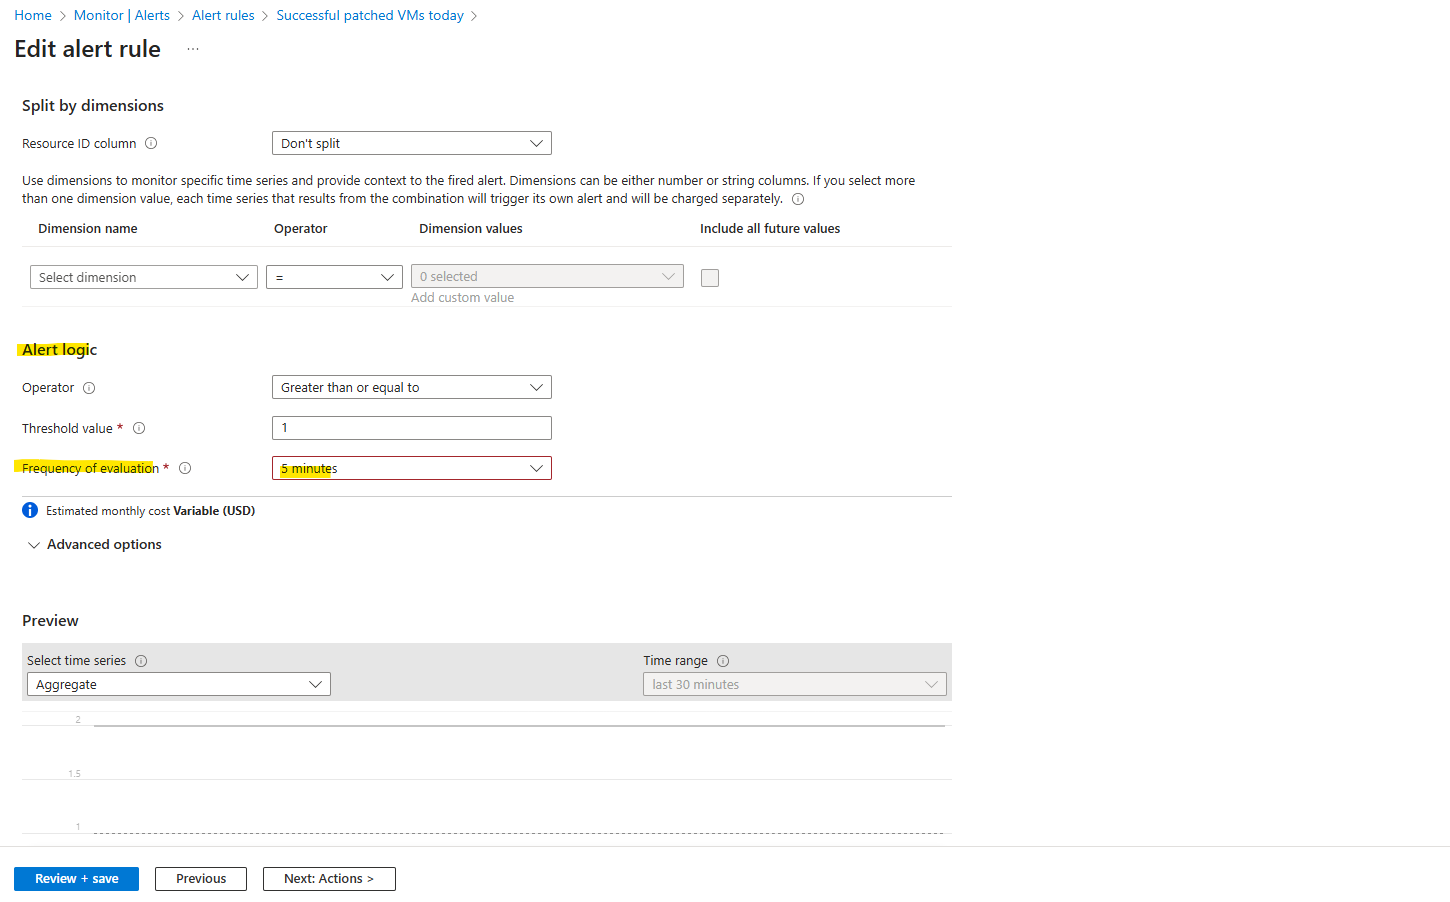
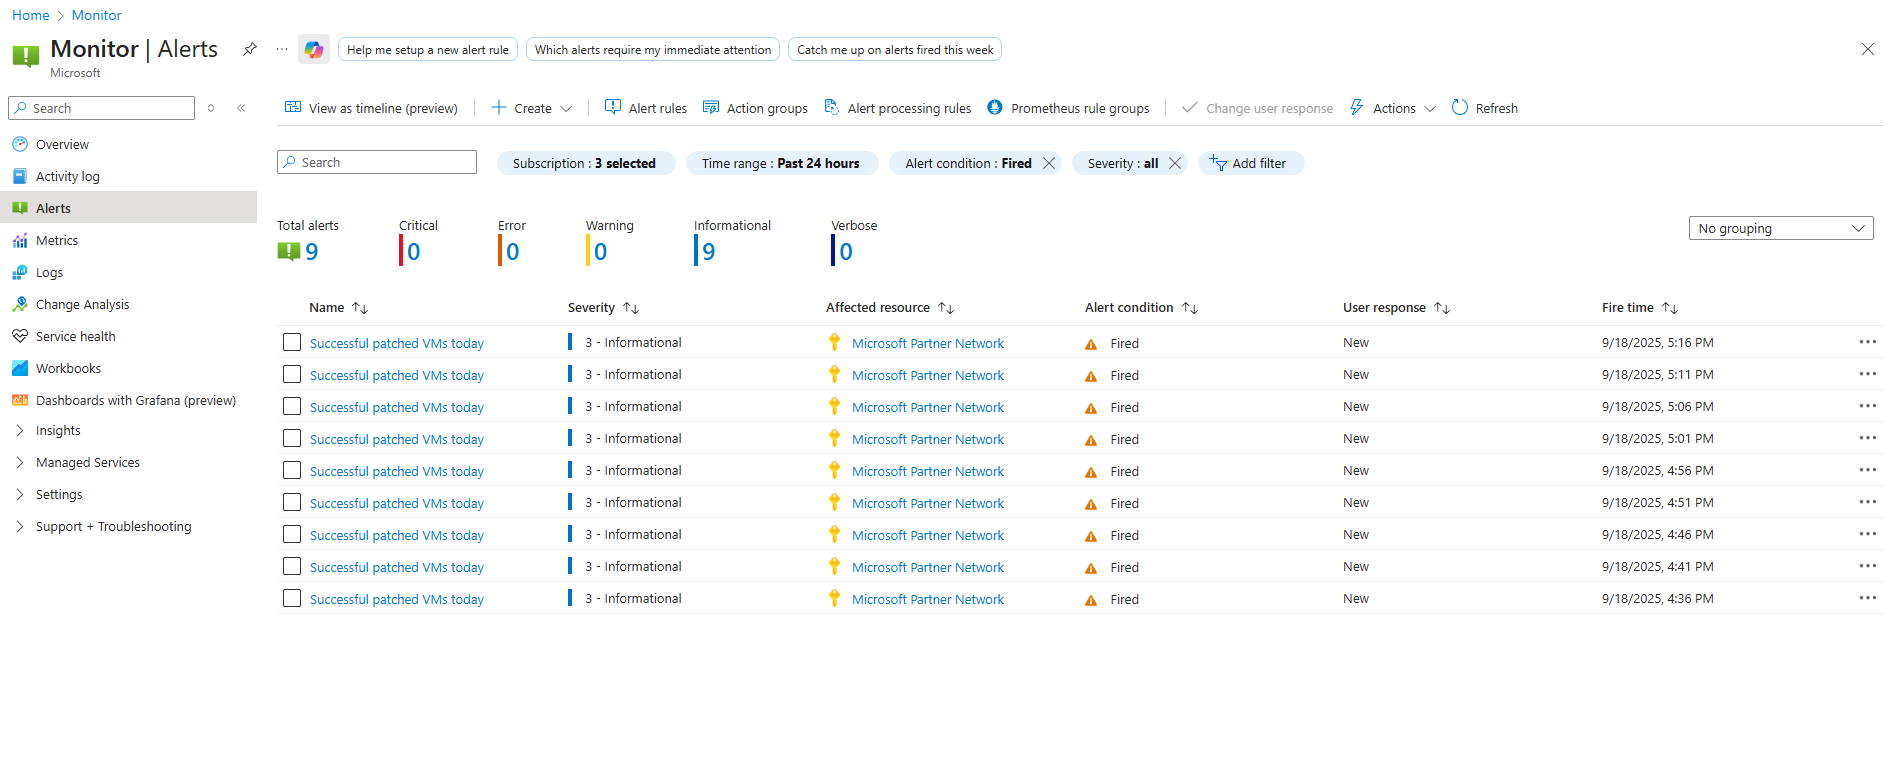
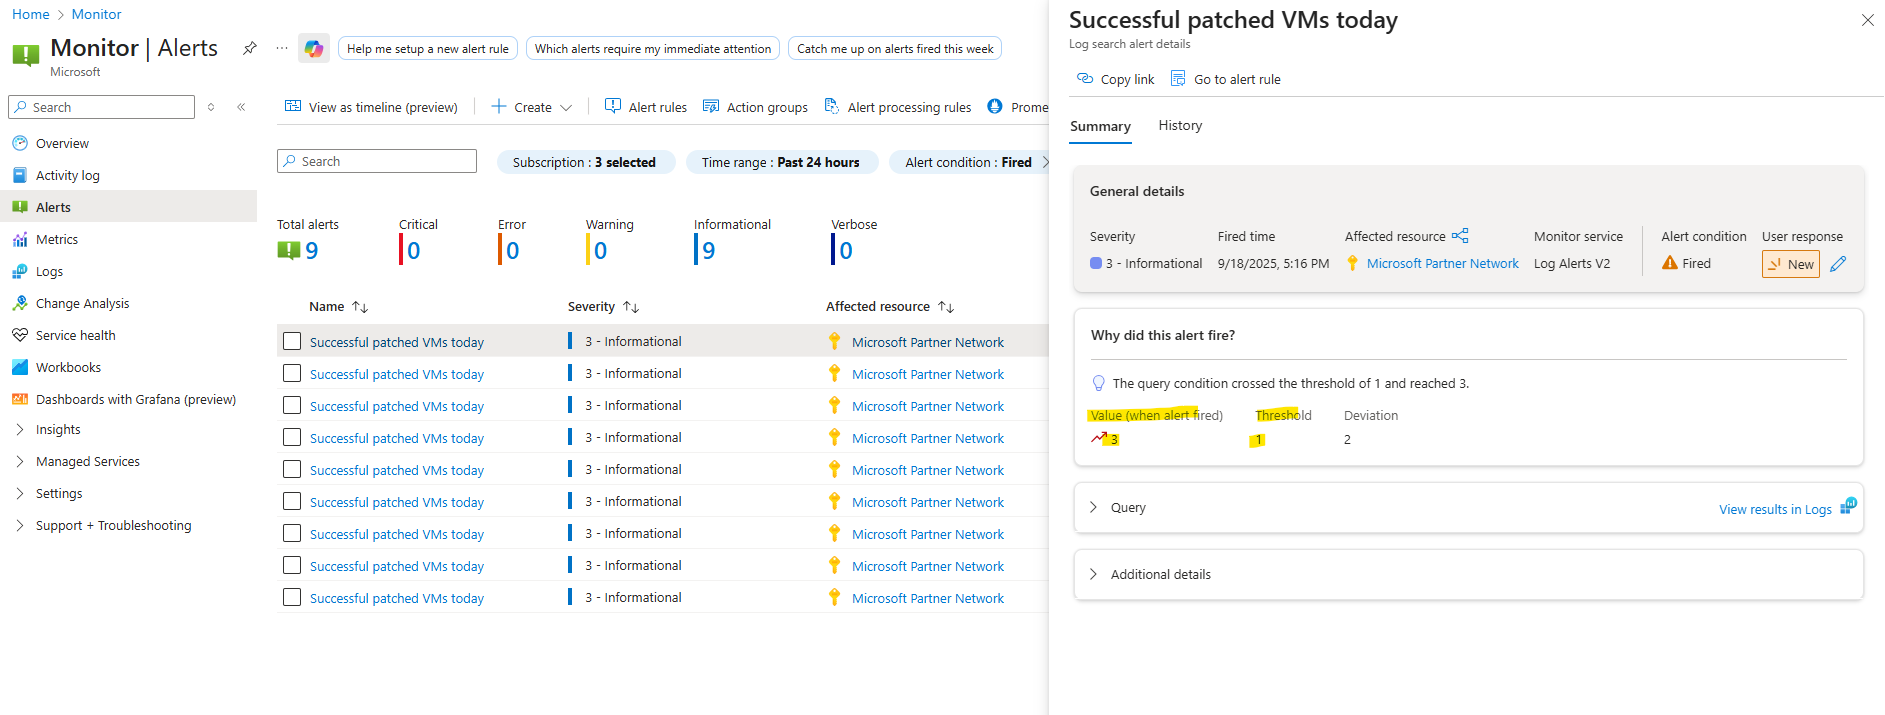
Now every 5 minutes the alert will be fired because its threshold with >= 1 for the returned results will be always 3 because on this current day 3 virtual machines were patched successfully.
For the alert rule configuration I was configuring an action group which will send each time the alert is fired also an email to me which look like this.
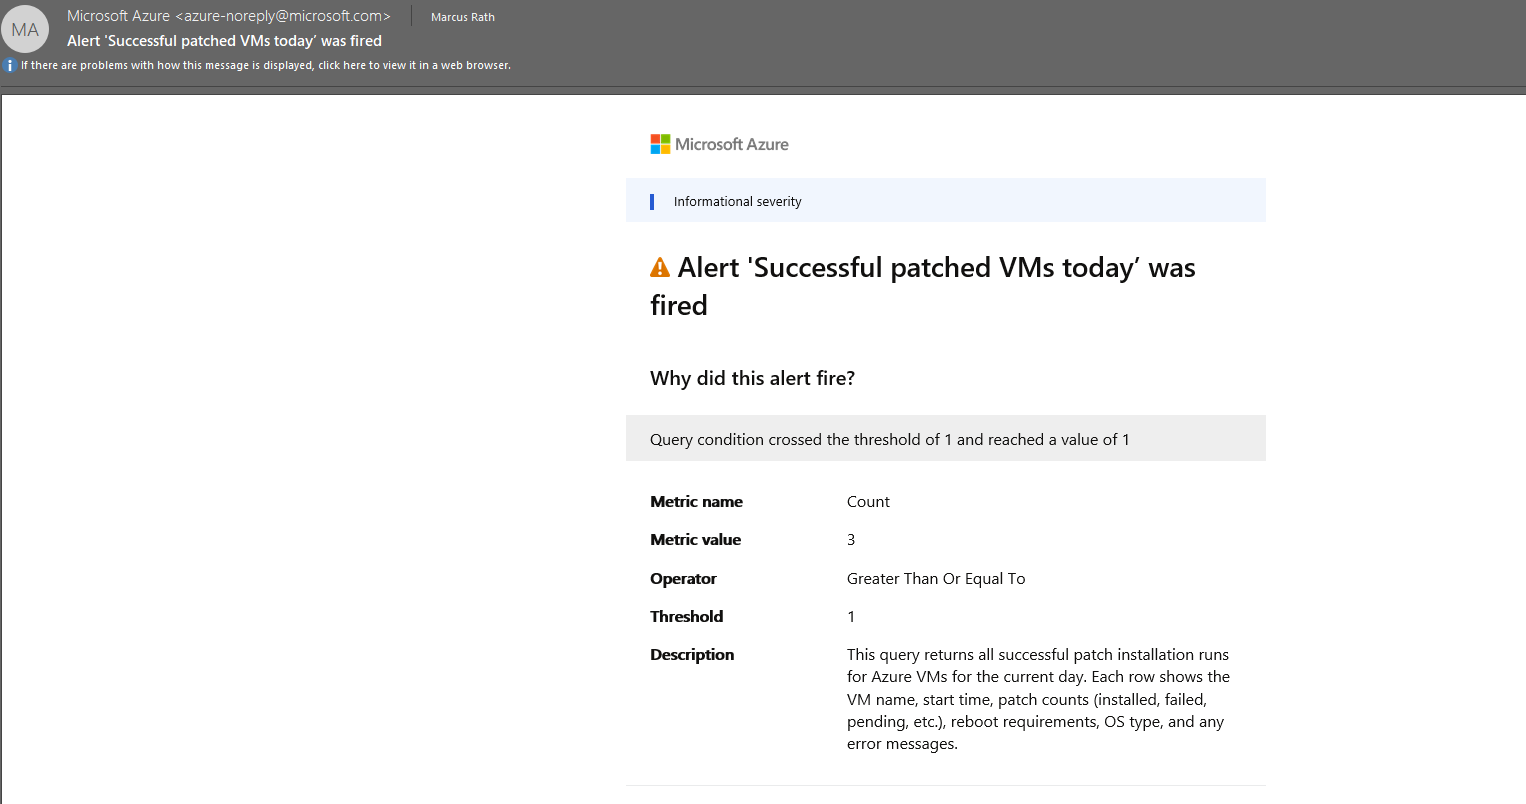
In the email notification by default, the actual query results (rows/columns) are not embedded in the email. You just get notified that the condition was breached.
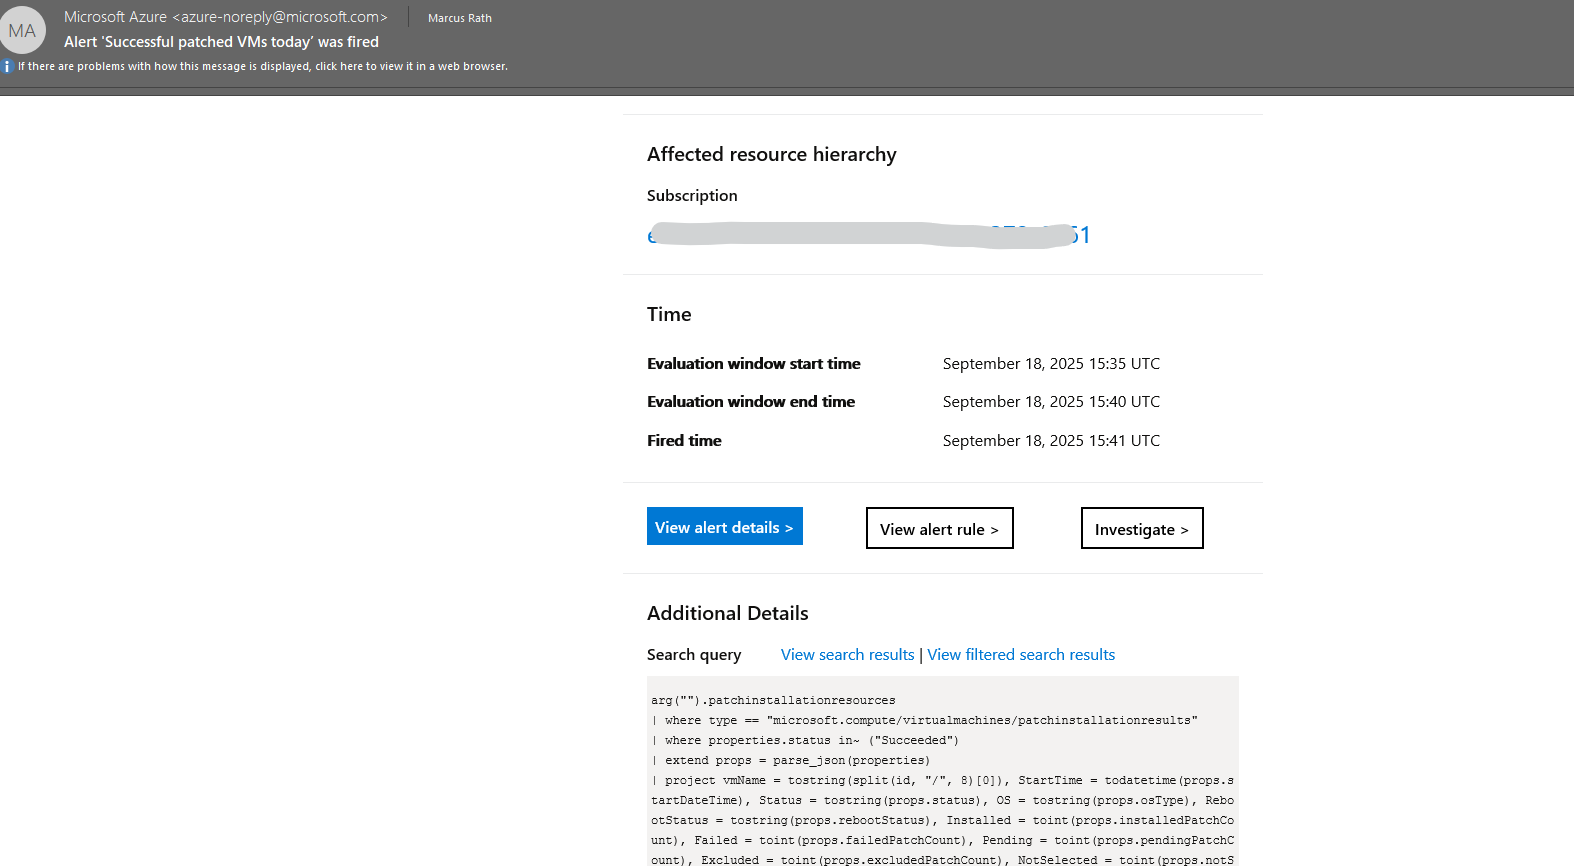
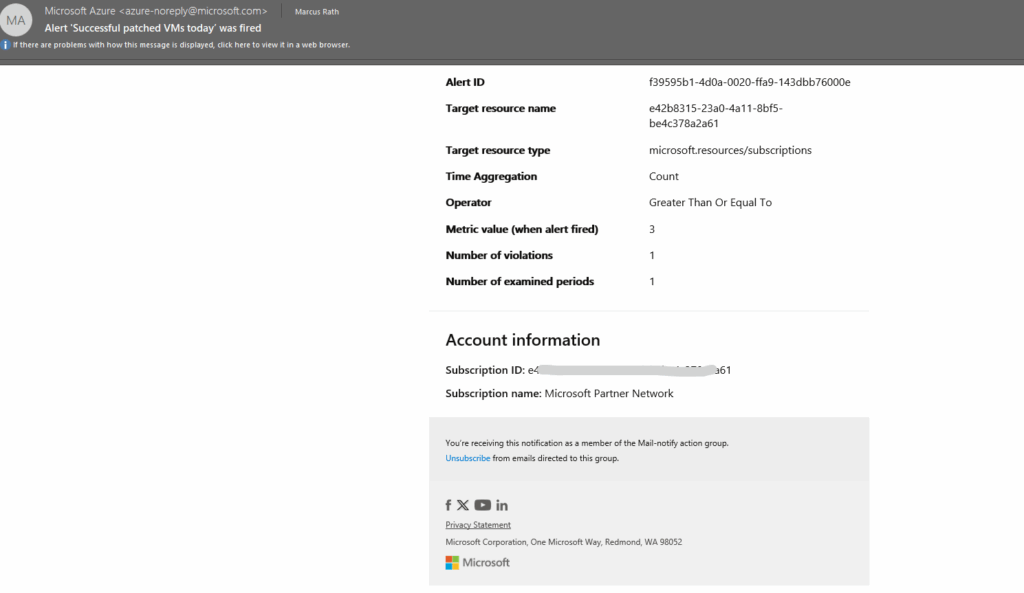
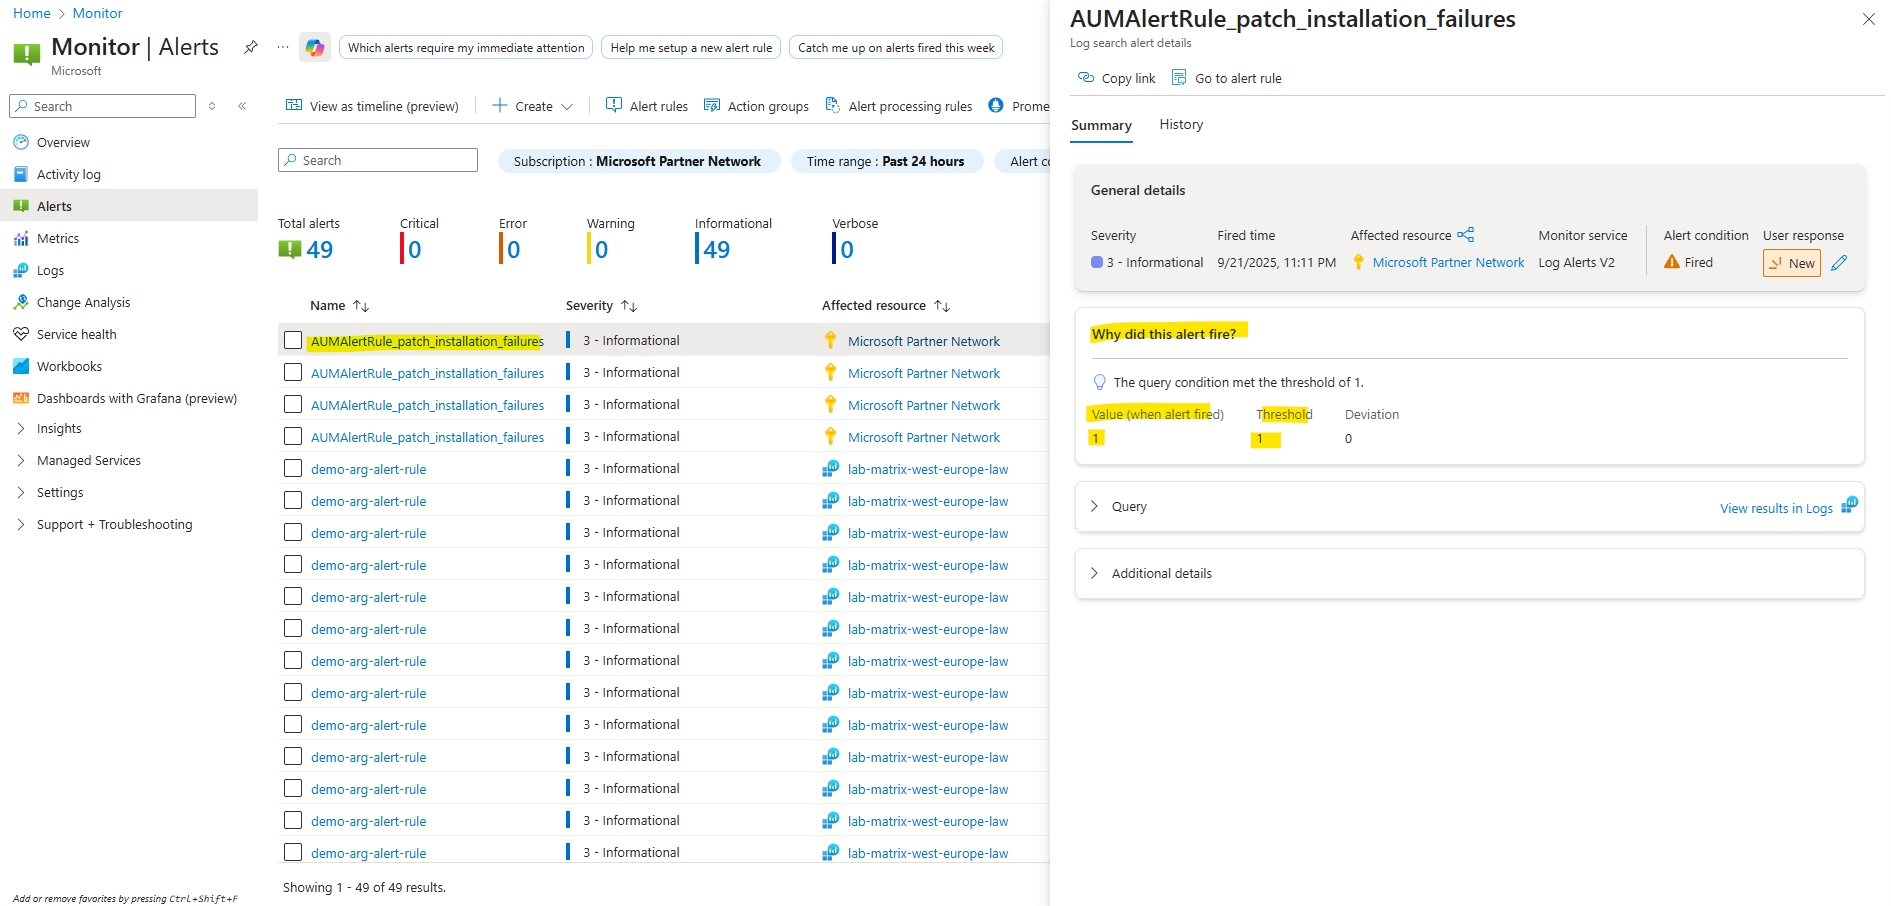
When clicking on the alert we will see the details.
Using the Azure Resource Graph Explorer therefore.
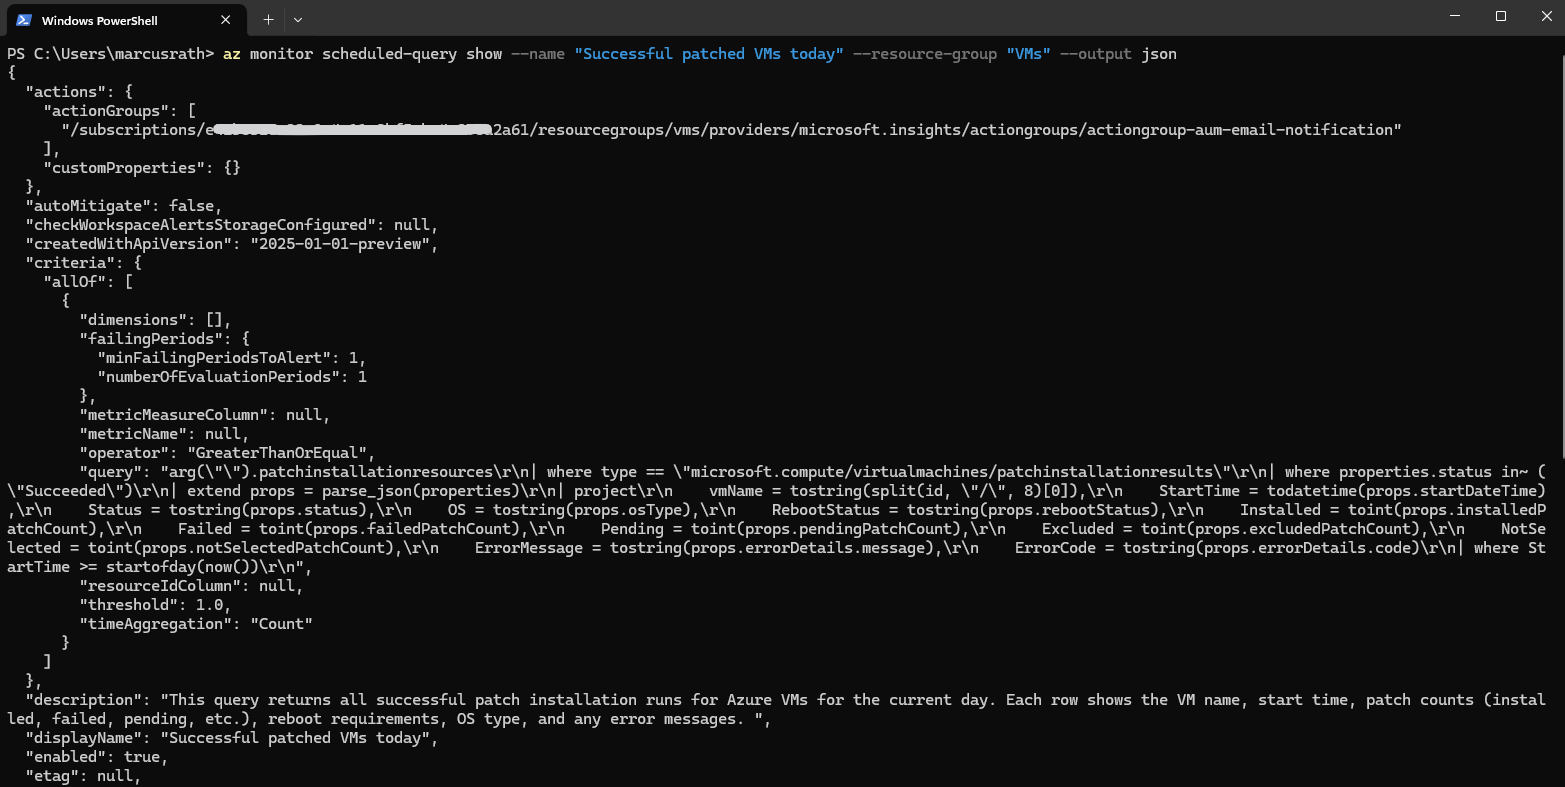
We can also export the full alert rule definition for further analyzing by running.
PS> az monitor scheduled-query show --name "Successful patched VMs today" --resource-group "VMs" --output json

# Export into file
PS> az monitor scheduled-query show --name "Successful patched VMs today" --resource-group "VMs" --output json > .\Downloads\alert.json
Azure Resource Graph
Resource Graph provides several tables for the data it stores about Azure Resource Manager resource types and their properties.
Resource Graph tables can be used with the join operator to get properties from related resource types.
Source: https://learn.microsoft.com/en-us/azure/governance/resource-graph/concepts/query-language
A list of all available tables in Resource Graph you will find here https://learn.microsoft.com/en-us/azure/governance/resource-graph/concepts/query-language.
Azure Resource Graph table and resource type reference
https://learn.microsoft.com/en-us/azure/governance/resource-graph/reference/supported-tables-resources
Azure Resource Graph (ARG) is a powerful query engine in Azure that lets you explore and analyze resources at scale across subscriptions and management groups.
Instead of relying on manual searches or individual portal views, ARG uses a fast, read-only version of the Azure Resource Manager (ARM) data to provide near real-time inventory and governance insights.
With its Kusto Query Language (KQL) support, you can quickly filter, group, and visualize resource information, making it an essential tool for security, compliance, and operational reporting in large Azure environments.
Azure Resource Manager currently supports queries over basic resource fields, specifically:
- Resource name
- ID
- Type
- Resource Group
- Subscription
- Location
It’s important to understand that Azure Resource Graph’s query language is based on the Kusto Query Language (KQL) used by Azure Data Explorer.
First, for details on operations and functions that can be used with Azure Resource Graph, see Resource Graph query language. To browse resources, see explore resources.
More about you will find here https://learn.microsoft.com/en-us/azure/governance/resource-graph/overview.
Azure Resource Graph (ARG) tables in context of Azure Update Manager
Azure Update Manager uses the following ARG tables to publish the results of patch assessments and patch installations.
- patchassessmentresources ==> pending/missing update assessment results (includes summary rows and per-update rows via …/softwarepatches). Retention: 7 days
- patchinstallationresources ==>update installation results (includes summary rows and per-update rows via …/softwarepatches). Retention: 30 days
- maintenanceresources ==> maintenance schedule/run data and assignments (types like microsoft.maintenance/applyupdates and microsoft.maintenance/configurationassignments).
Azure Resource Graph table and resource type reference
https://learn.microsoft.com/en-us/azure/governance/resource-graph/reference/supported-tables-resources
Custom Queries in Azure Resource Graph (ARG)
Azure Resource Graph (ARG) queries (patchinstallationresources table, etc.) run against the control plane snapshot data.
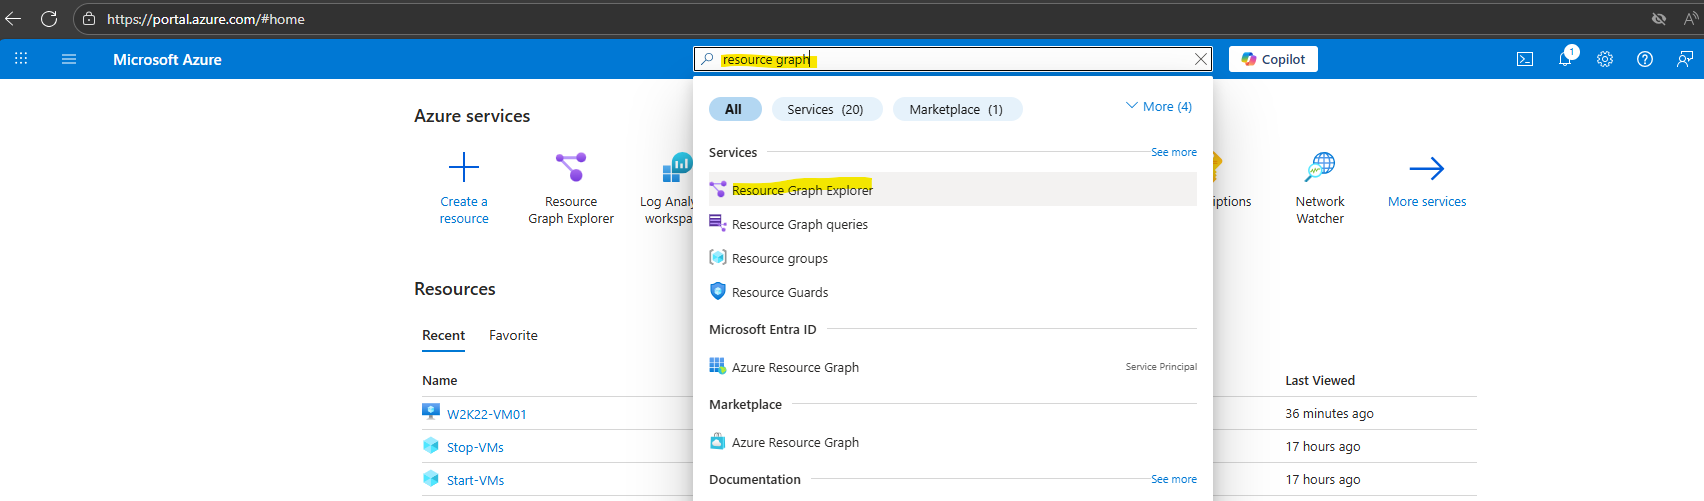
Open the Azure Resource Graph Explorer.
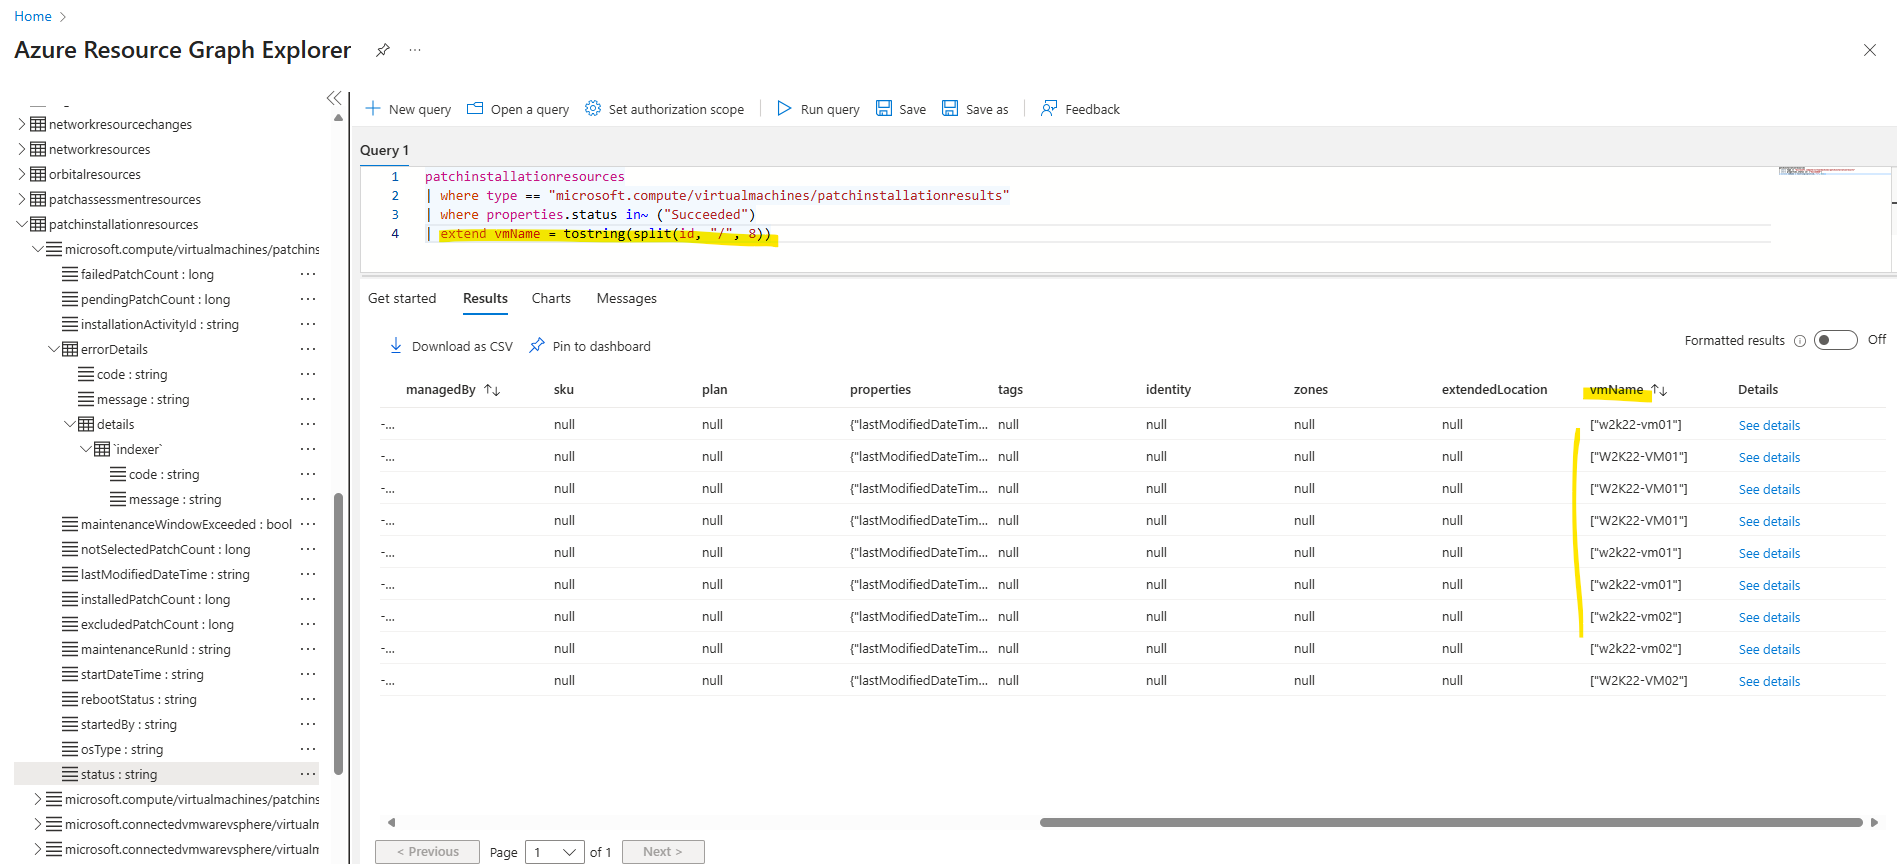
The VM name is always part of the 8th segment of the id string (split by /).
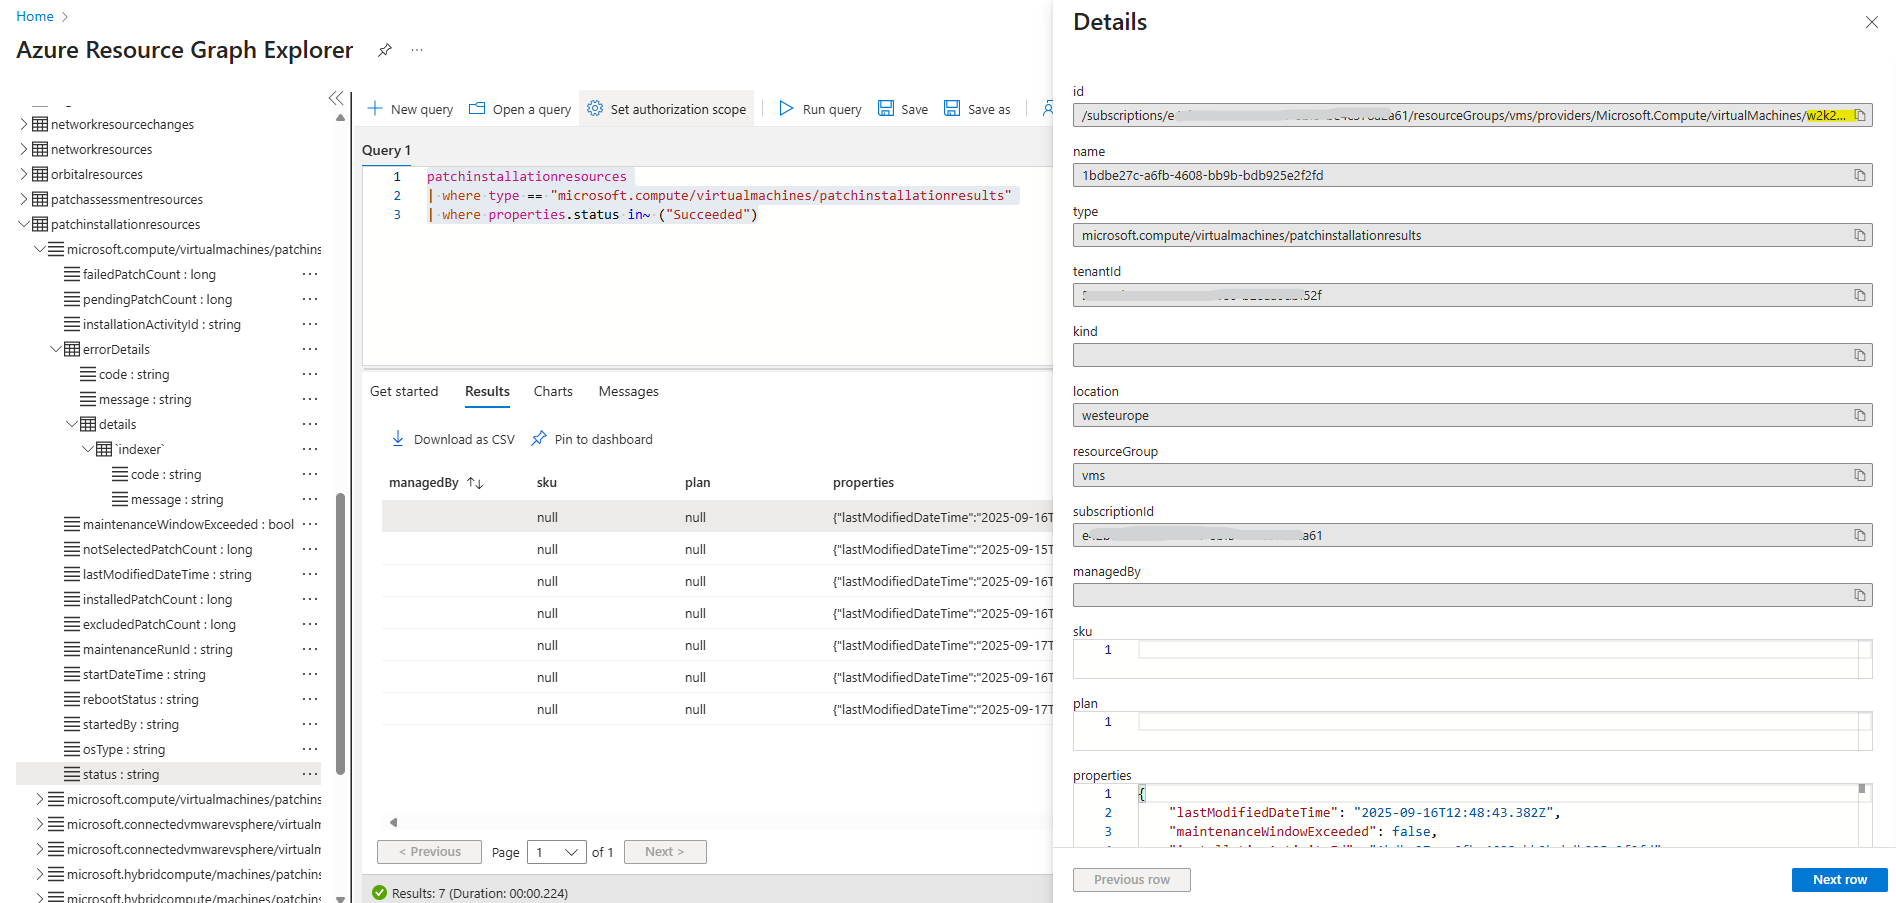
patchinstallationresources
| extend vmName = tostring(split(id, "/", 8))
The extend operator added new calculated columns or transforms existing ones and keeps all existing columns plus the new ones.
The following properties JSON blob is where all the useful details live. In ARG/KQL you need to parse it first, then pull out individual fields.
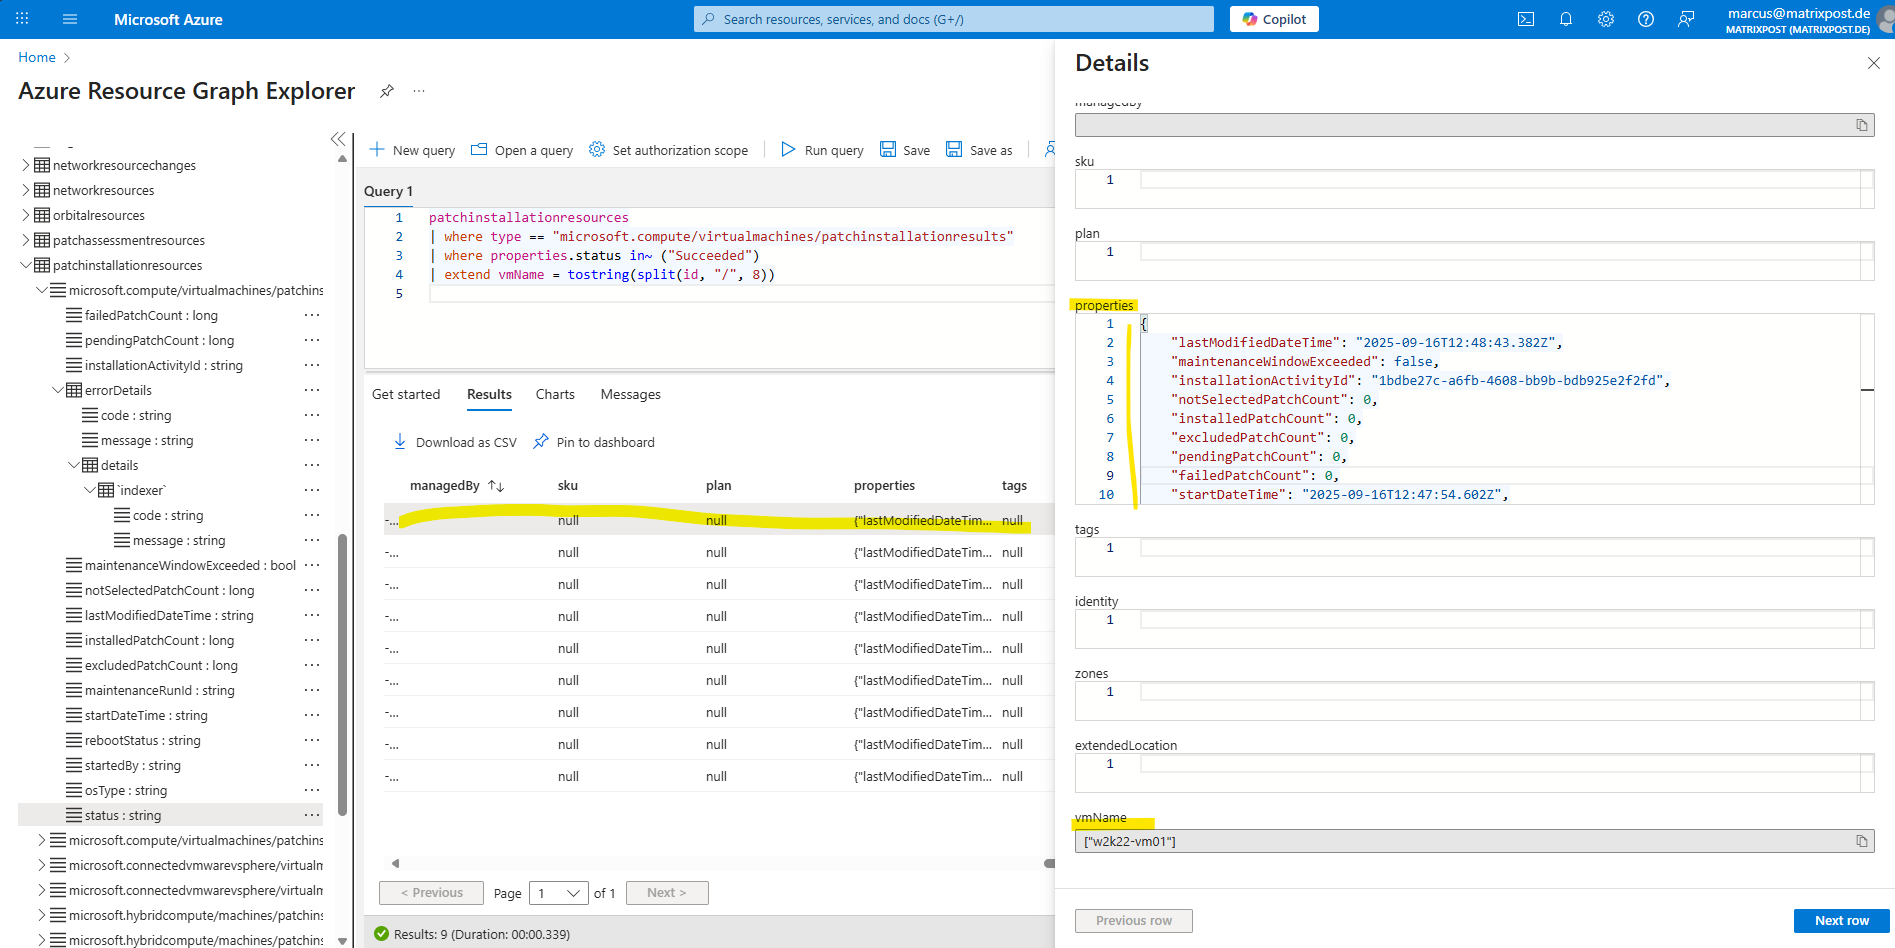
We can parse the properties JSON blob with the following expression.
| extend props = parse_json(properties)
Then to pull out separate properties like the OS type, we can use:
OS = tostring(props.osType)
Here the complete query.
patchinstallationresources
| where type == "microsoft.compute/virtualmachines/patchinstallationresults"
| where properties.status in~ ("Succeeded")
| extend props = parse_json(properties)
| project
vmName = tostring(split(id, "/", 8)[0]),
StartTime = todatetime(props.startDateTime),
Status = tostring(props.status),
OS = tostring(props.osType),
RebootStatus = tostring(props.rebootStatus),
Installed = toint(props.installedPatchCount),
Failed = toint(props.failedPatchCount),
Pending = toint(props.pendingPatchCount),
Excluded = toint(props.excludedPatchCount),
NotSelected = toint(props.notSelectedPatchCount),
ErrorMessage = tostring(props.errorDetails.message),
ErrorCode = tostring(props.errorDetails.code)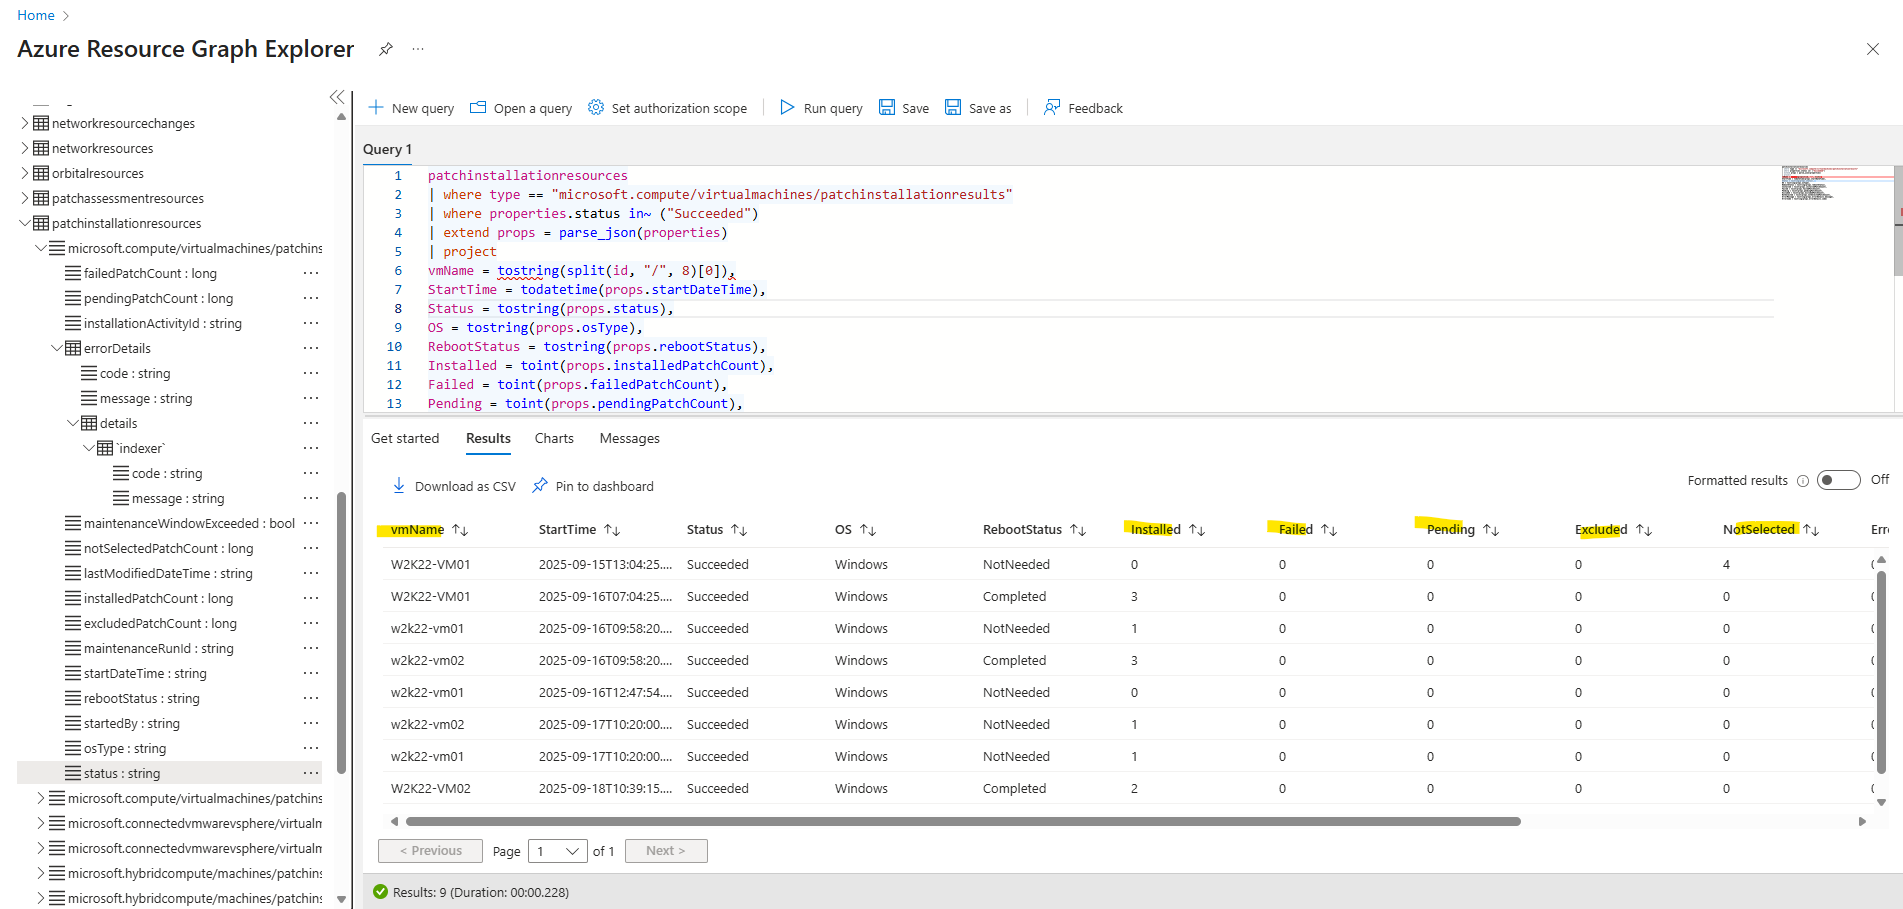
Further a crucial property is properties.status, this field in Azure Update Manager ARG tables (here patchinstallationresources) can take several values depending on the patch run outcome.
properties.status is the top-level outcome flag for a patch installation run in Azure Update Manager. It reflects the overall state of the run, independent of how many individual patches were installed, skipped, or failed.
This property is especially useful in queries and alert rules because it allows you to quickly filter for successful (“Succeeded“) or problematic runs (“Failed“, “CompletedWithWarnings“).
Possible values include:
- Succeeded – All selected updates were installed successfully.
- Failed – The run failed to complete (for example, update installation error, agent issue, VM unreachable).
- CompletedWithWarnings – The run finished, but some updates failed, were skipped, or excluded.
- InProgress – The patch run is currently running.
- Pending – The patch run is scheduled but has not started yet.
- Cancelled – The run was cancelled before completion.
- Unknown – The result could not be determined (rare, usually transient reporting issues).
// filter for just one state, here Succeeded
| where properties.status in~ ("Succeeded")

// filter for multiple states
| where properties.status in~ ("Succeeded", "Failed", "CompletedWithWarnings")

// Exclude in-progress or pending runs → Quick way to highlight problems.
| where properties.status !in~ ("InProgress", "Pending")

// Catch everything except success
| where properties.status !in~ ("Succeeded")
Further we can also filter for the rebootStatus property.
Possible values include:
- NotNeeded → No reboot required after the patch run.
- Required → A reboot is needed to complete installation.
- Started → The reboot has been initiated.
- Failed → The reboot attempt failed.
- Unknown → Reboot status could not be determined.
// Runs where a reboot is required
| where properties.rebootStatus in~ ("Required")

// Runs that did not require a reboot
| where properties.rebootStatus in~ ("NotNeeded")

// Problematic reboot outcomes
| where properties.rebootStatus in~ ("Failed", "Unknown")

// All completed reboot states
| where properties.rebootStatus in~ ("NotNeeded", "Required", "Started", "Failed")
To just return results with a specific StartTime we can for example filter by using the where operator. The following first operator will just return results where the StartTime is the current day.
// pull out the StartTime property
StartTime = todatetime(props.startDateTime)


// current day
| where StartTime >= startofday(now())


// More examples to filter for StartTime

// Since a specific hour today (e.g. 12:00 UTC), adjust offset if you want local time instead of UTC.
| where StartTime >= datetime_add("hour", 12, startofday(now()))

// Last 24 hours (rolling window)
| where StartTime > ago(24h)

// Last 30 minutes
| where StartTime > ago(30m)

// Last 7 days
| where StartTime > ago(7d)

// Between two specific times
// In KQL / ARG, the datetime literal format is always ISO 8601–style, not locale-dependent.
// 18:00:00Z = 6:00 PM UTC. This is the expected format — YYYY-MM-DD HH:MM:SSZ.
| where StartTime between (datetime(2025-09-11 00:00:00Z) .. datetime(2025-09-14 18:00:00Z))

// Current week (since Monday)
| where StartTime >= startofweek(now())

// Current month
| where StartTime >= startofmonth(now())
A complete query will looks like below.
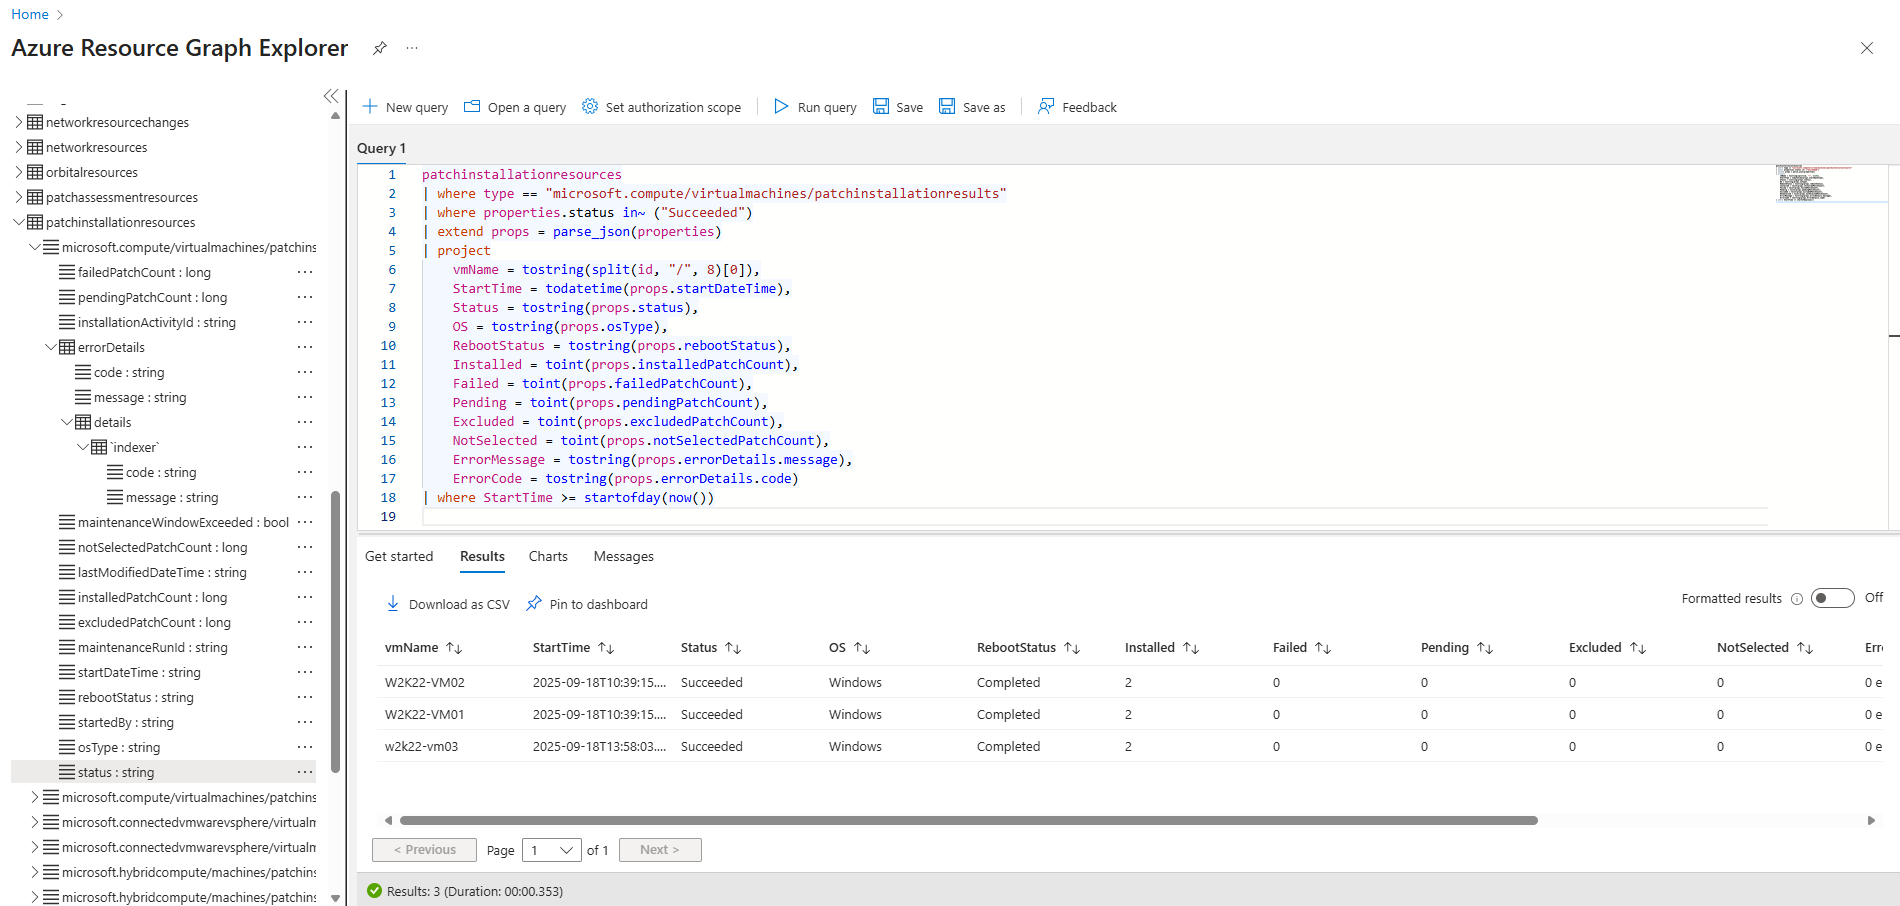
This query returns all successful patch installation runs for Azure VMs for the current day. Each row shows the VM name, start time, patch counts (installed, failed, pending, etc.), reboot requirements, OS type, and any error messages.
It’s a convenient way to validate which machines patched cleanly today.
patchinstallationresources
| where type == "microsoft.compute/virtualmachines/patchinstallationresults"
| where properties.status in~ ("Succeeded")
| extend props = parse_json(properties)
| project
vmName = tostring(split(id, "/", 8)[0]),
StartTime = todatetime(props.startDateTime),
Status = tostring(props.status),
OS = tostring(props.osType),
RebootStatus = tostring(props.rebootStatus),
Installed = toint(props.installedPatchCount),
Failed = toint(props.failedPatchCount),
Pending = toint(props.pendingPatchCount),
Excluded = toint(props.excludedPatchCount),
NotSelected = toint(props.notSelectedPatchCount),
ErrorMessage = tostring(props.errorDetails.message),
ErrorCode = tostring(props.errorDetails.code)
| where StartTime >= startofday(now())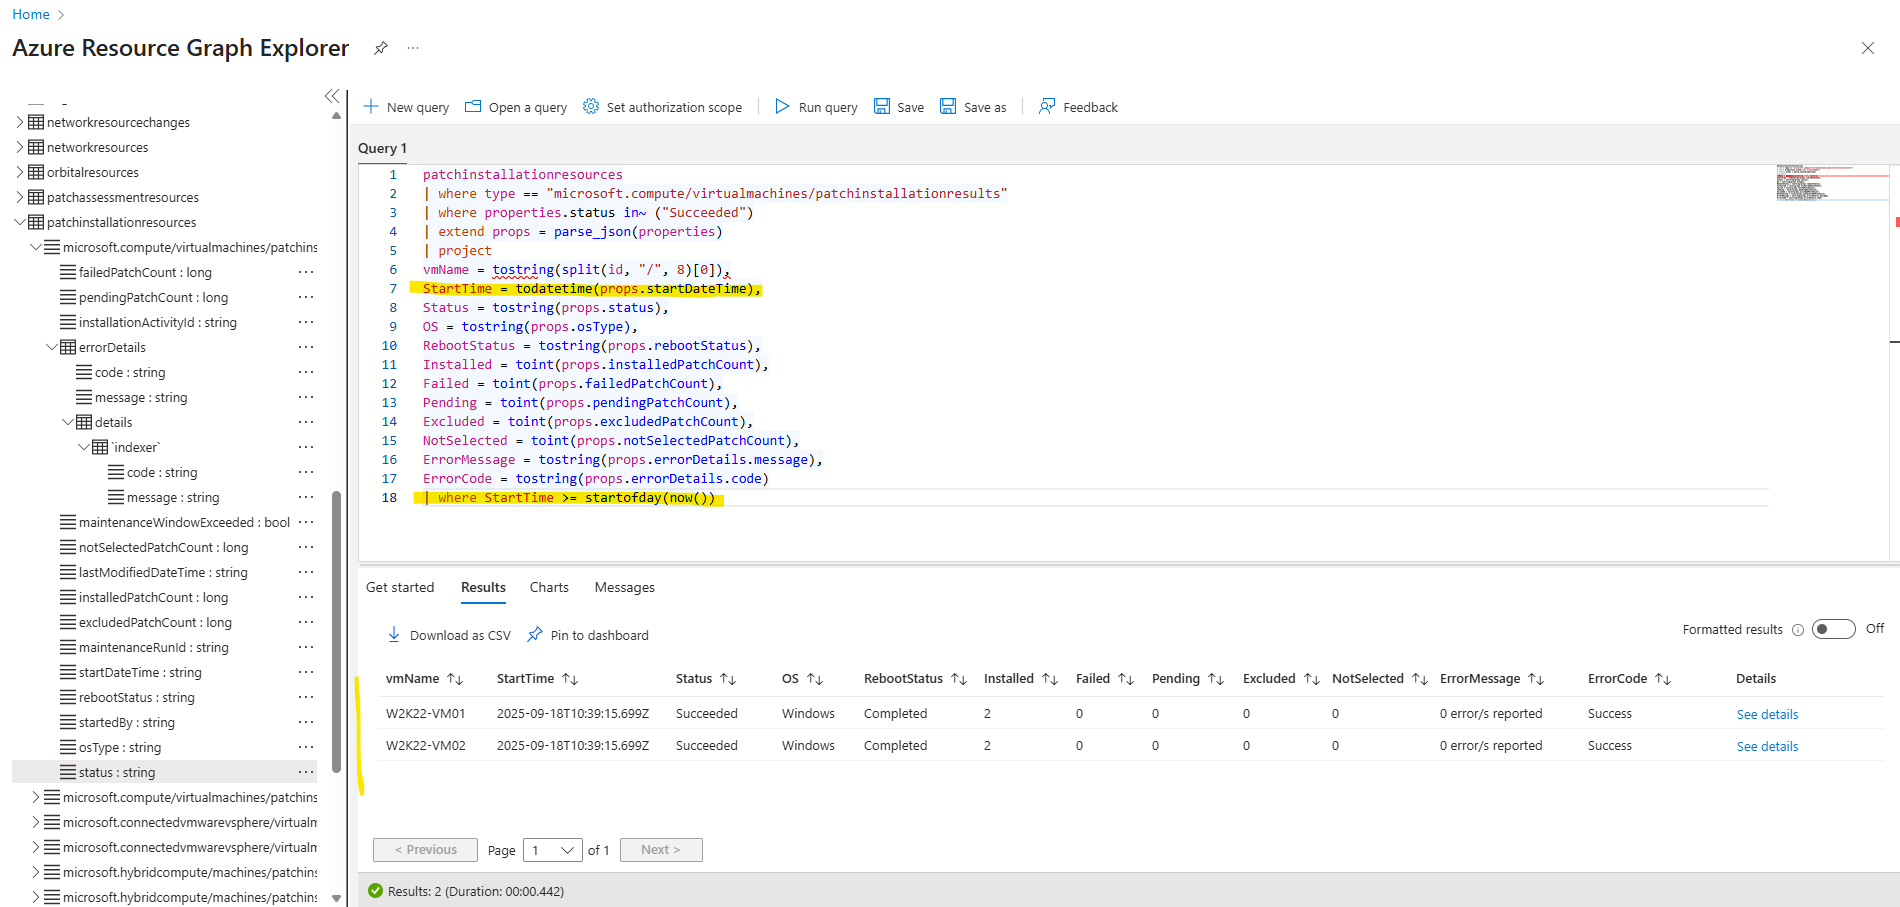
More query samples regarding Azure Update Manager you will find here https://learn.microsoft.com/en-us/azure/update-manager/sample-query-logs.
Trigger ARG Queries manually from Azure Monitor Logs
We can also trigger ARG queries manually from Azure Monitor Logs to check our patch results.
Therefore it is required to have a log analytics workspace even the patch results will be stored by Azure Update Manager now in Azure Resource Graph (ARG)
The arg(”) operator in Azure Monitor Logs lets us query Azure Resource Graph (ARG) tables directly from the Log Analytics query editor as already mentioned.
However, we still need a Log Analytics workspace to use the Azure Monitor Logs query editor, even if our main goal is to just query ARG tables.
The workspace acts as the context for the query editor, even if the data source is just ARG.
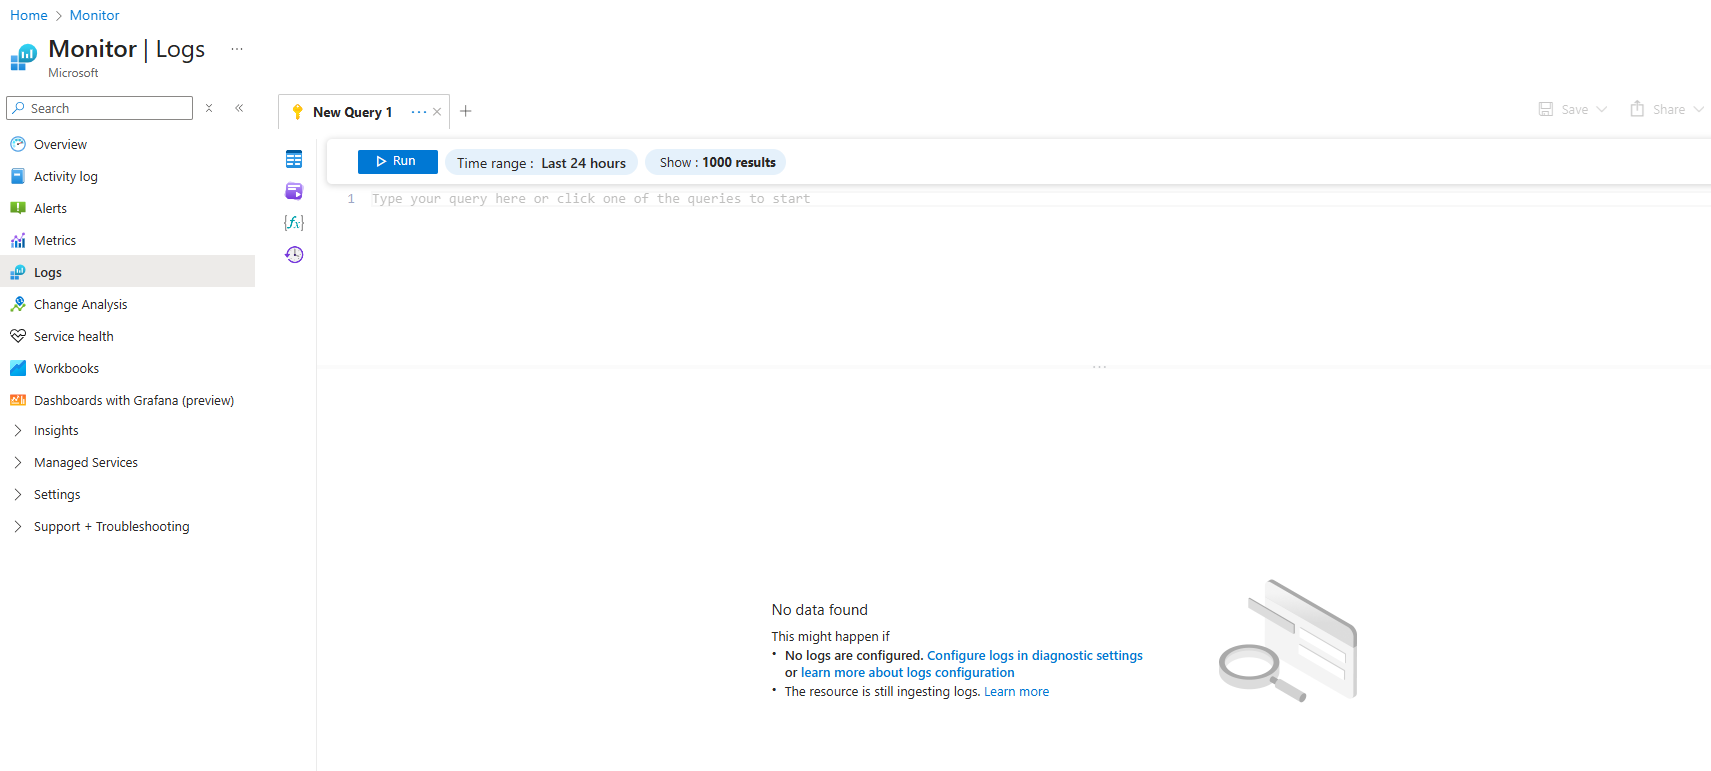
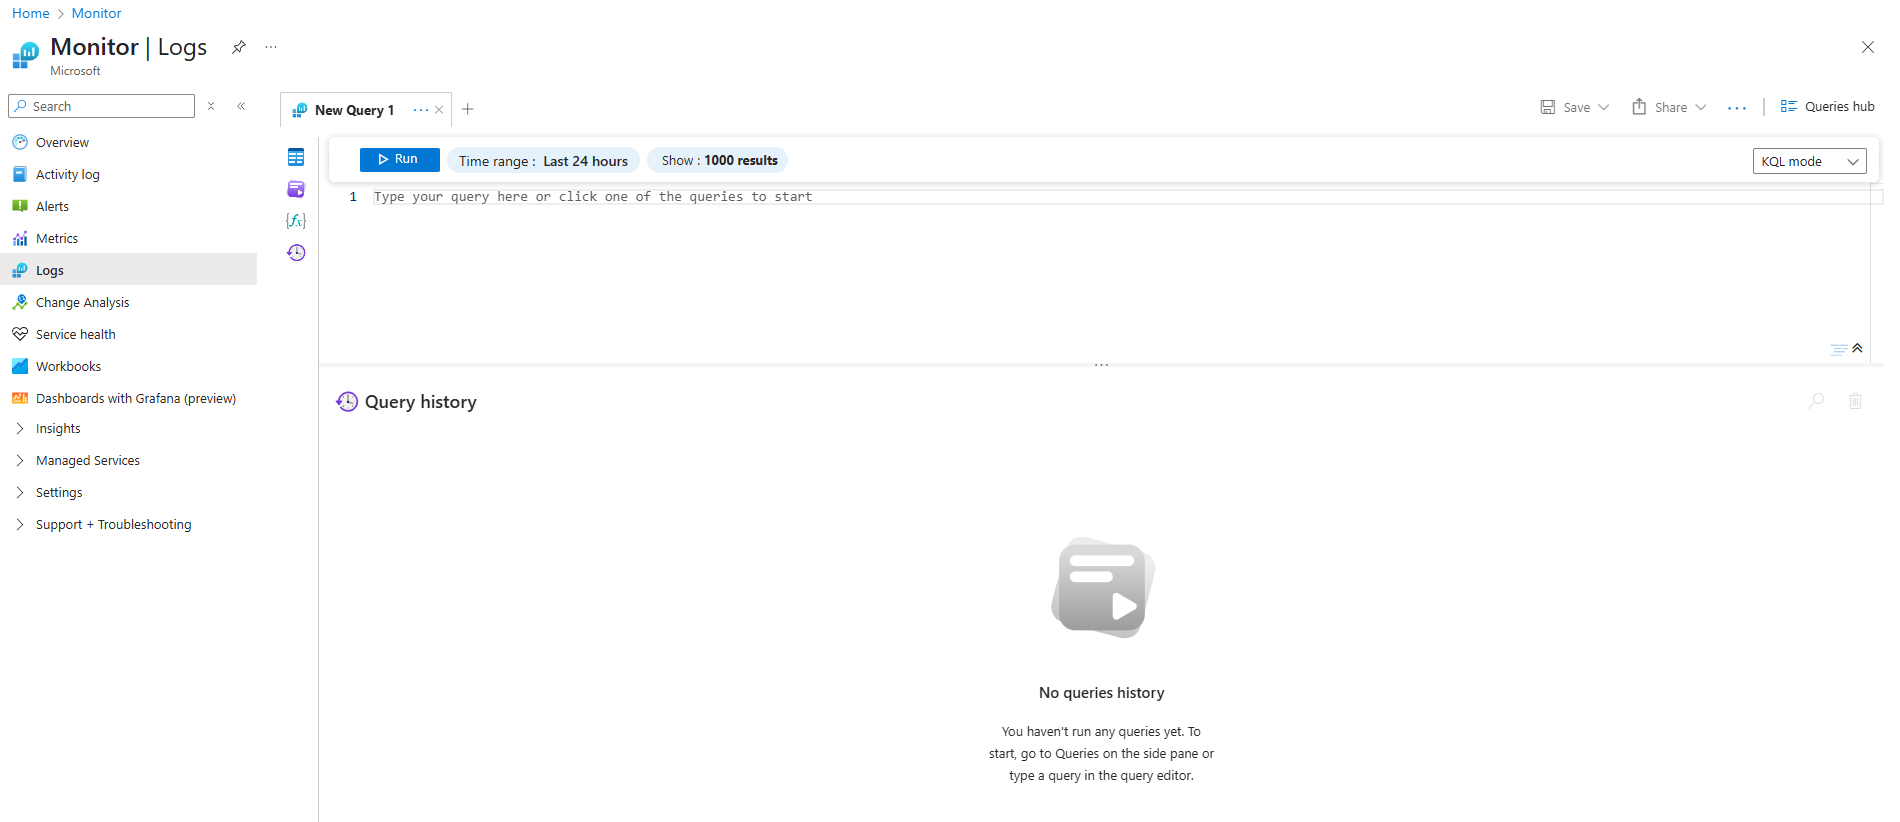
In case we doesn’t have a log analytics workspace selected for the scope below, the editor below doesn’t accept any input and is greyed out.
Below we can see the editor is greyed out and will not accept any input.
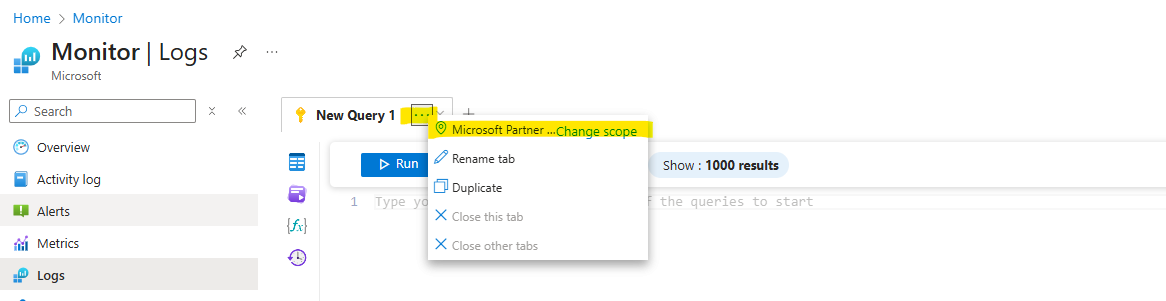
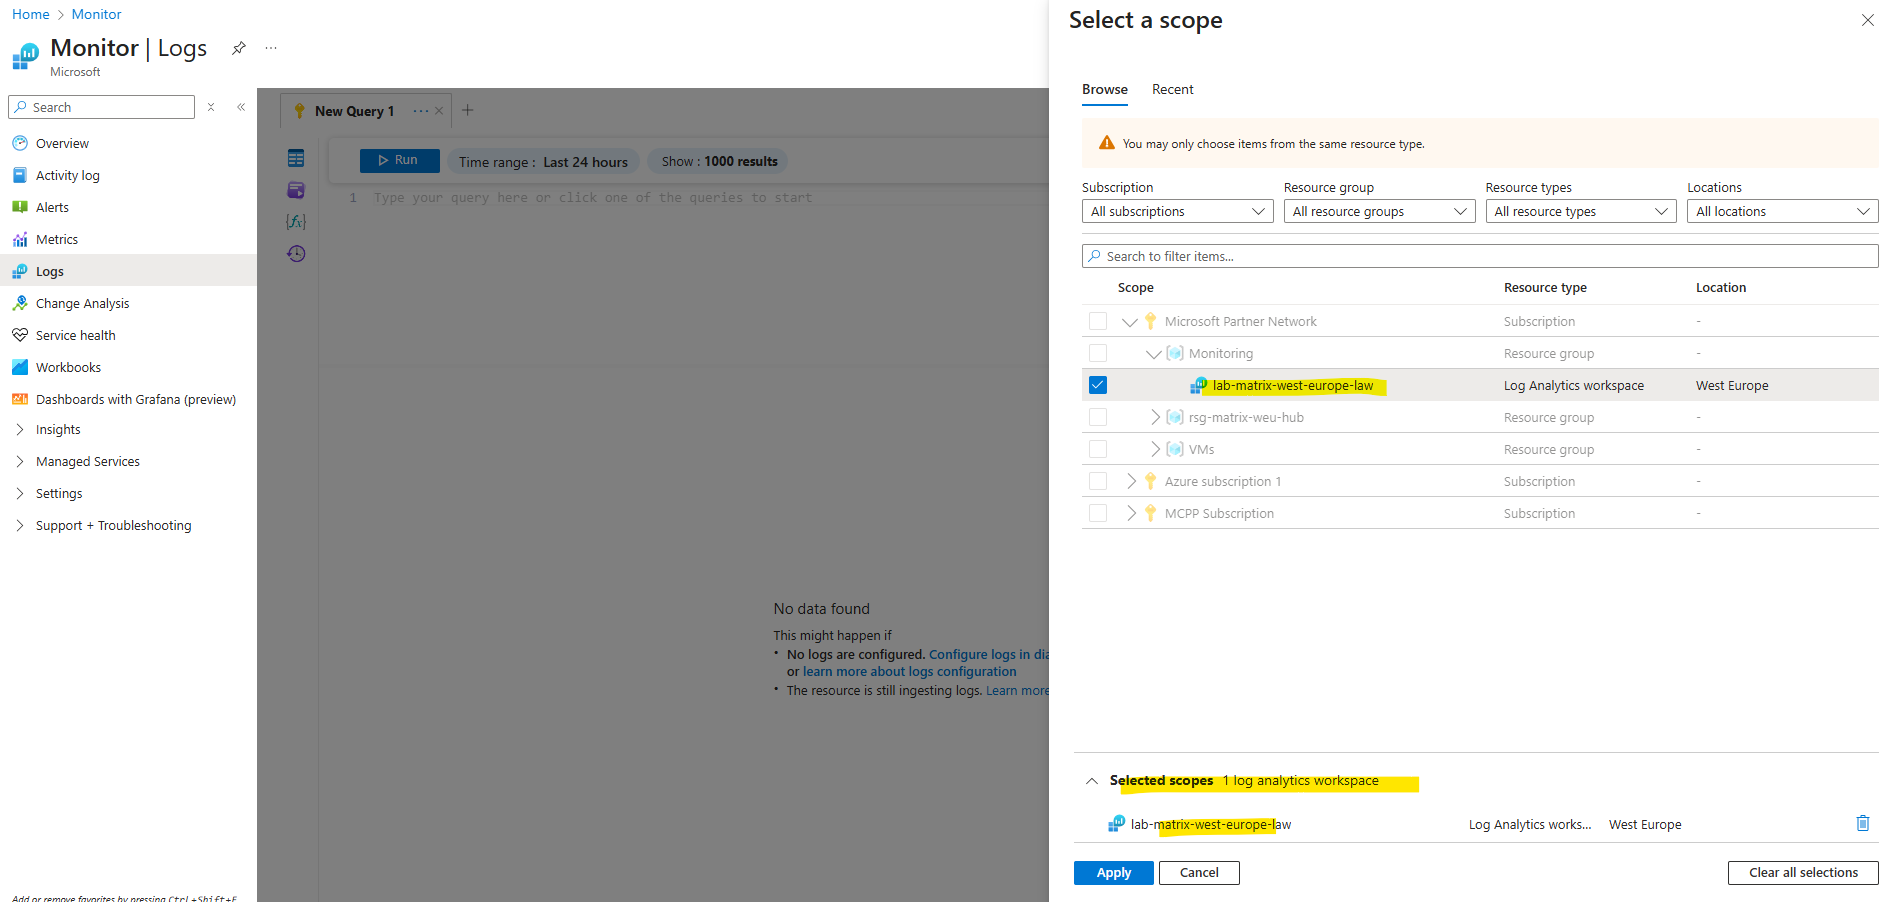
I will now change the scope for the Logs tool to my log analytics workspace.
We can already see that the message with “Type your query here …. ” is not greyed out anymore and we can enter or paste our ARG query into.
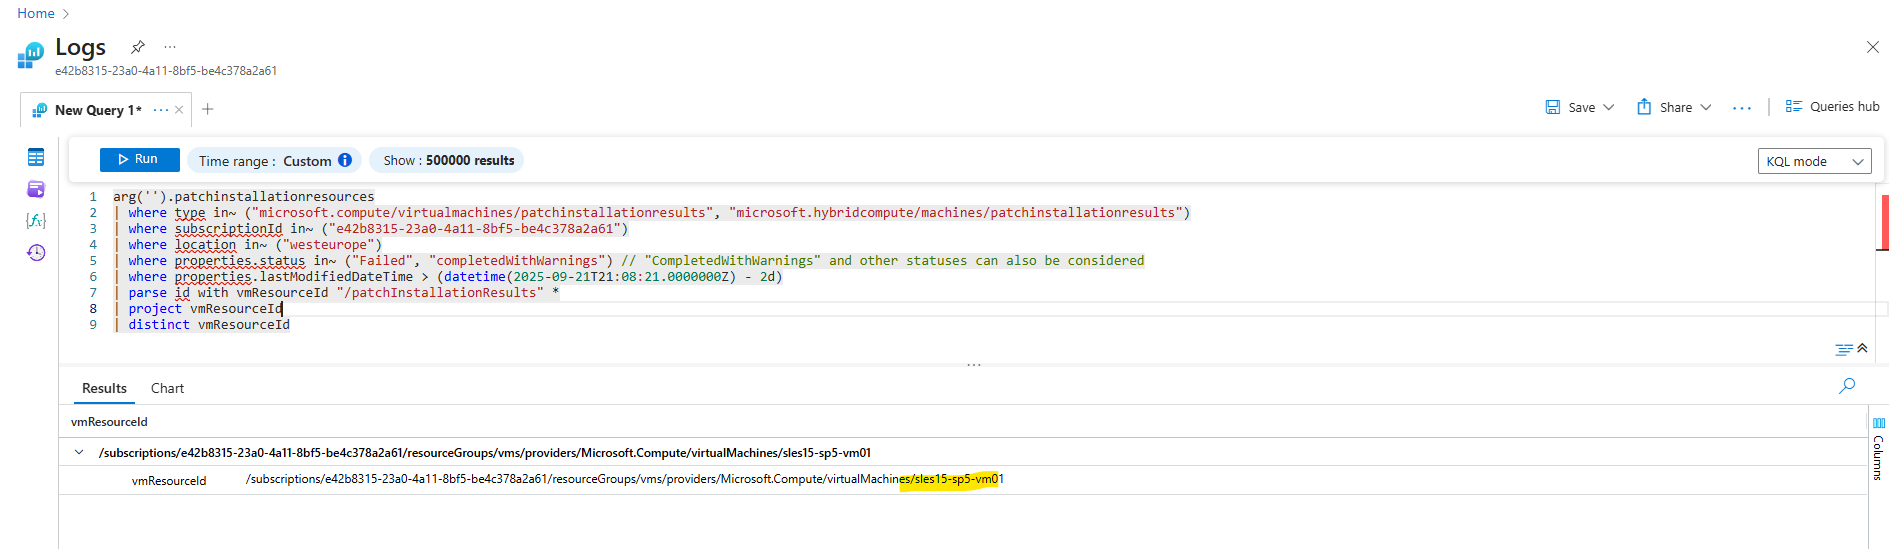
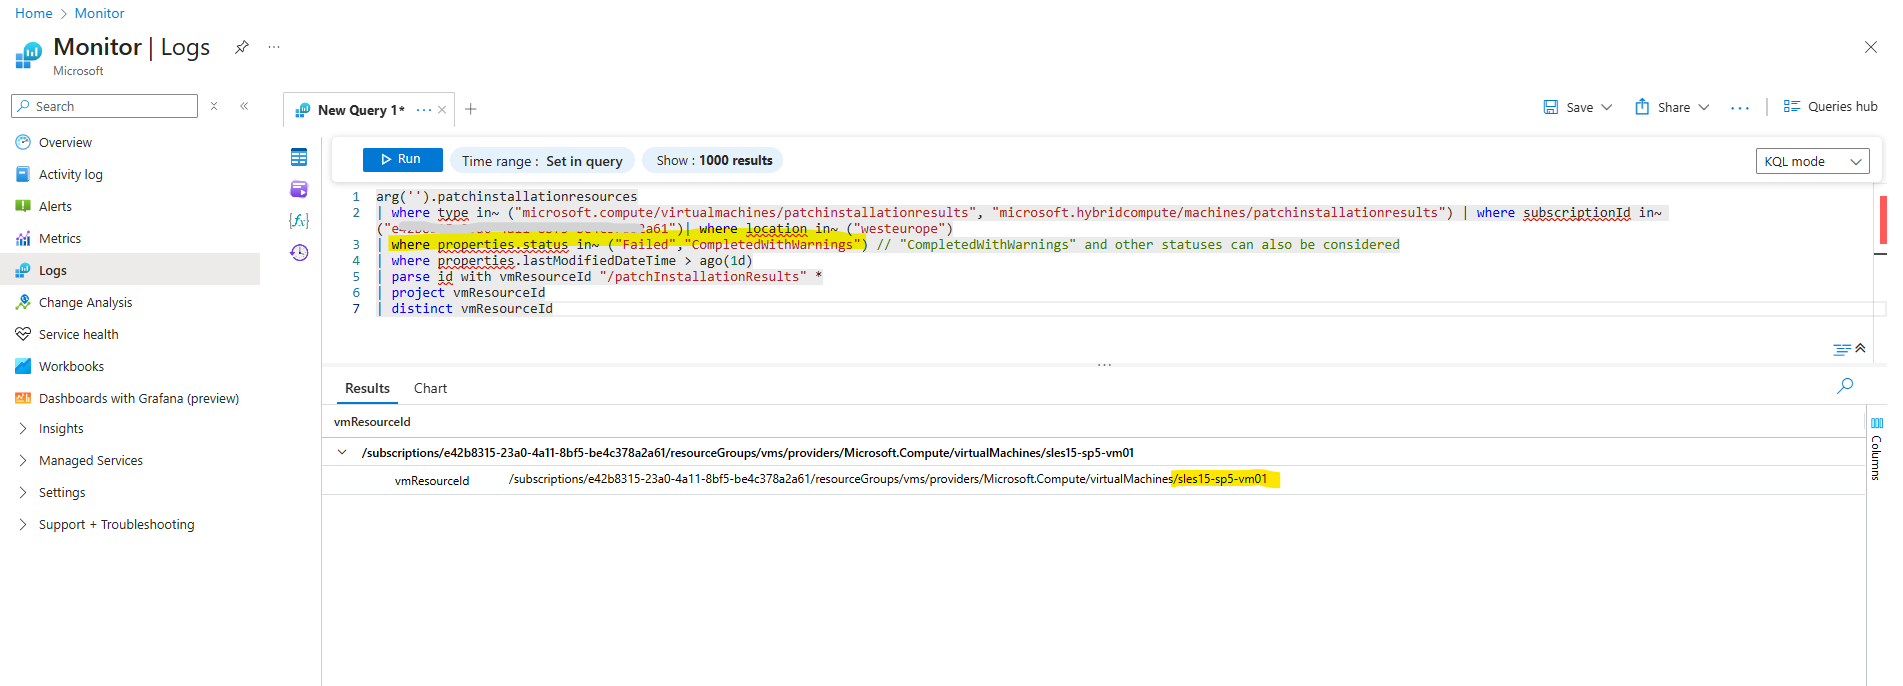
I will use the pre-defined Patch installation failures query we selected to create alerts previously to enter directly into the Logs editor.
Below I we will see the result, here one virtual machine (sles15-sp5-vm01) failed to install updates. The reason was that no repository was configured on.
Links
Create alerts (preview)
https://learn.microsoft.com/en-us/azure/update-manager/manage-alertsSample Azure Resource Graph queries to access Azure Update Manager operations data
https://learn.microsoft.com/en-us/azure/update-manager/sample-query-logsAccess Azure Update Manager operations data using Azure Resource Graph
https://learn.microsoft.com/en-us/azure/update-manager/query-logsWhat are Azure Monitor alerts?
https://learn.microsoft.com/en-us/azure/azure-monitor/alerts/alerts-overviewHow Update Manager works
https://learn.microsoft.com/en-us/azure/update-manager/workflow-update-managerWhat is Azure Resource Graph?
https://learn.microsoft.com/en-us/azure/governance/resource-graph/overviewQuery Azure Resource Graph from Azure Monitor
https://techcommunity.microsoft.com/blog/azureobservabilityblog/query-azure-resource-graph-from-azure-monitor/3918298Quickstart: Create alerts with Azure Resource Graph and Log Analytics
https://learn.microsoft.com/en-us/azure/governance/resource-graph/alerts-query-quickstart?tabs=azure-resource-graph