Microsoft Sentinel – a Cloud native SIEM Solution
In this post we will see what Microsoft Sentinel actually is and learn some basics to start with and how to onboard.
Microsoft Sentinel is Microsoft’s cloud native Security information and event management (SIEM) solution.
SIEM stands for Security Information and Event Management. It is a comprehensive approach to security management that combines the capabilities of Security Information Management (SIM) and Security Event Management (SEM).
SIEM systems provide a centralized platform for collecting, analyzing, and managing security data from various sources across an organization’s IT infrastructure.
Microsoft Sentinel, in addition to being a Security Information and Event Management (SIEM) system, is also a platform for Security Orchestration, Automation, and Response (SOAR).
Introduction
Microsoft Sentinel is a scalable, cloud-native solution that provides:
- Security information and event management (SIEM)
- Security orchestration, automation, and response (SOAR)
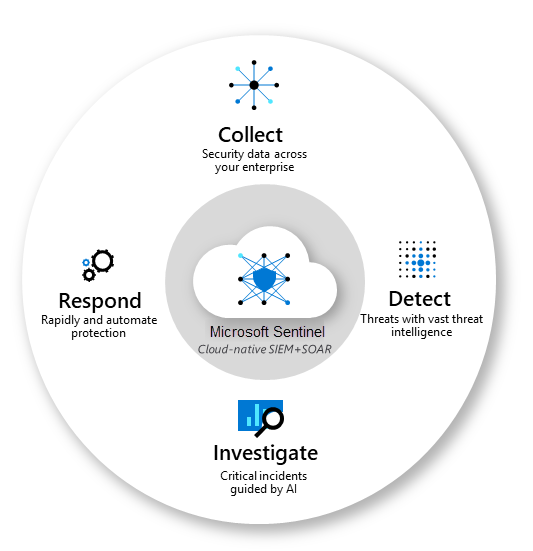
Microsoft Sentinel delivers intelligent security analytics and threat intelligence across the enterprise. With Microsoft Sentinel, you get a single solution for attack detection, threat visibility, proactive hunting, and threat response.
Microsoft Sentinel is your bird’s-eye view across the enterprise alleviating the stress of increasingly sophisticated attacks, increasing volumes of alerts, and long resolution time frames.
Microsoft Sentinel inherits the Azure Monitor tamper-proofing and immutability practices. While Azure Monitor is an append-only data platform, it includes provisions to delete data for compliance purposes.
- Collect data at cloud scale across all users, devices, applications, and infrastructure, both on-premises and in multiple clouds.
- Detect previously undetected threats, and minimize false positives using Microsoft’s analytics and unparalleled threat intelligence.
- Investigate threats with artificial intelligence, and hunt for suspicious activities at scale, tapping into years of cyber security work at Microsoft.
- Respond to incidents rapidly with built-in orchestration and automation of common tasks.
Source: https://learn.microsoft.com/en-us/azure/sentinel/overview
Microsoft Sentinel natively incorporates proven Azure services, like Log Analytics and Logic Apps. Microsoft Sentinel enriches your investigation and detection with AI. It provides Microsoft’s threat intelligence stream and enables you to bring your own threat intelligence.
This service supports Azure Lighthouse, which lets service providers sign in to their own tenant to manage subscriptions and resource groups that customers have delegated.
Modern cloud-native SIEM and intelligent security analytics
Microsoft Sentinel brings together data, analytics, and workflows to unify and accelerate threat detection and response across your enterprise. Data for security analysis is stored in an Azure Monitor Log Analytics workspace where Microsoft Sentinel analyzes, interacts and derives insights from large volumes of data in seconds. Microsoft Sentinel is billed for the volume of data stored in a Log Analytics workspace and analyzed in Microsoft Sentinel.
Source: https://azure.microsoft.com/en-us/pricing/details/microsoft-sentinel/
Onboarding Microsoft Sentinel
Below I will show how you can enable Microsoft Sentinel and install a solution from the content hub in order to import data directly in real time into Microsoft Sentinel.
Microsoft Sentinel comes with many data connectors for Microsoft products such as the Microsoft Defender XDR service-to-service connector. You can also enable built-in connectors for non-Microsoft products such as Syslog or Common Event Format (CEF).
Solutions in Microsoft Sentinel provide a consolidated way to acquire Microsoft Sentinel content, like data connectors, workbooks, analytics, and automation, in your workspace with a single deployment step.
Source: https://learn.microsoft.com/en-us/azure/sentinel/sentinel-solutions-catalog
Data connectors provide log ingestion from different sources into Microsoft Sentinel.
Workbooks provide monitoring, visualization, and interactivity with data in Microsoft Sentinel, highlighting meaningful insights for users.
In a nutshell, these solutions will import data in real time from the source where the data is created like for example Microsoft Defender XDR into Microsoft Sentinel. For Microsoft Defender XDR there is also a out of the box connector available in the content hub.
Further these solutions will include workbooks which can be used to visualize and monitor the imported data in Microsoft Sentinel.
Enable Microsoft Sentinel
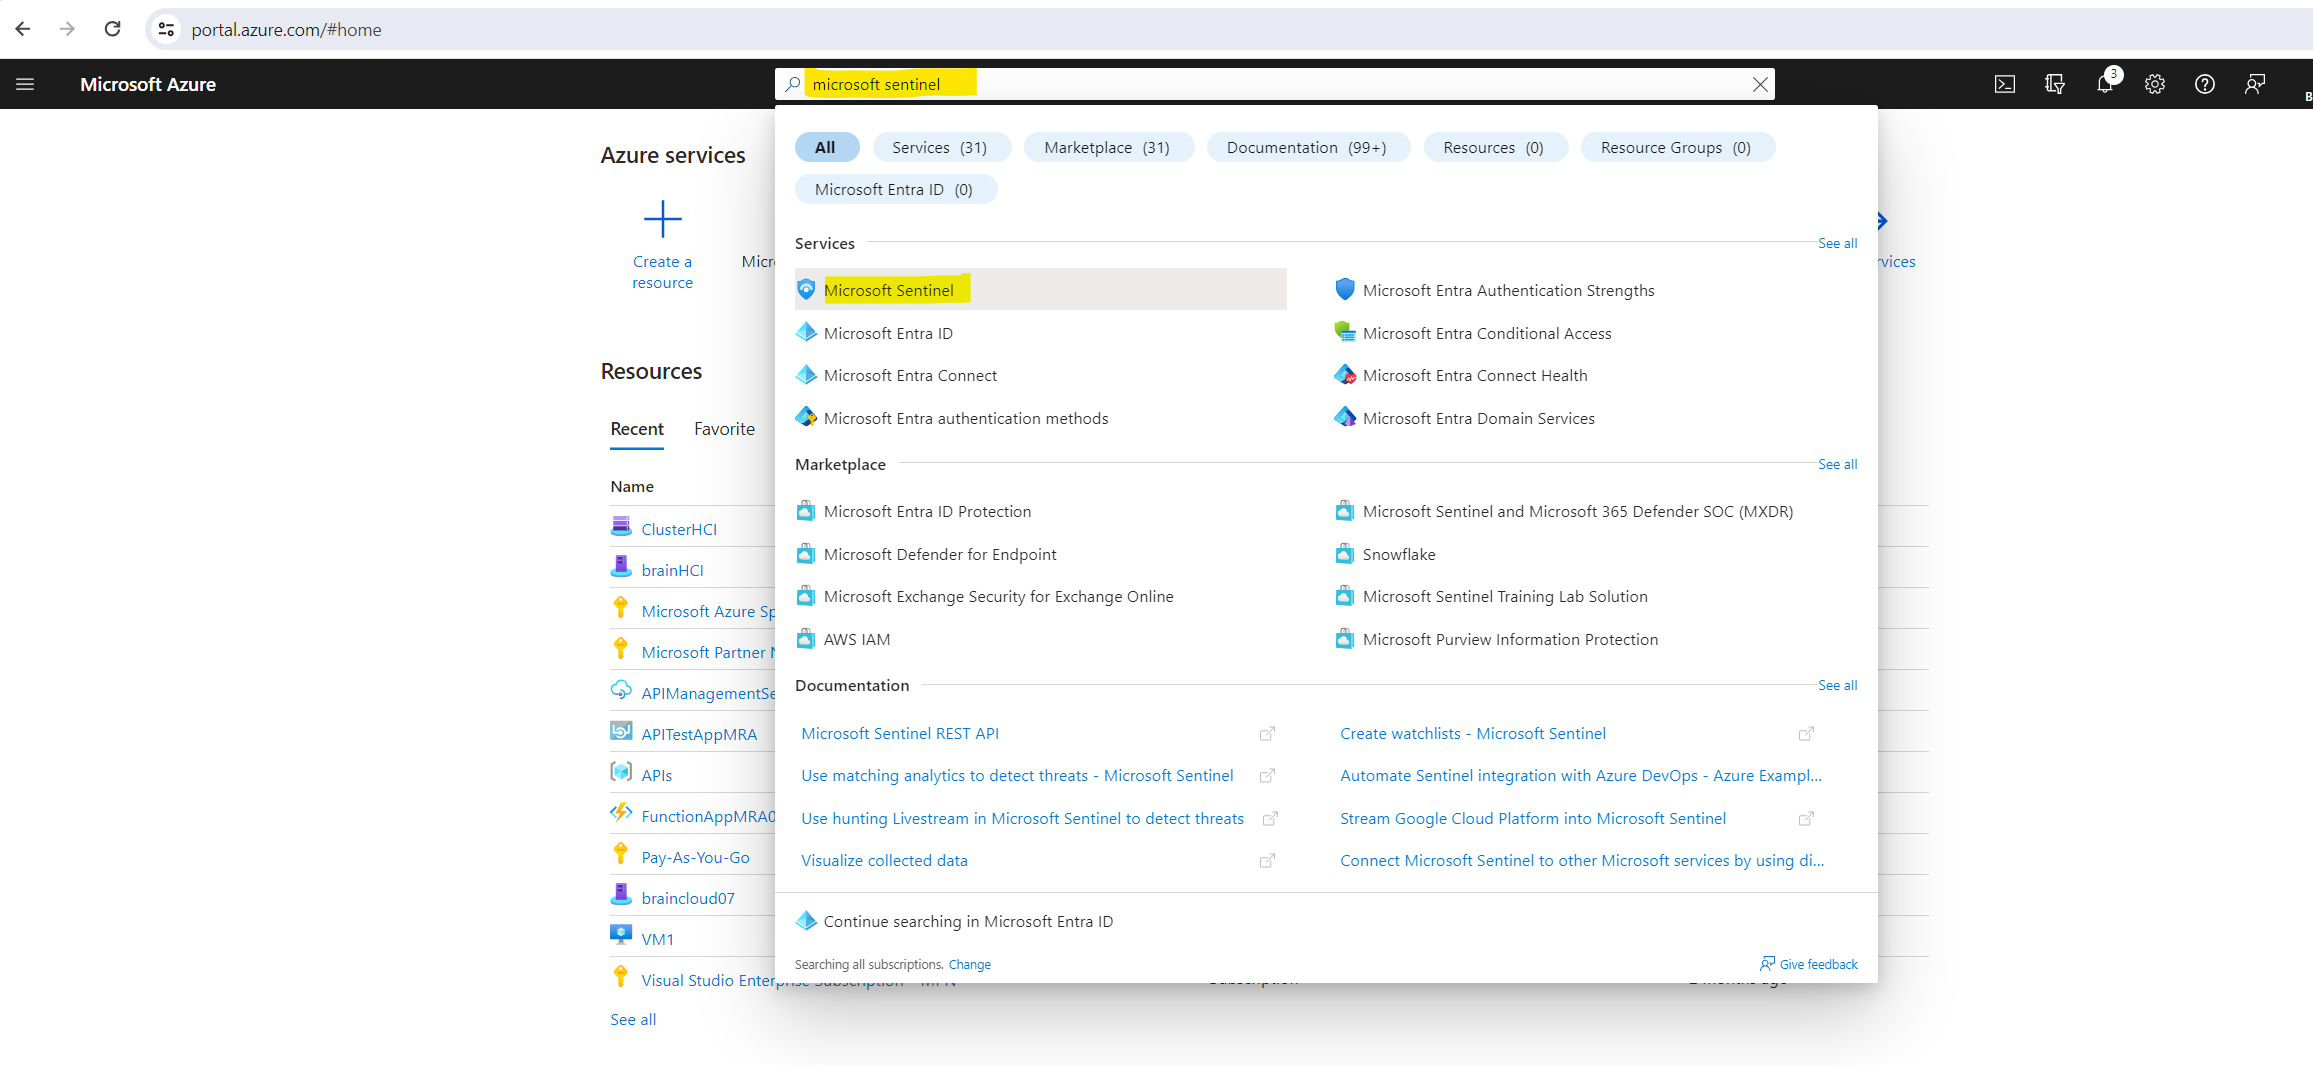
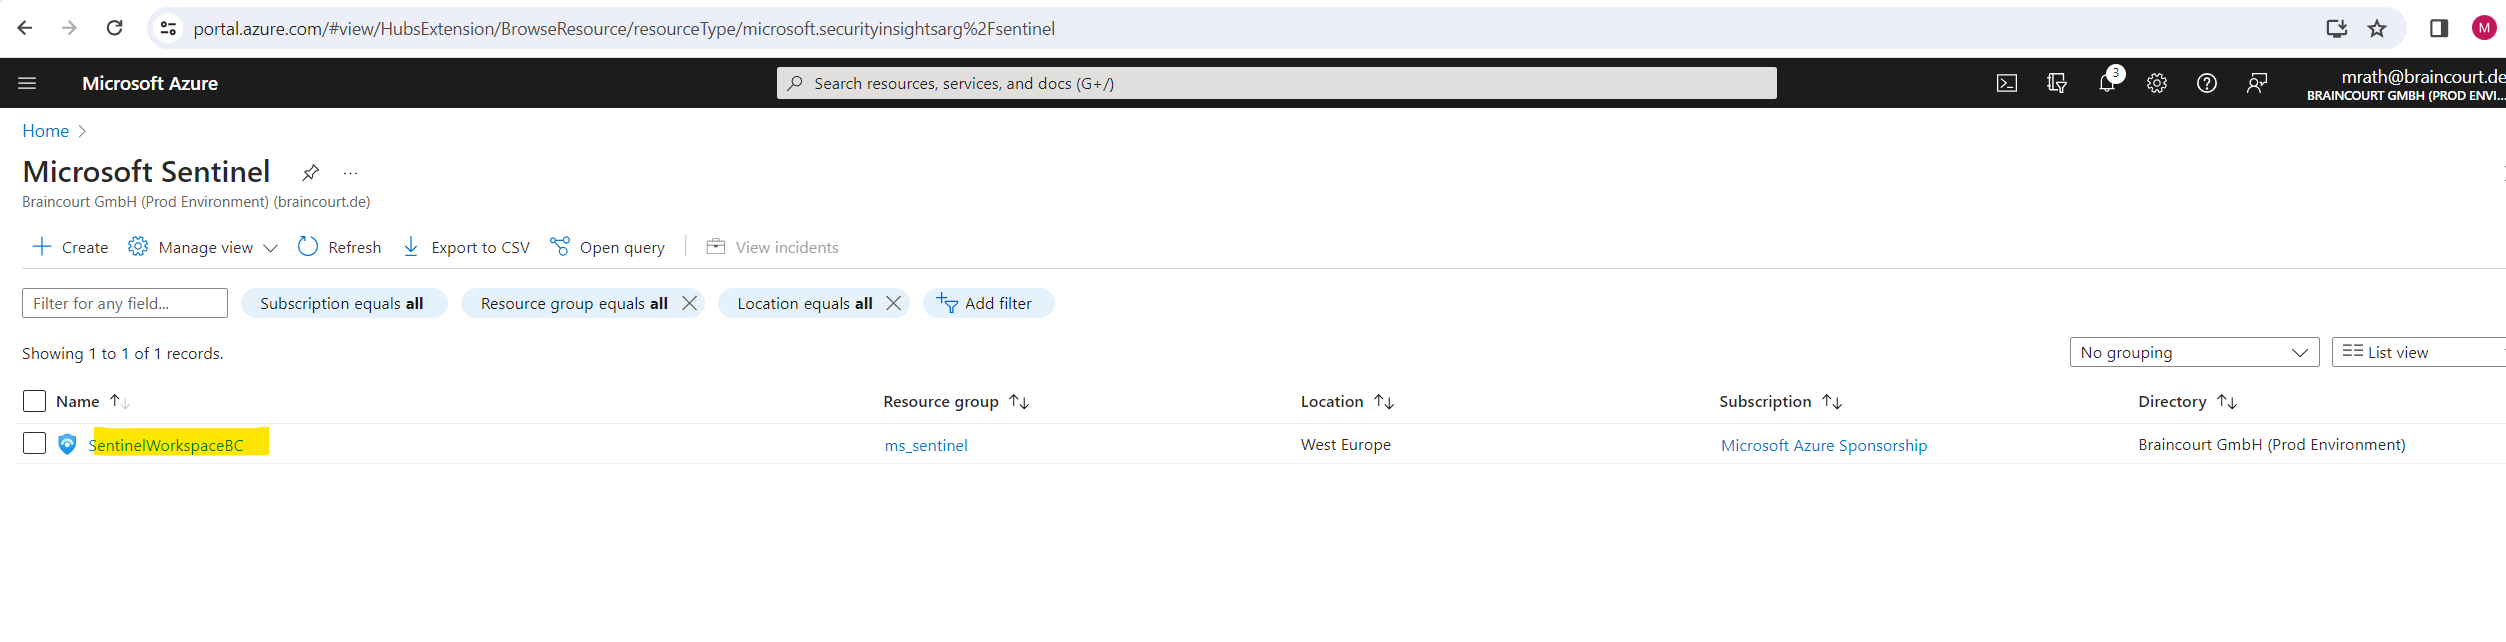
In the Azure portal search and select Microsoft Sentinel.
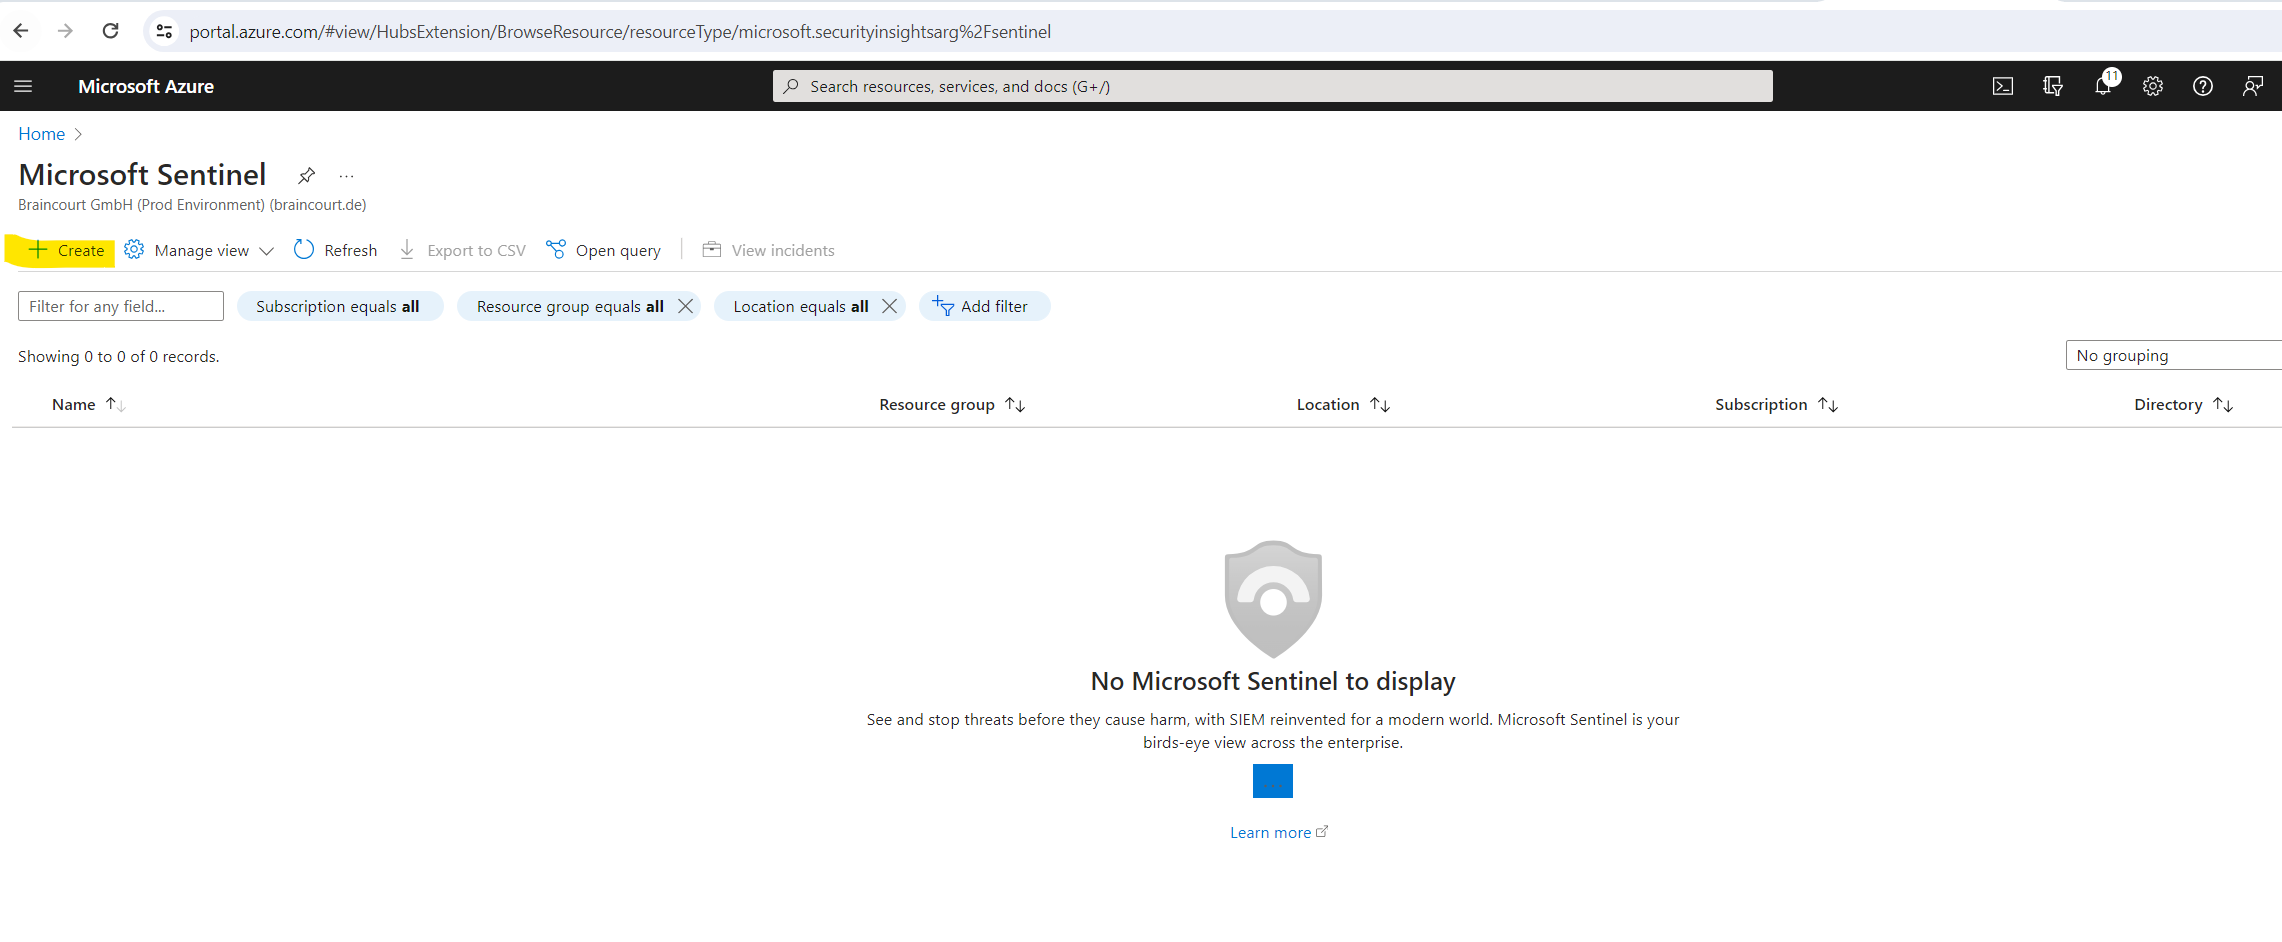
Click on Create
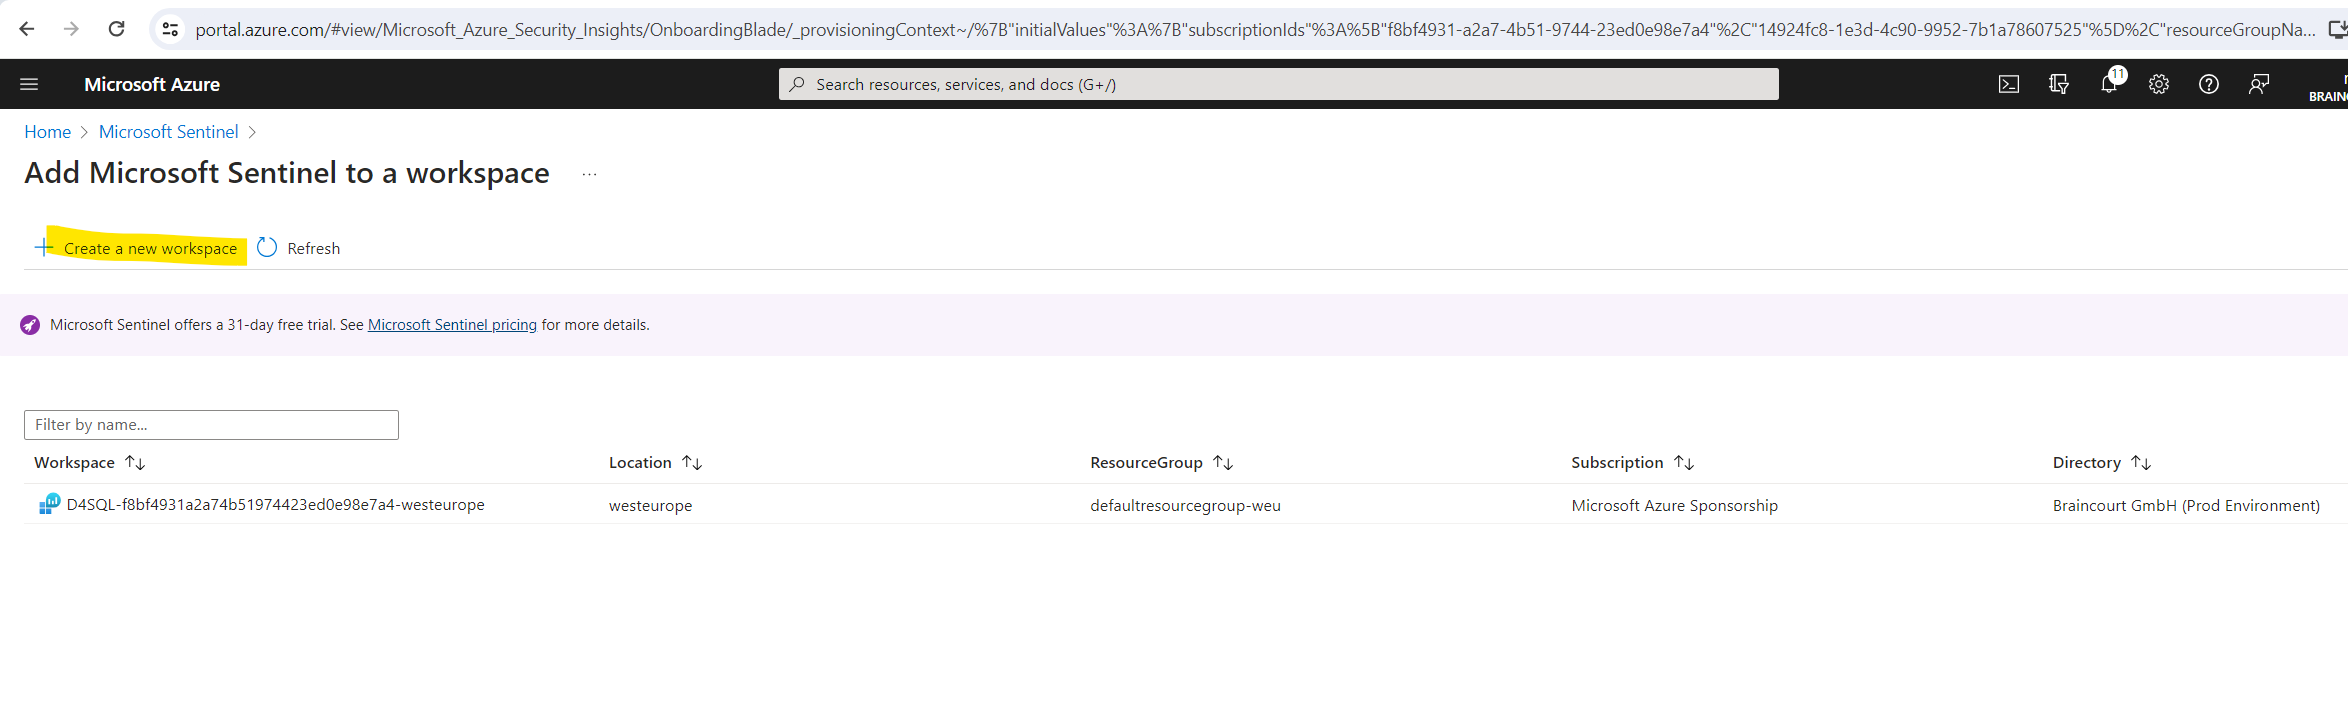
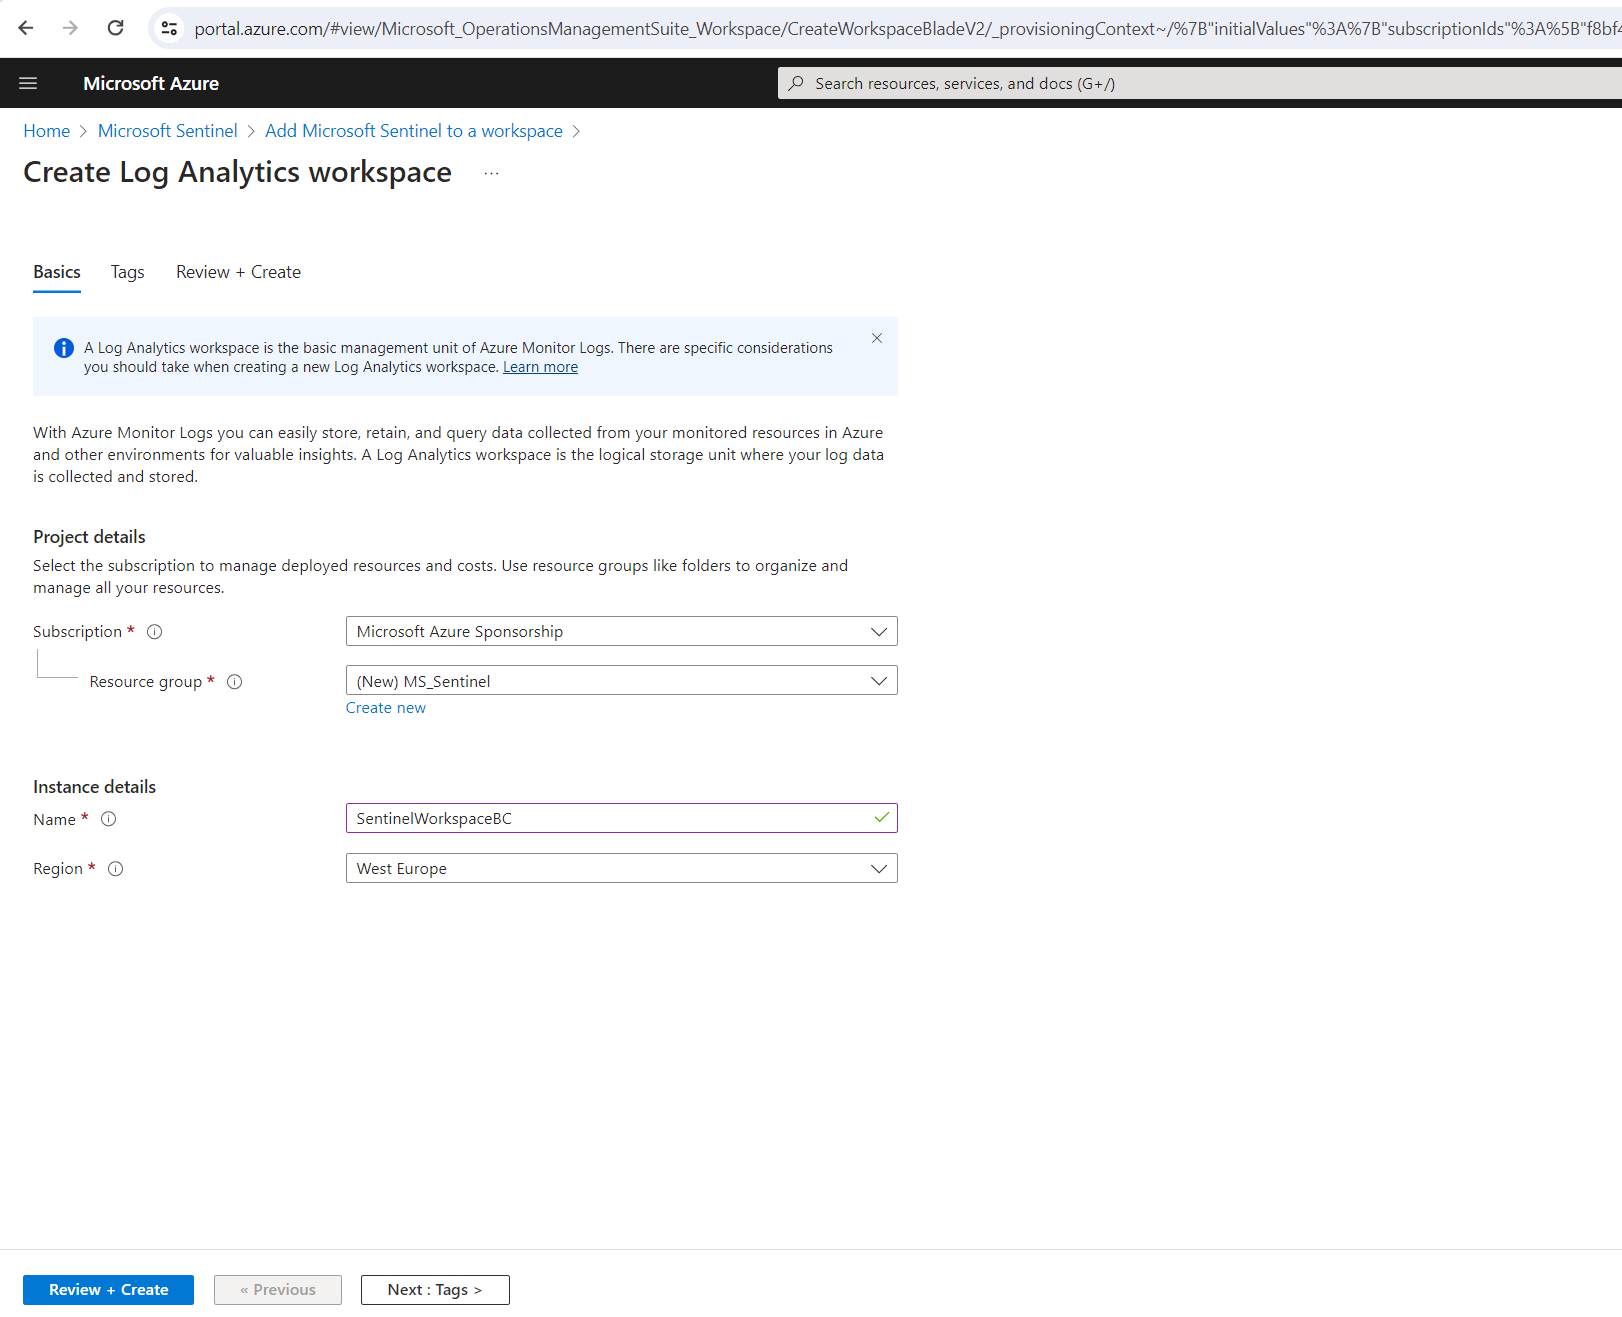
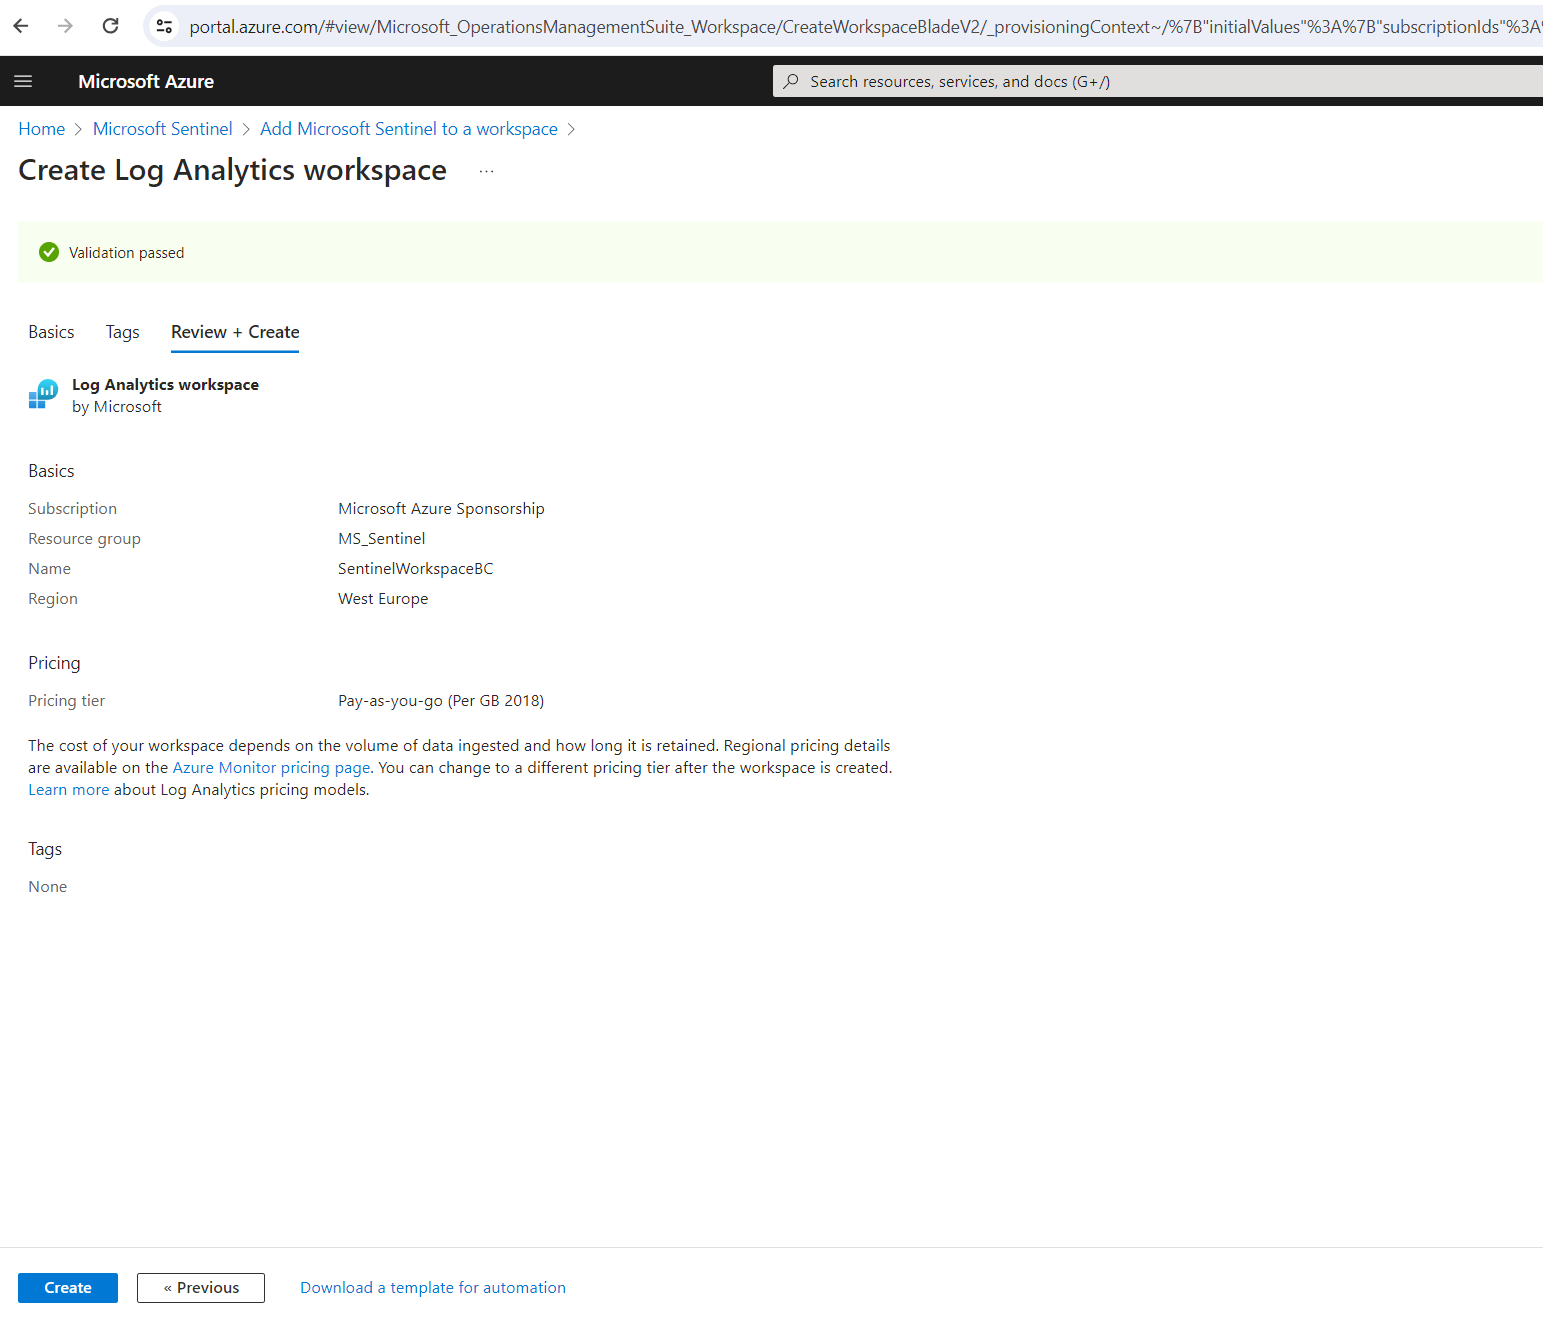
Select the workspace you want to use or create a new one. You can run Microsoft Sentinel on more than one workspace, but the data is isolated to a single workspace.
I will create a new workspace.
The default workspaces created by Microsoft Defender for Cloud aren’t shown in the list. You can’t install Microsoft Sentinel on these workspaces.
The already shown up workspace below is from Microsoft Defender For SQL btw.
Select the workspace and click on Add .
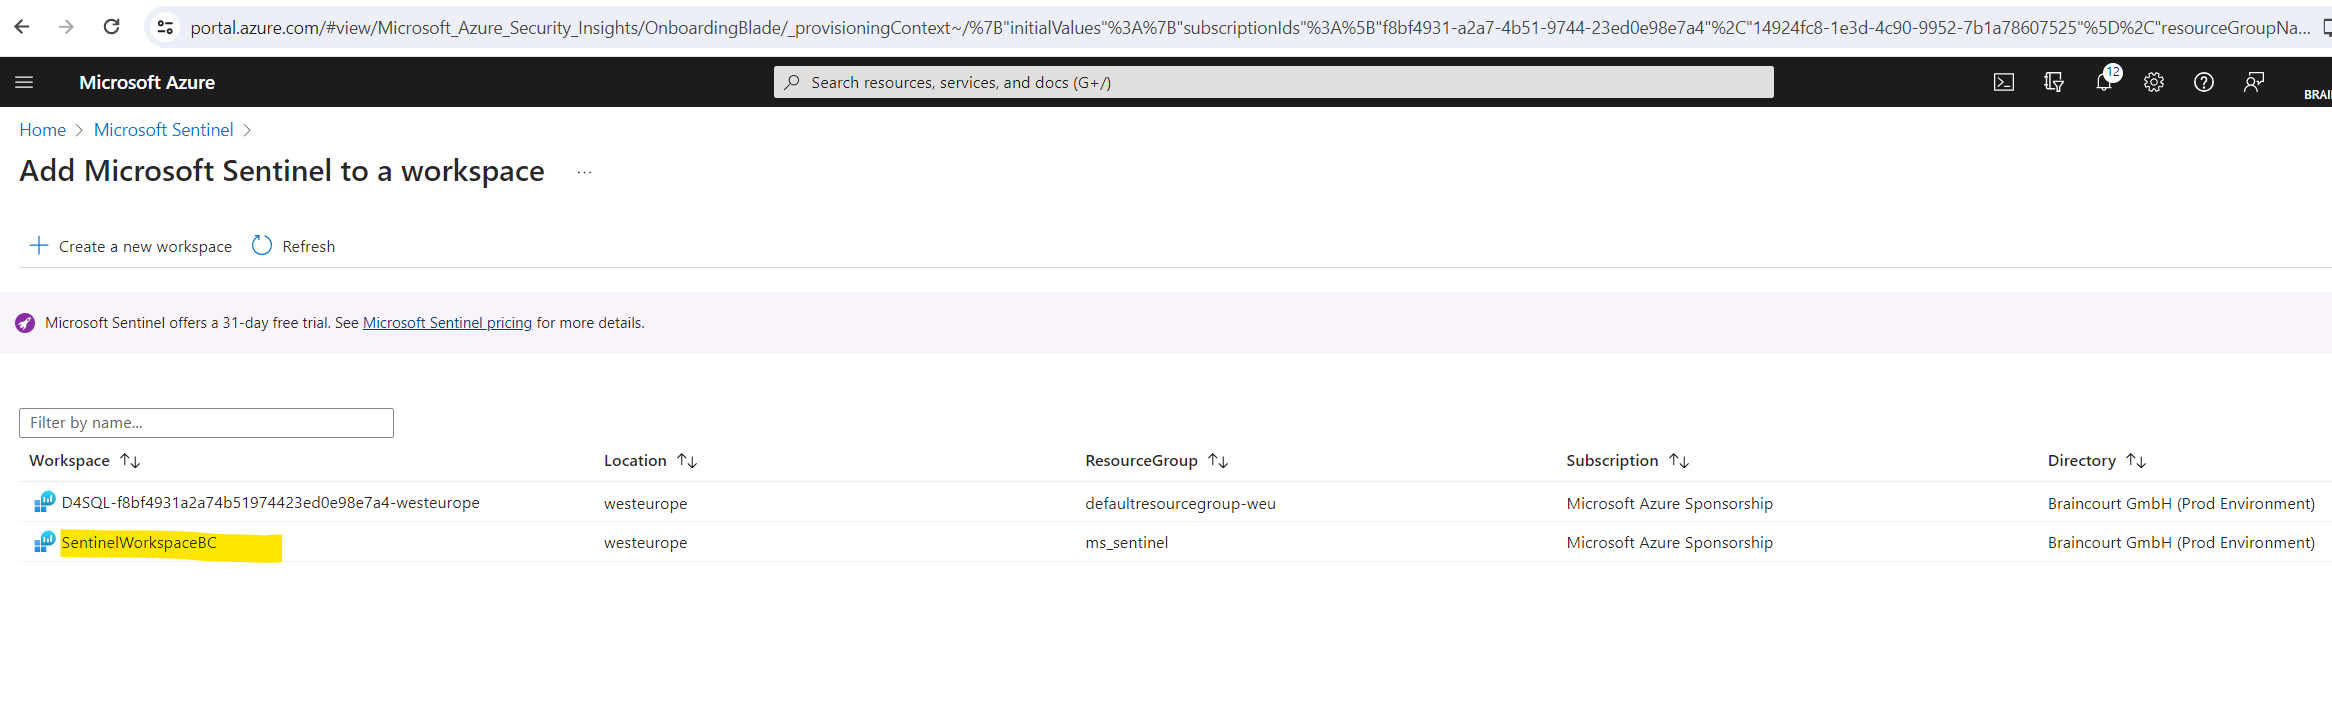
I will activate the free trial here.

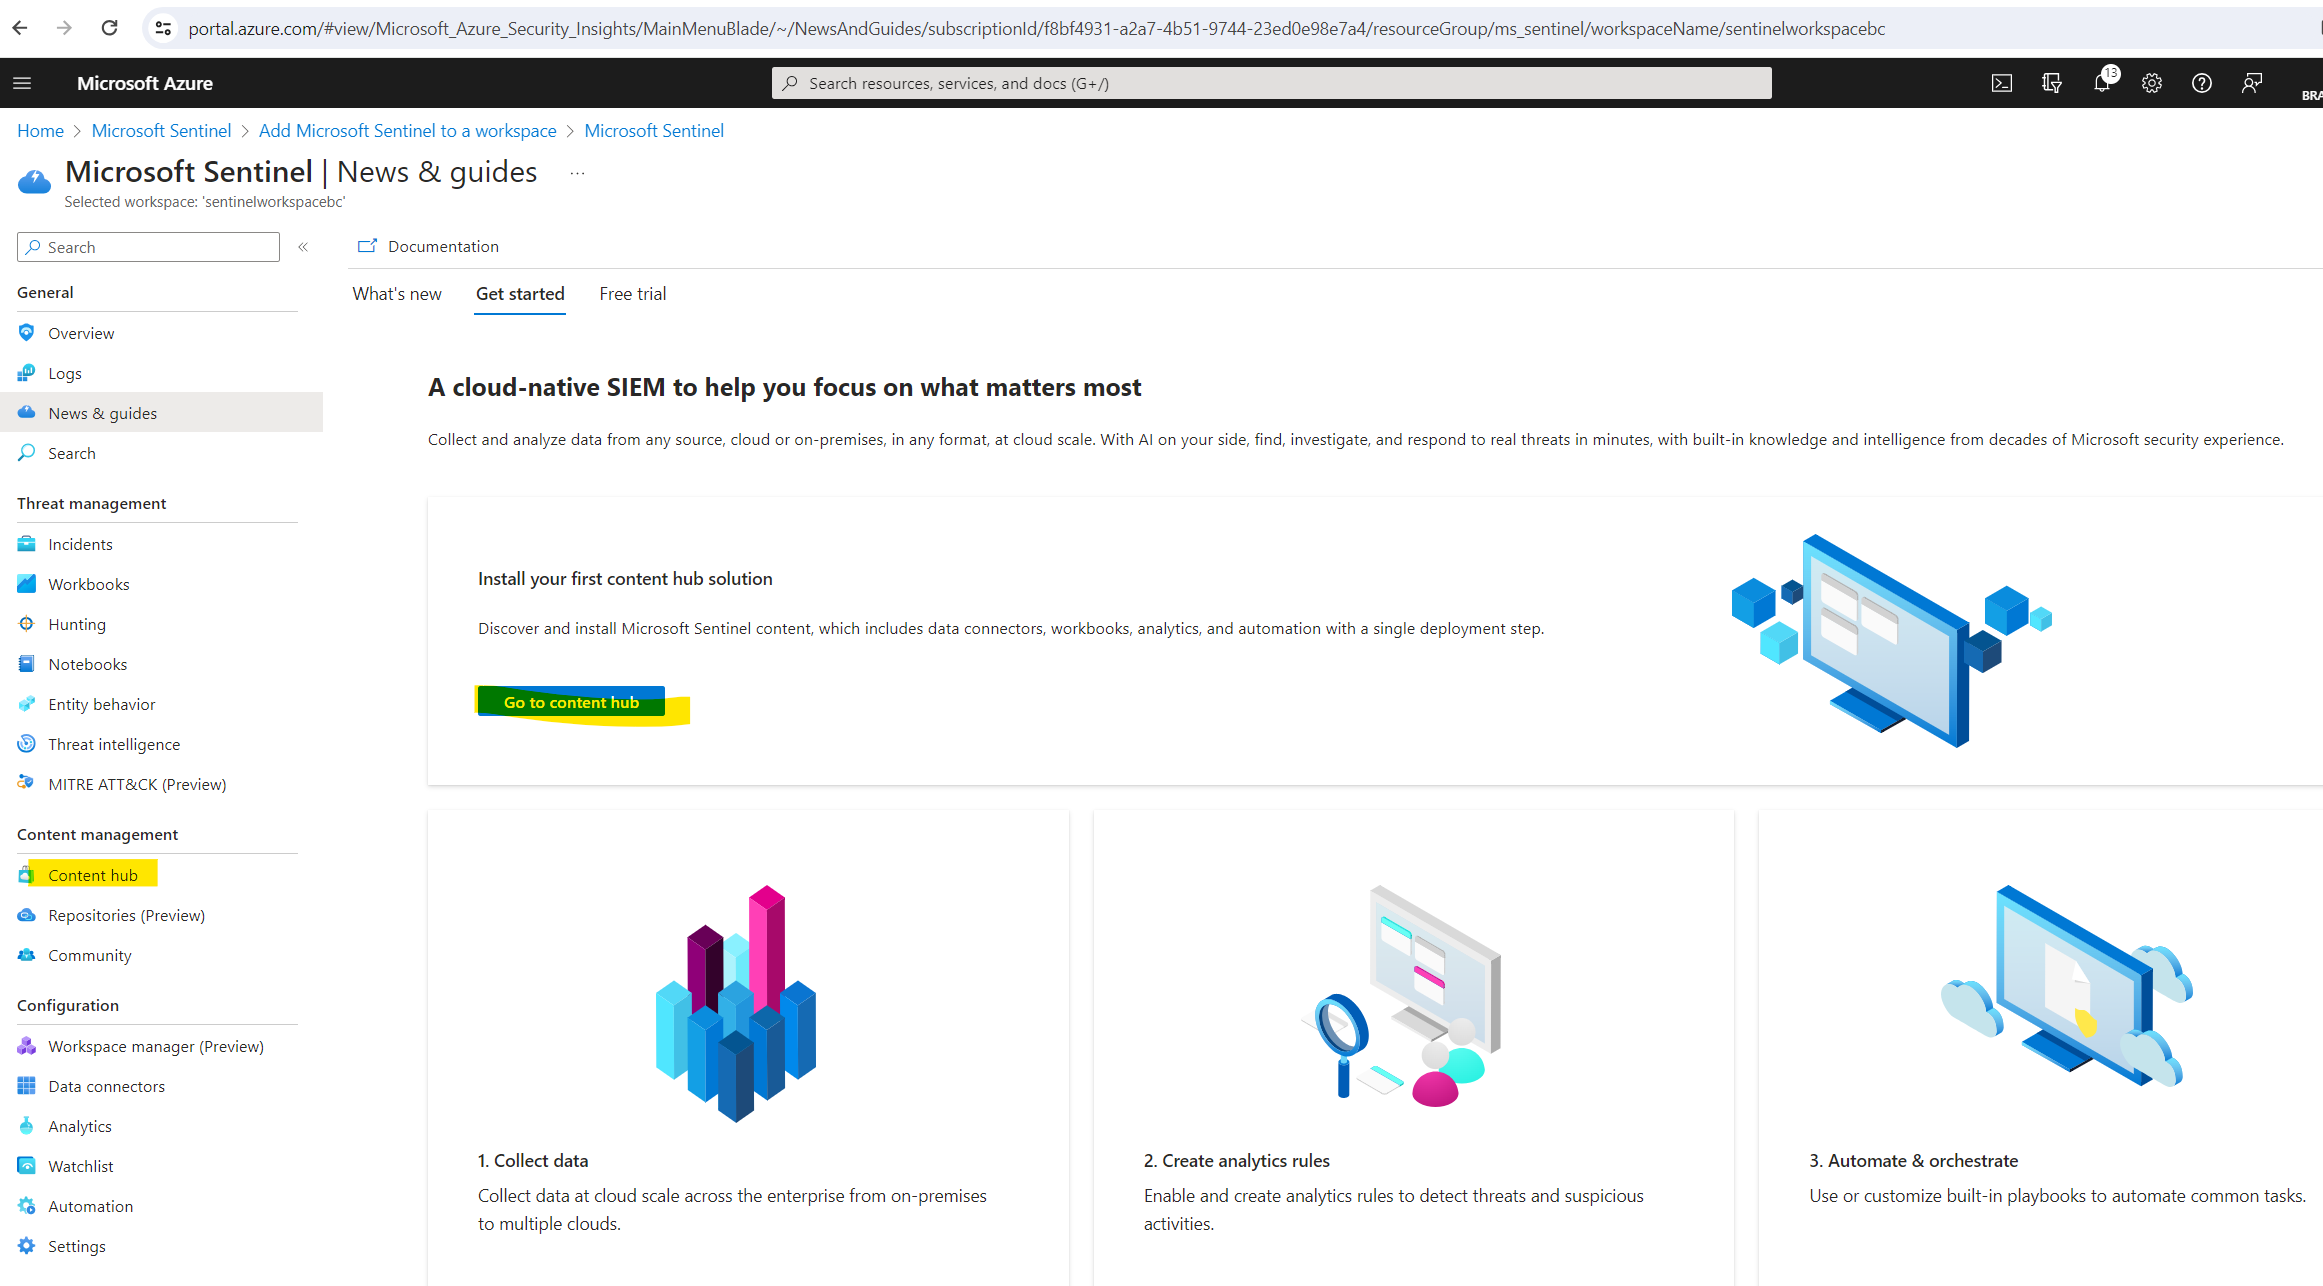
The next step is to install a solution from the content hub for the desired data we want to monitor. As mentioned these solutions include data connectors which will import data from sources and they also include workbooks to visualize and monitor the imported data in Microsoft Sentinel.
Install a solution from the content hub
The content hub in Microsoft Sentinel is the centralized location to discover and manage out-of-the-box content including data connectors. To demonstrate I will use the quickstart from Microsoft and install here the solution for Azure Activity.
Azure Activity Log is a subscription log that provides insight into subscription-level events that occur in Azure, including events from Azure Resource Manager operational data, service health events, write operations taken on the resources in your subscription, and the status of activities performed in Azure.
Source: https://learn.microsoft.com/en-us/azure/sentinel/data-connectors/azure-activity
Under https://learn.microsoft.com/en-us/azure/sentinel/data-connectors/azure-activity and here the All connectors menu all data connectors are described.
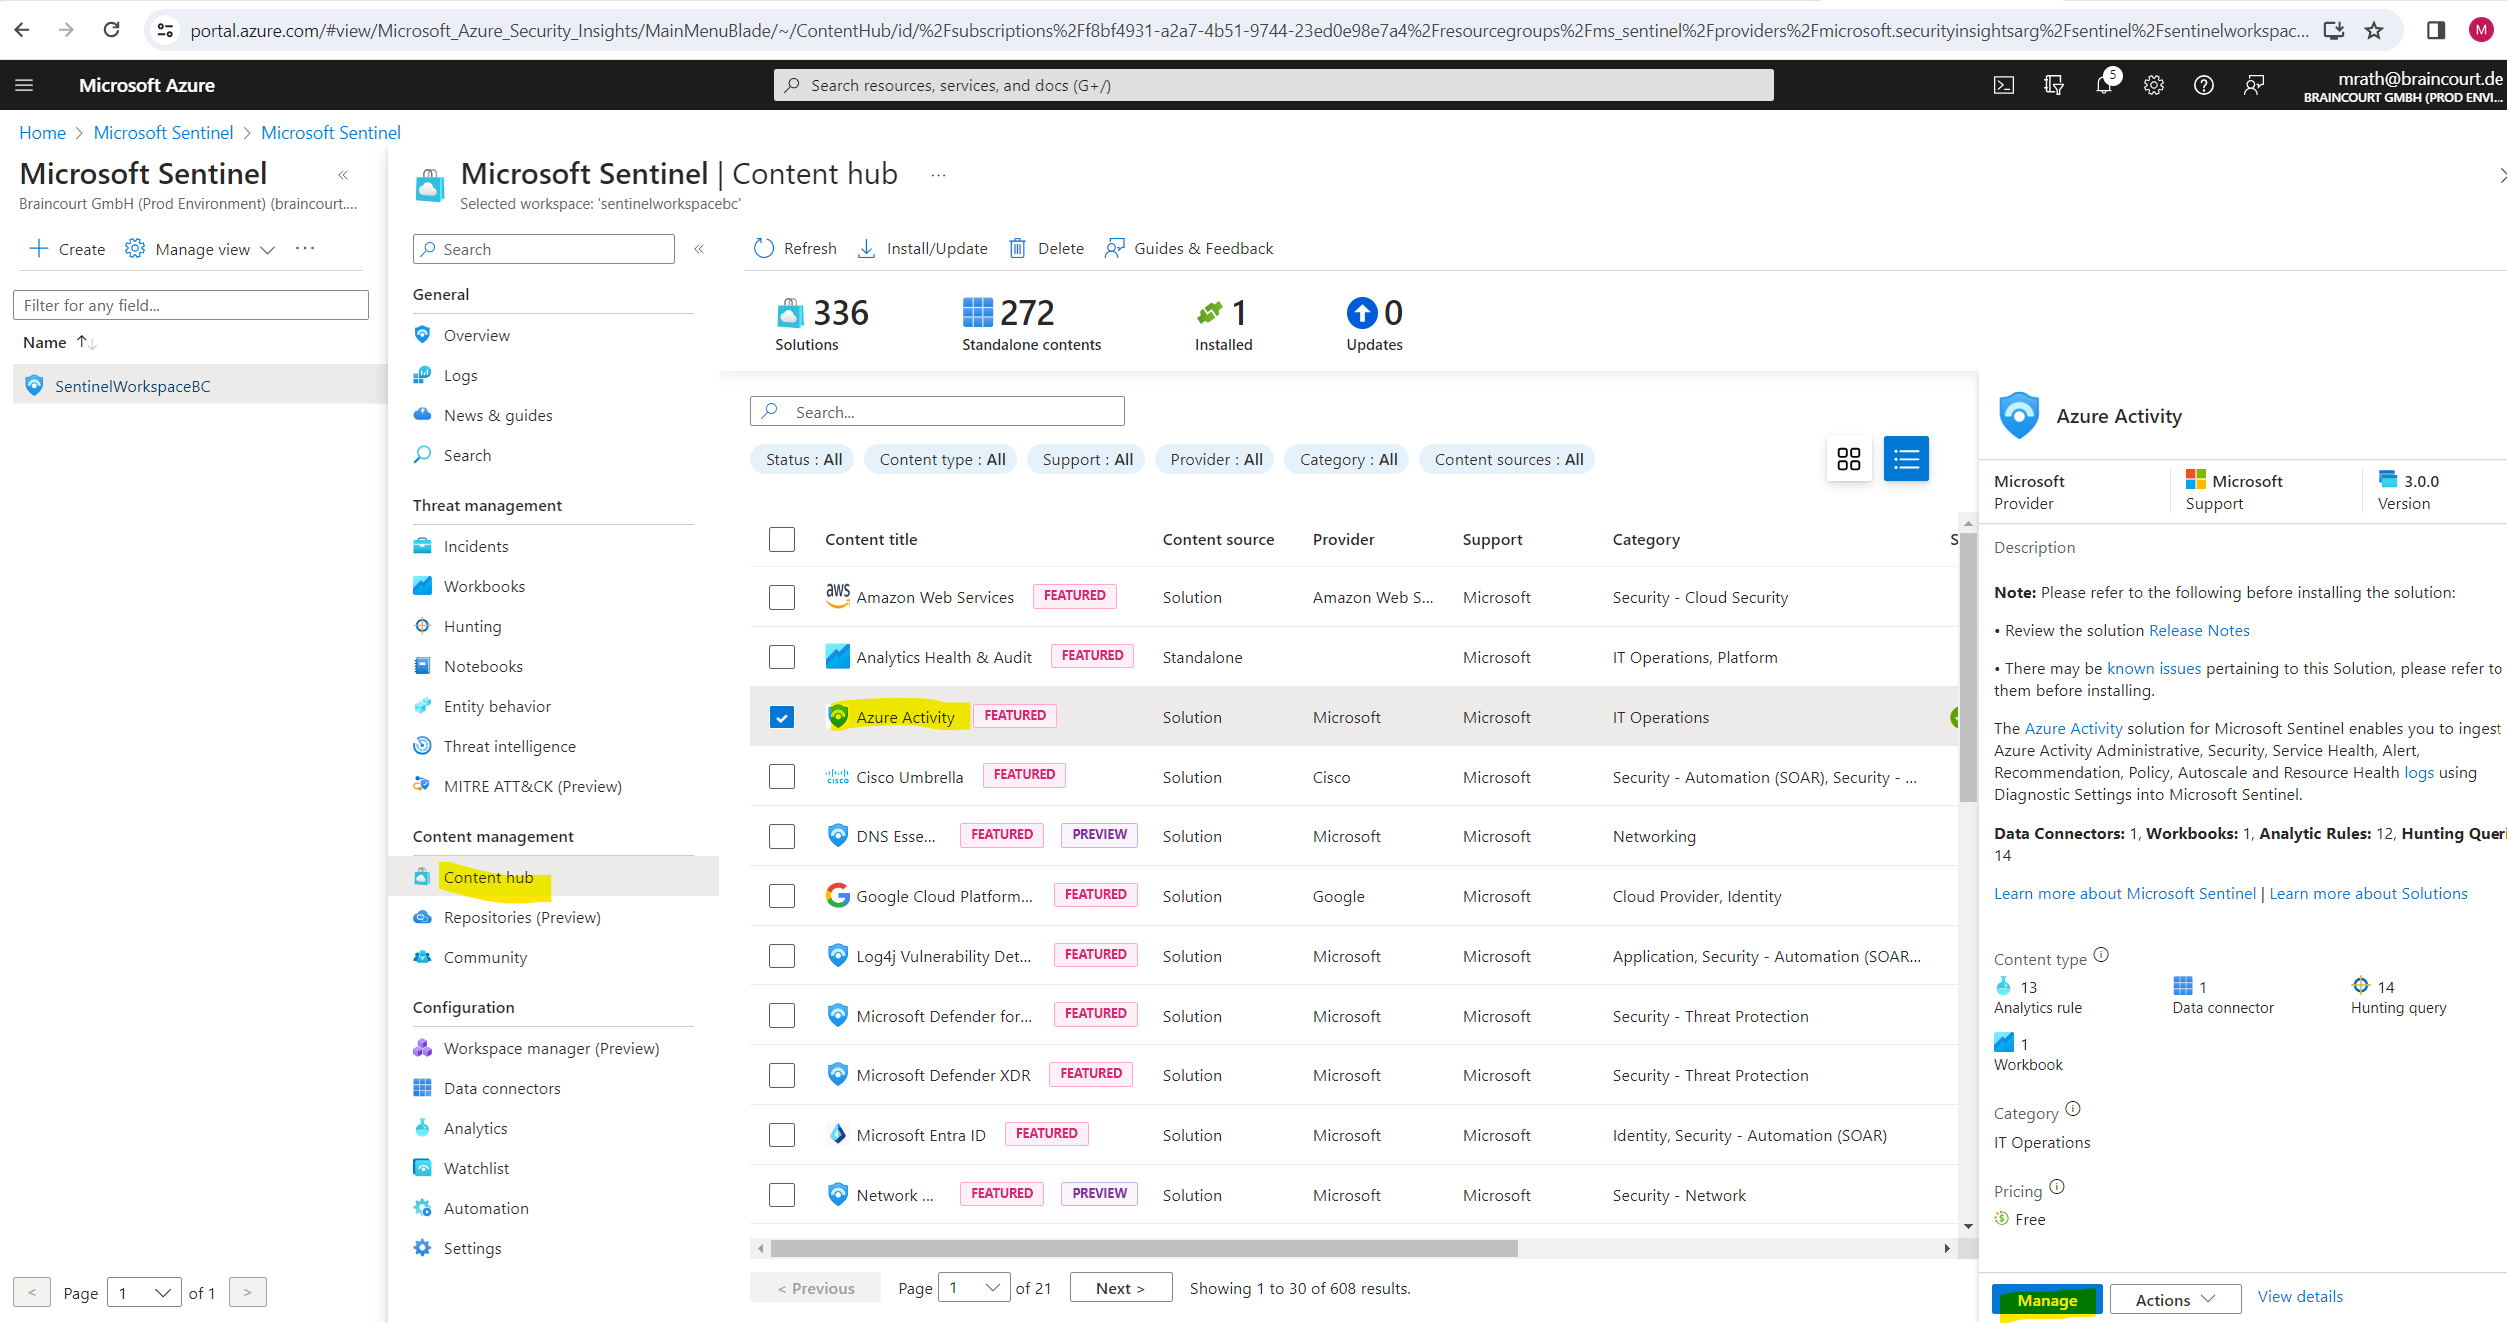
In Microsoft Sentinel, select Content hub.
Find and select the Azure Activity solution.
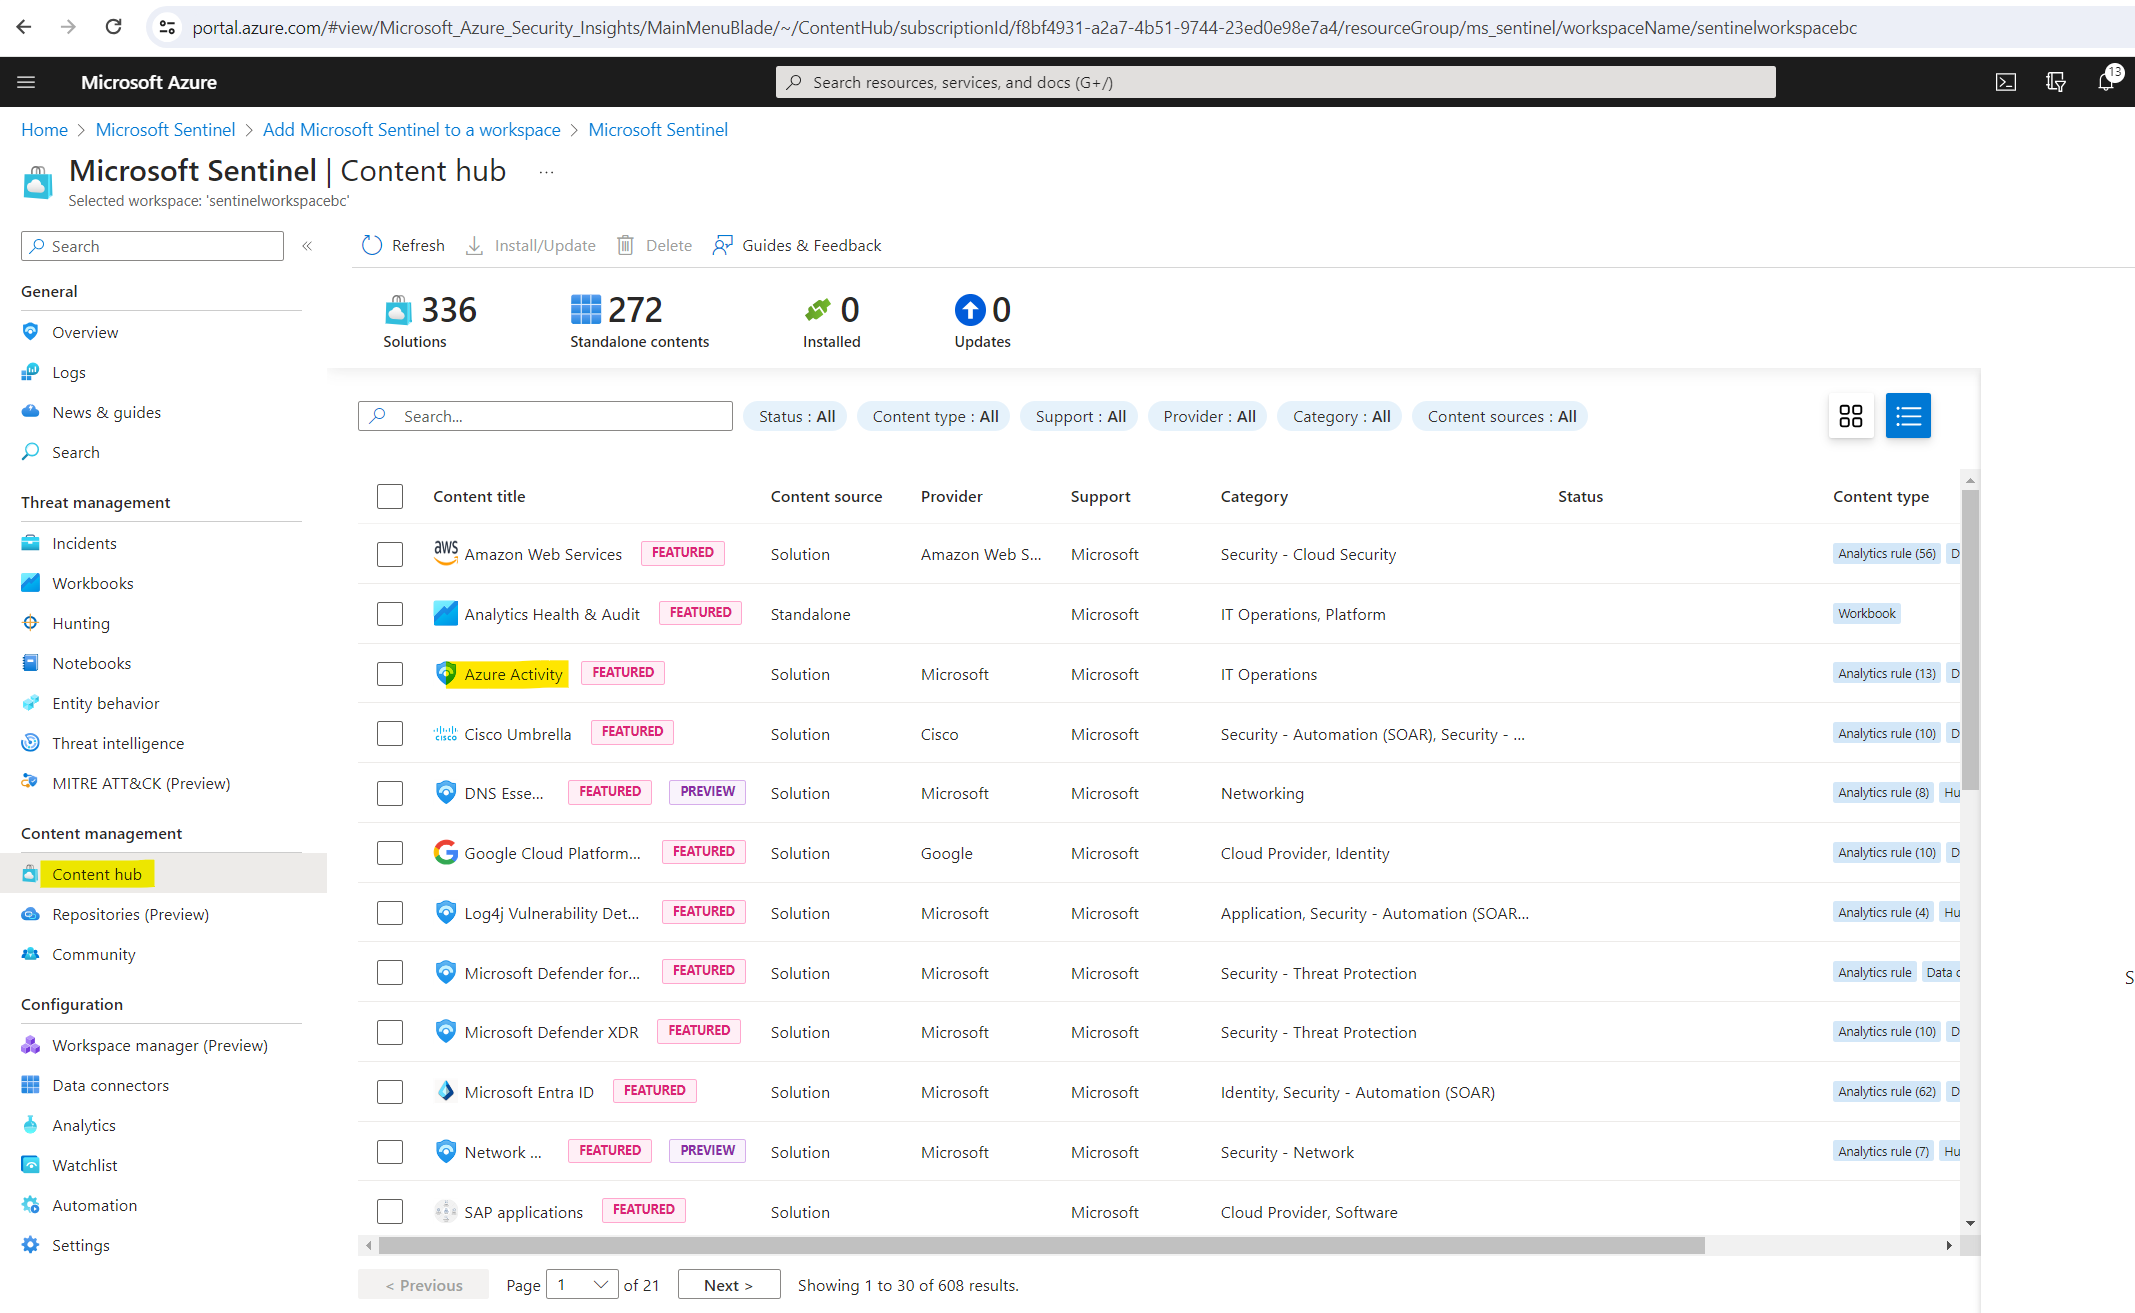
On the toolbar at the top of the page, select Install/Update.
Set up the data connector
As mentioned Microsoft Sentinel ingests data from different services and apps by connecting to these service and forwarding the events and logs from directly into Microsoft Sentinel. Below we will set up the data connector included in the Azure Activity solution in order to forward these data to Microsoft Sentinel.
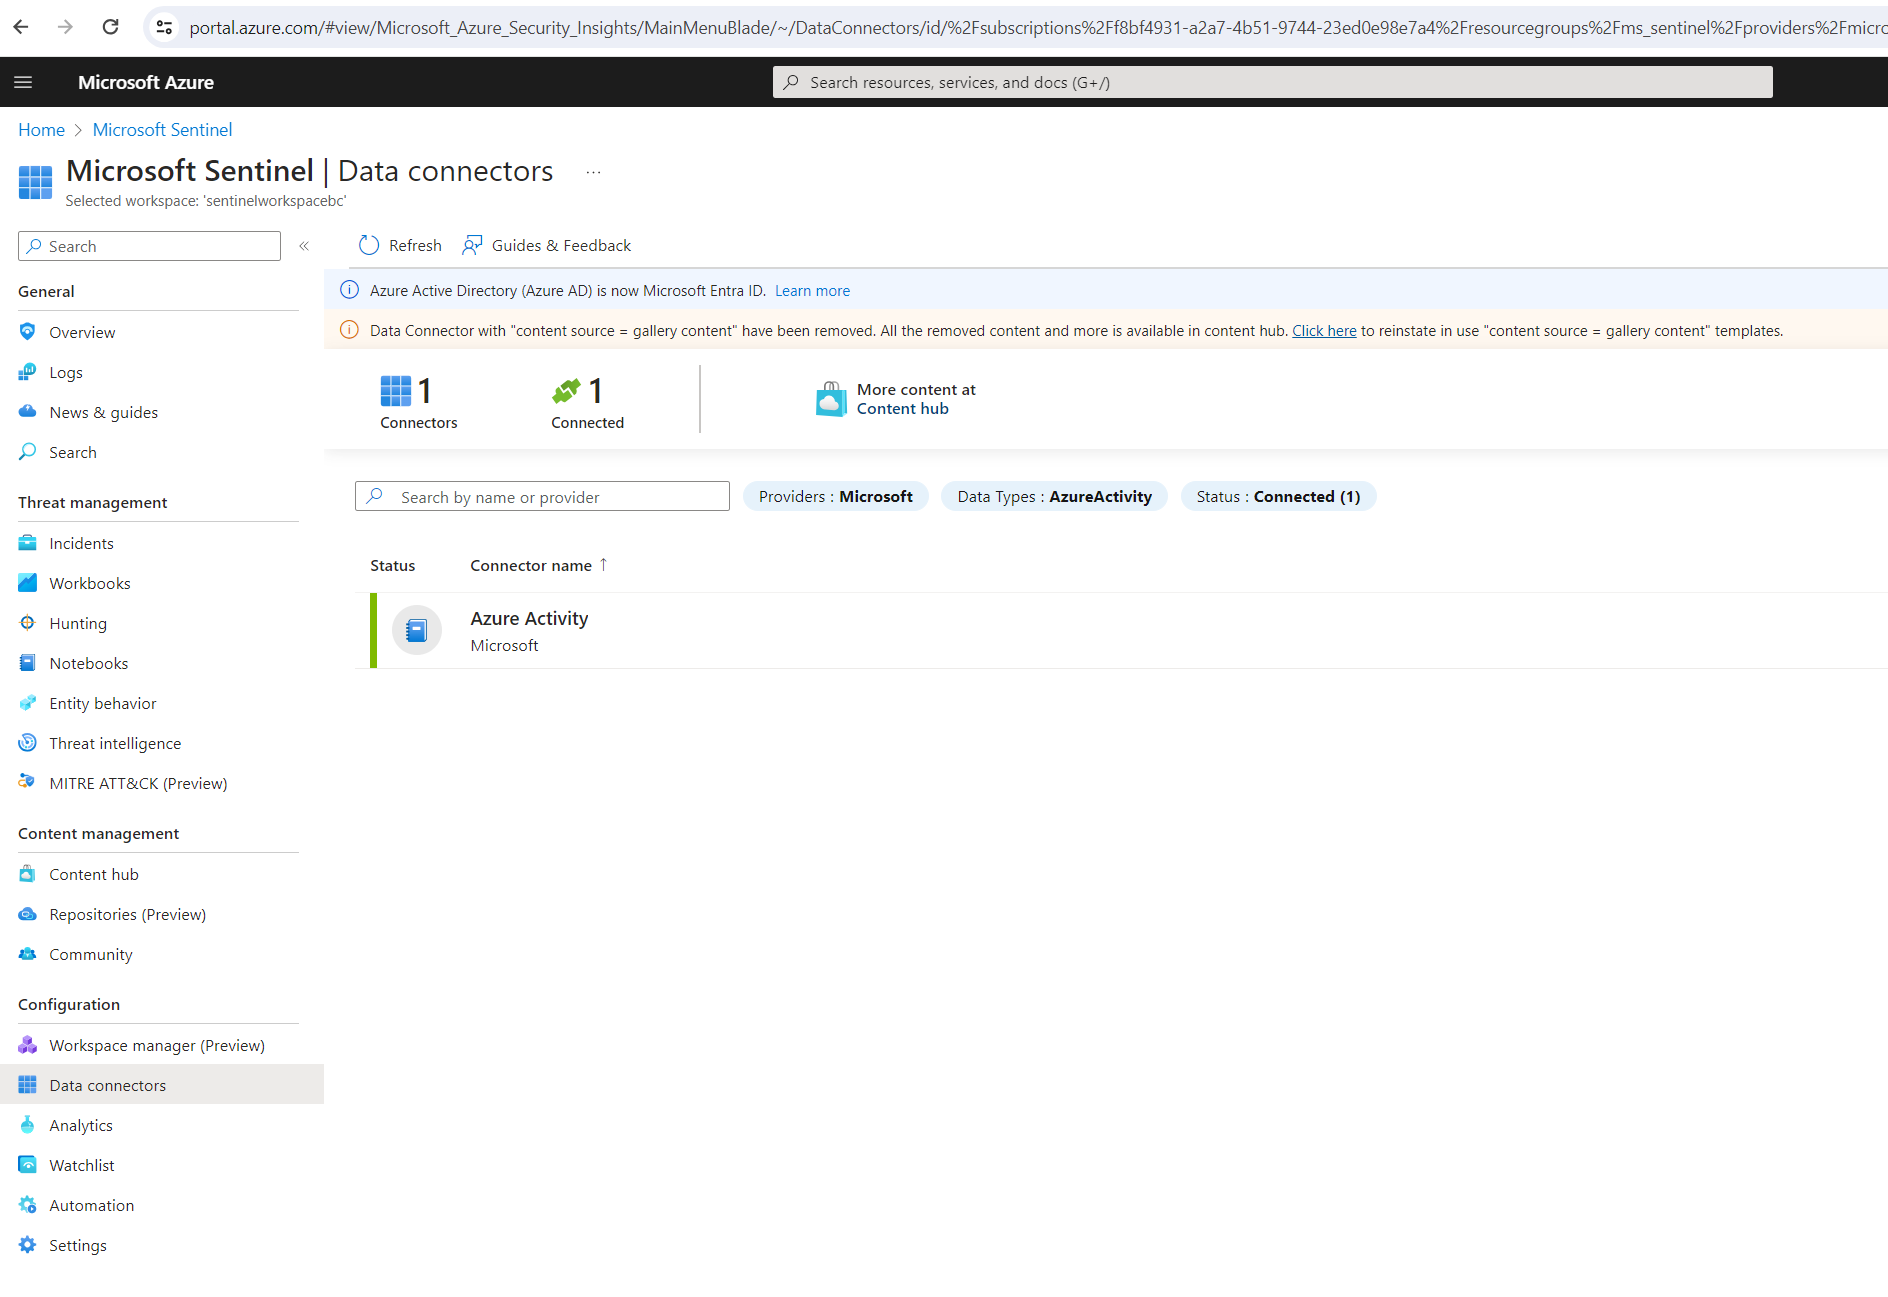
In Microsoft Sentinel, select Data connectors.
Search for and select the Azure Activity data connector installed along with the solution previously.
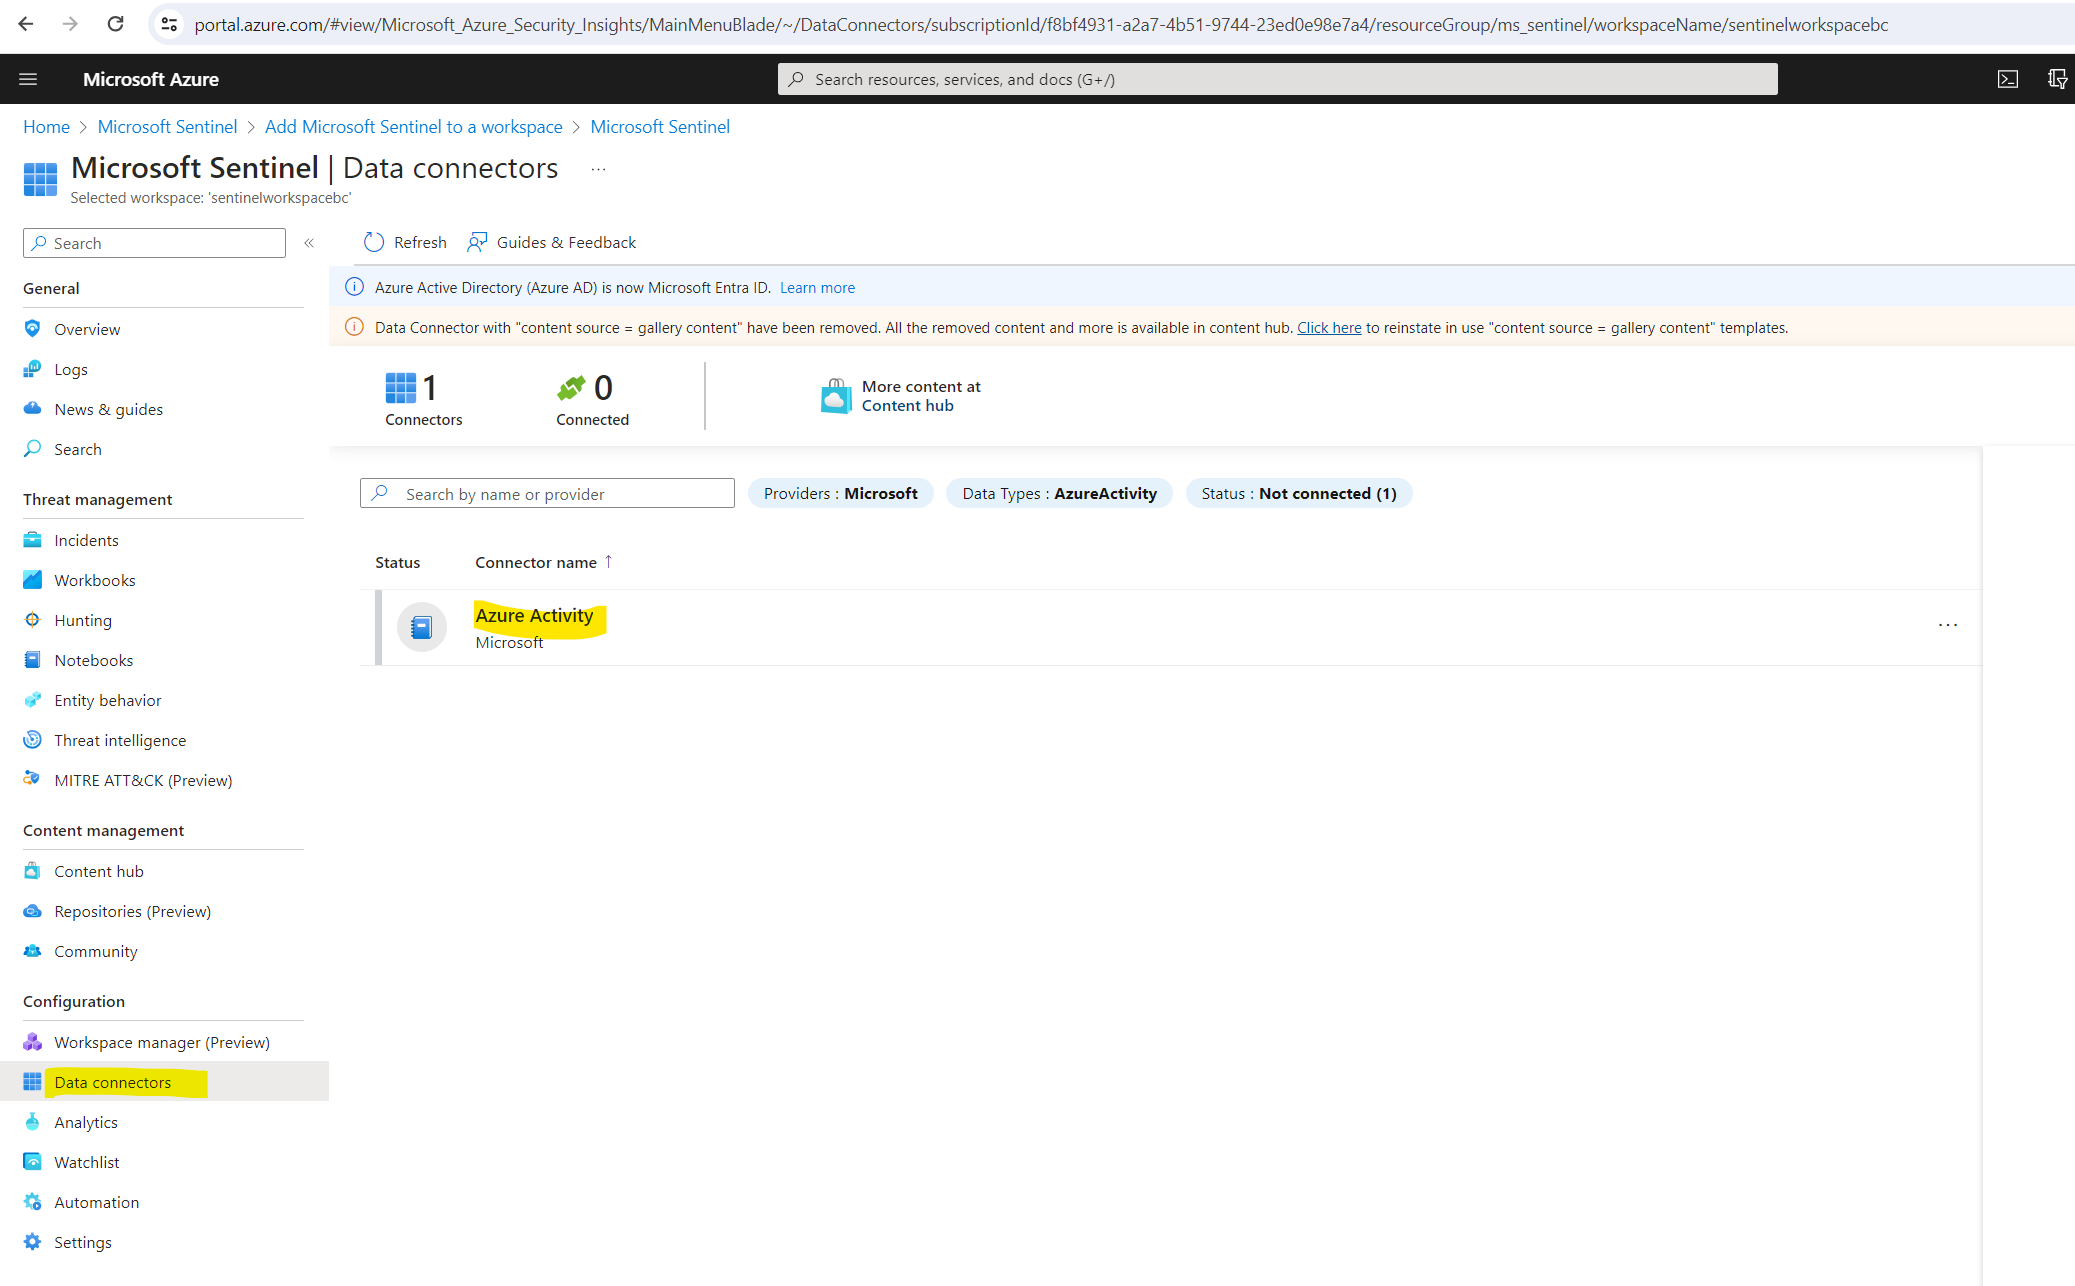
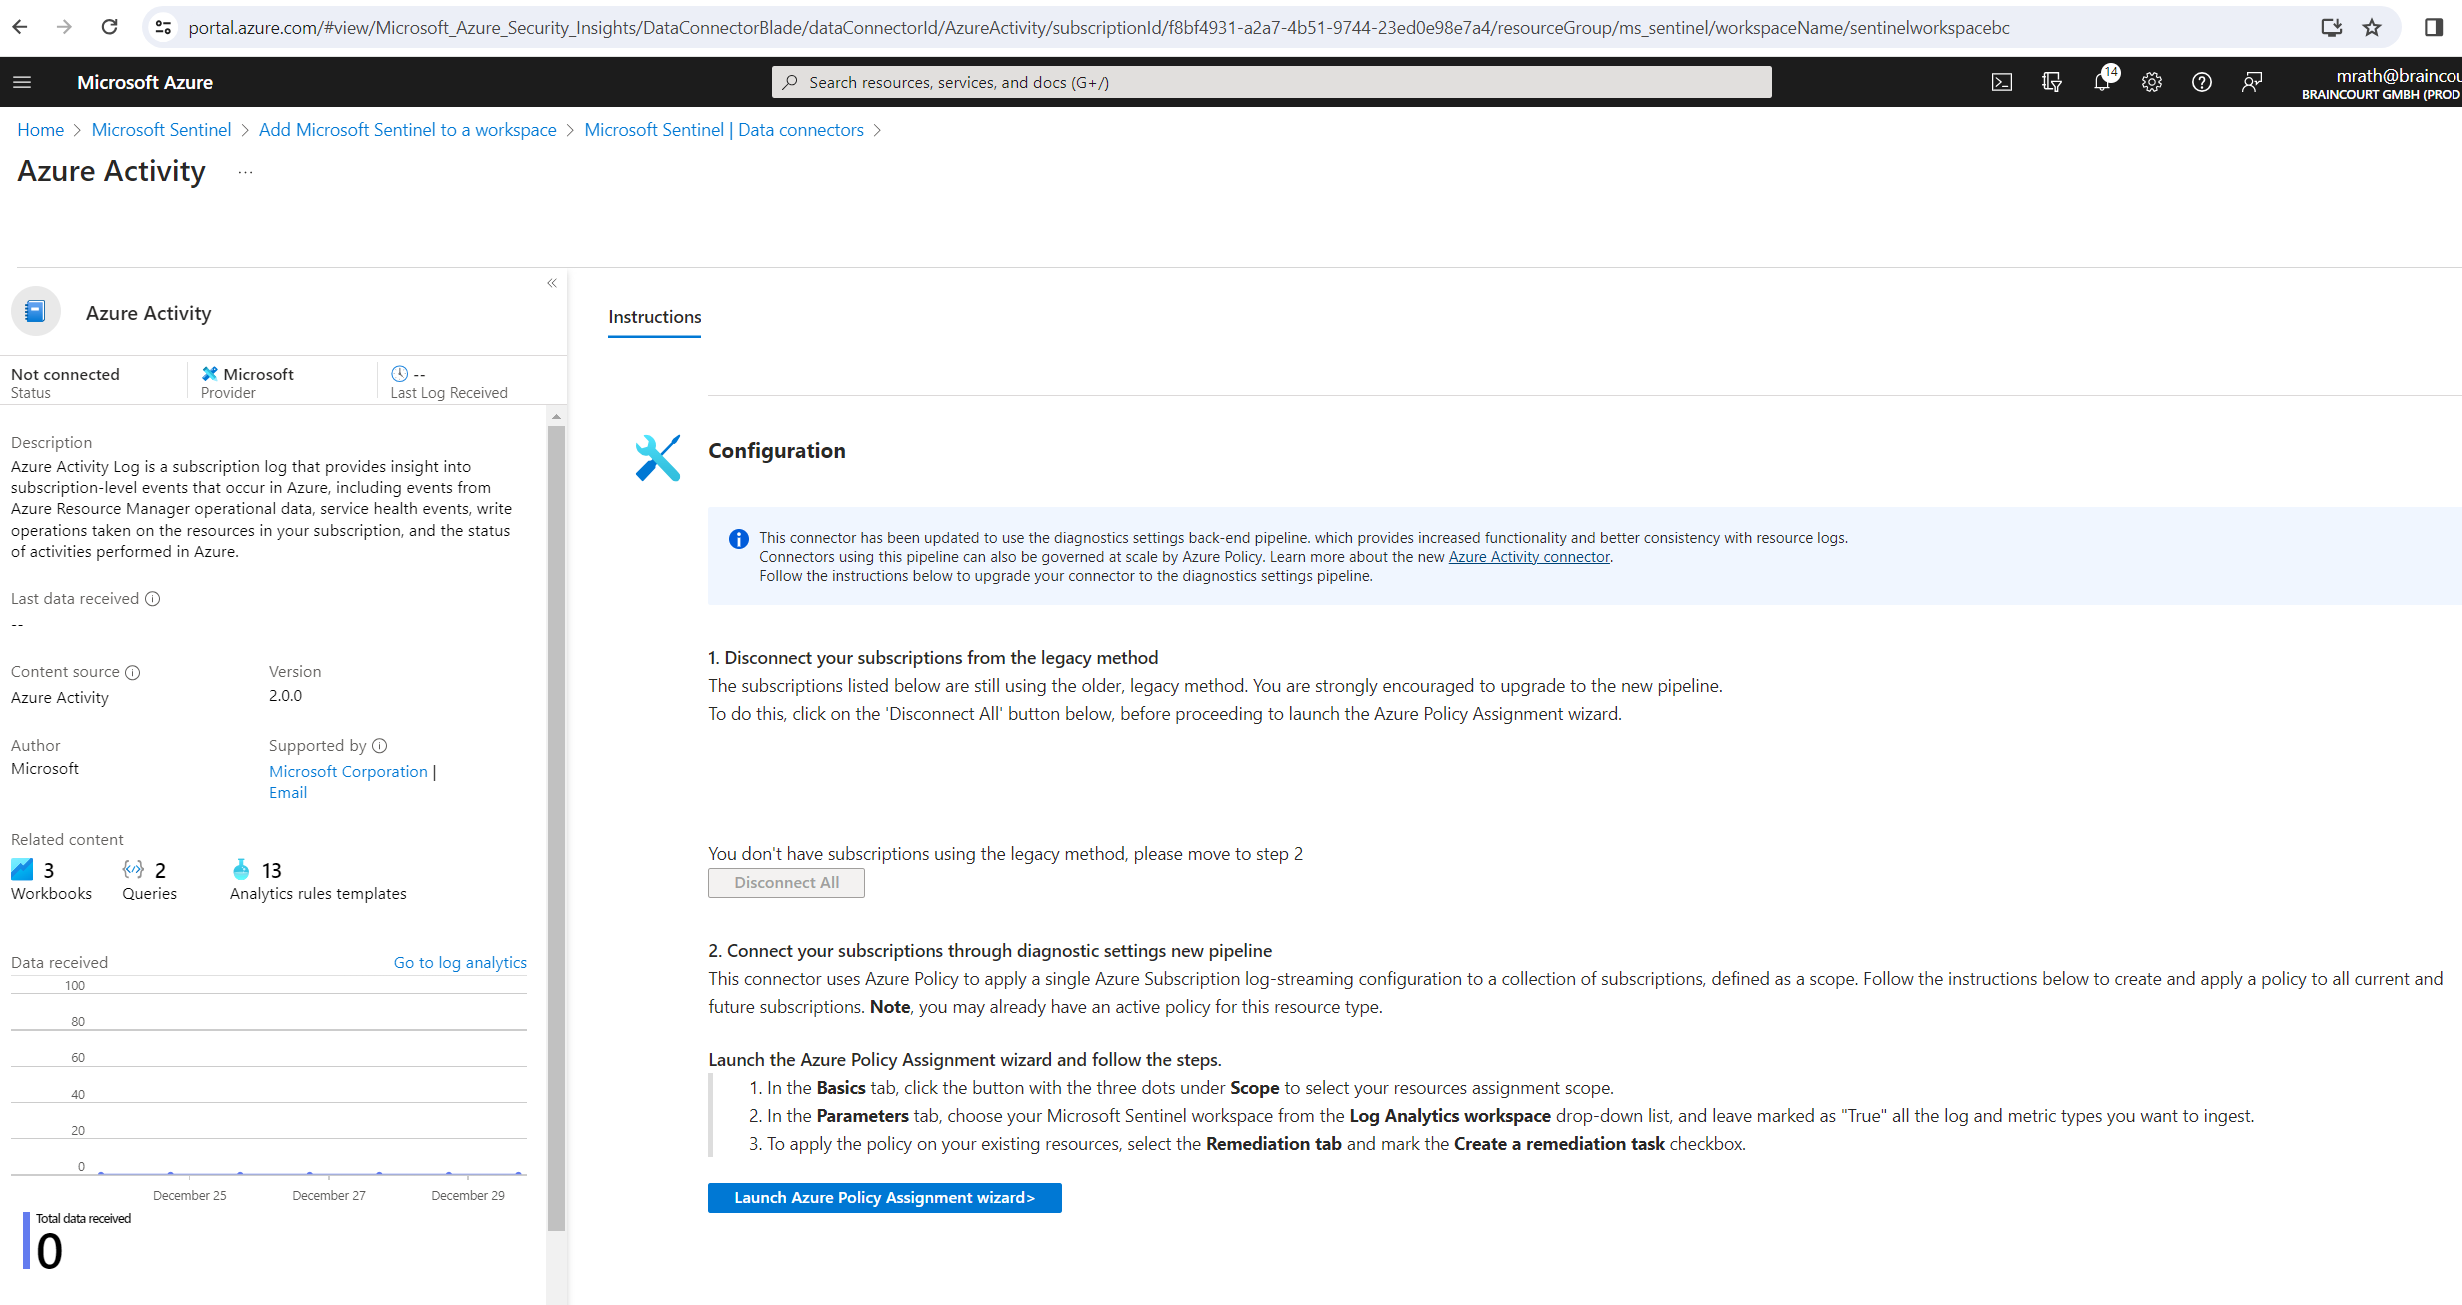
In the details pane for the connector, select Open connector page. Review the instructions to configure the connector
Select Launch Azure Policy Assignment Wizard.
Depending on the solution and data connector you will install, the set up/configuration steps will differ.
On the Basics tab, set the Scope to the subscription and resource group that has activity to send to Microsoft Sentinel. For example, select the subscription that contains your Microsoft Sentinel instance.
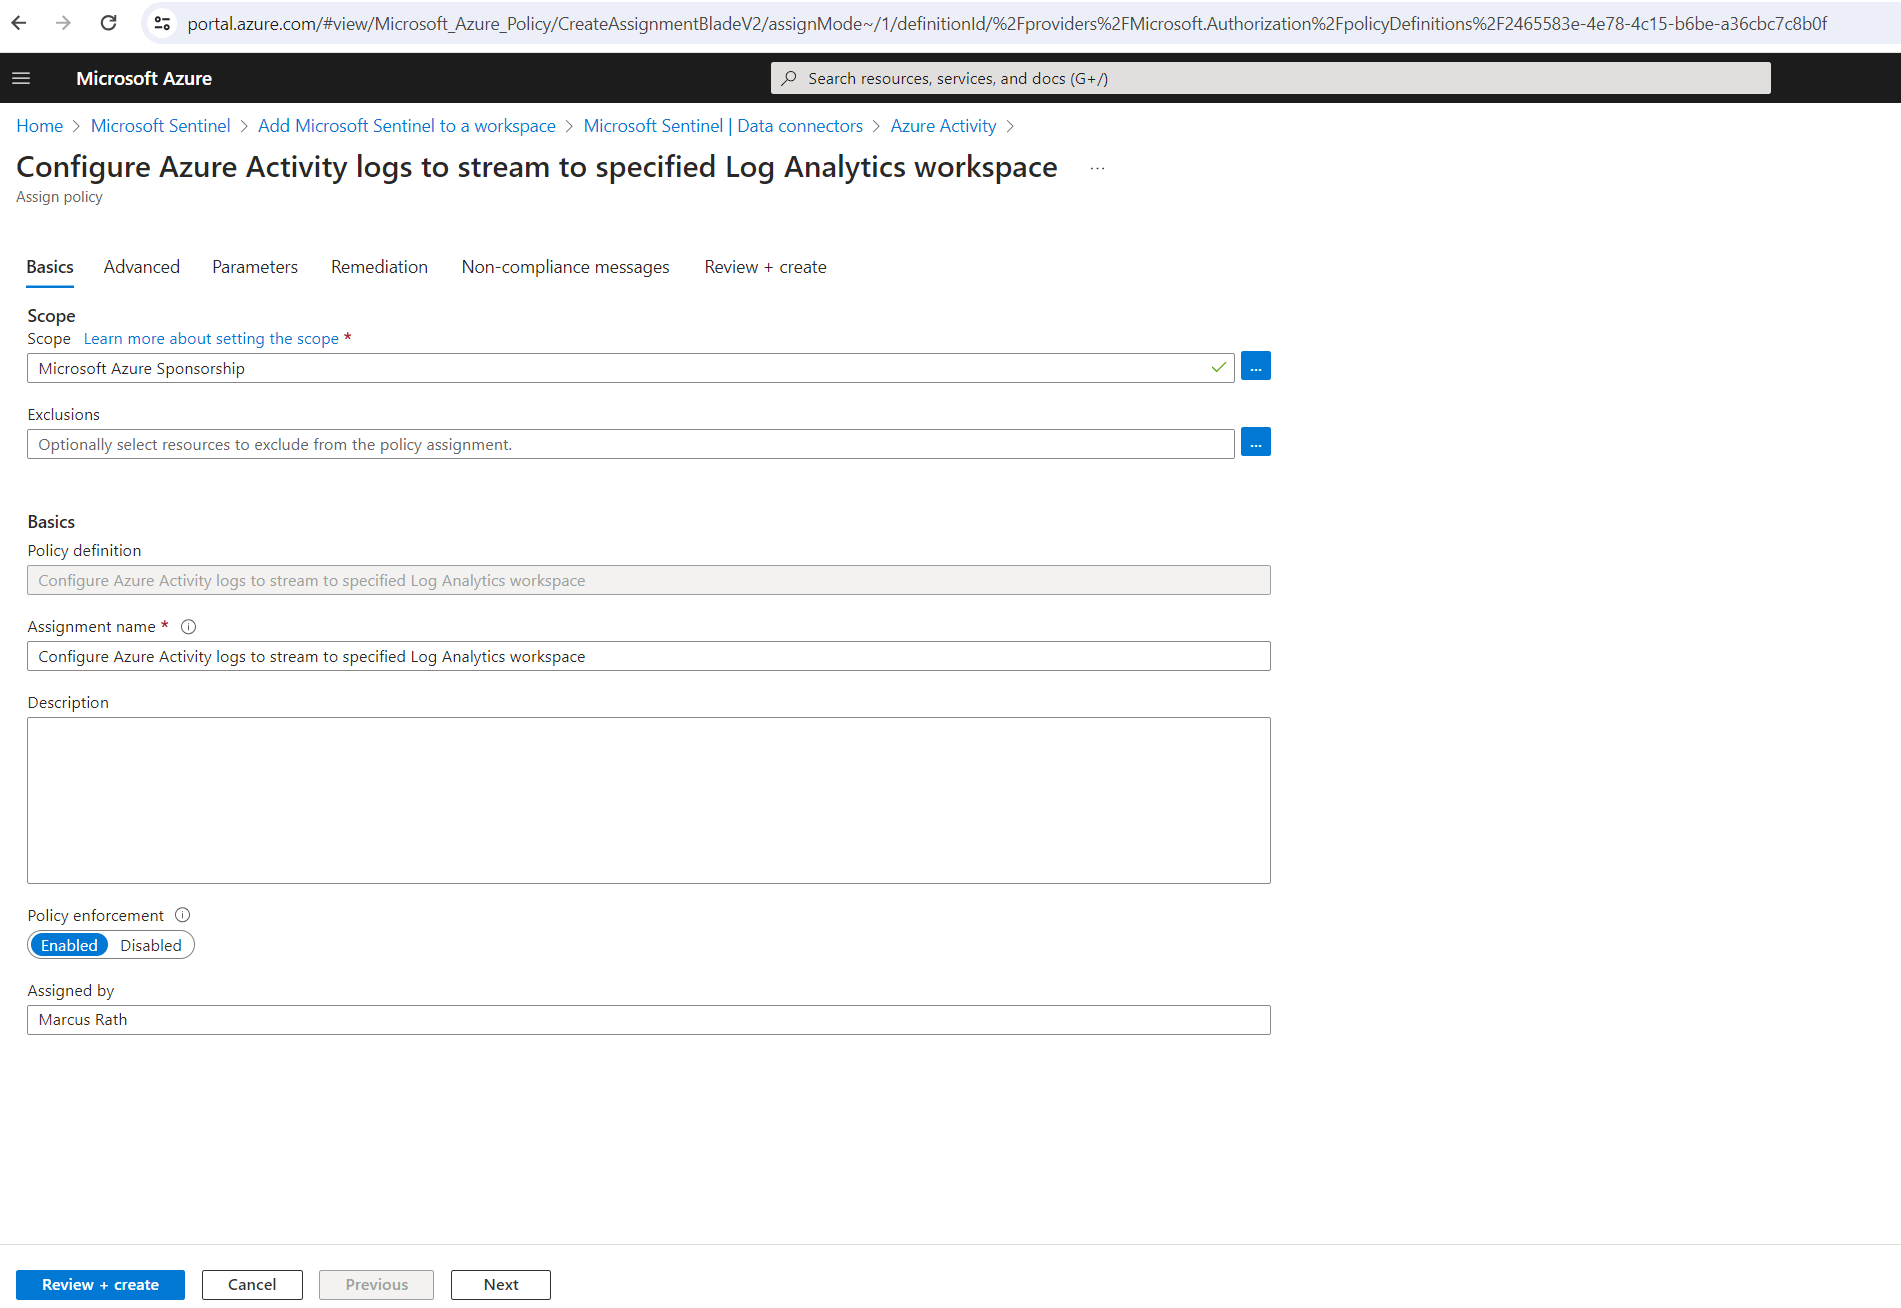
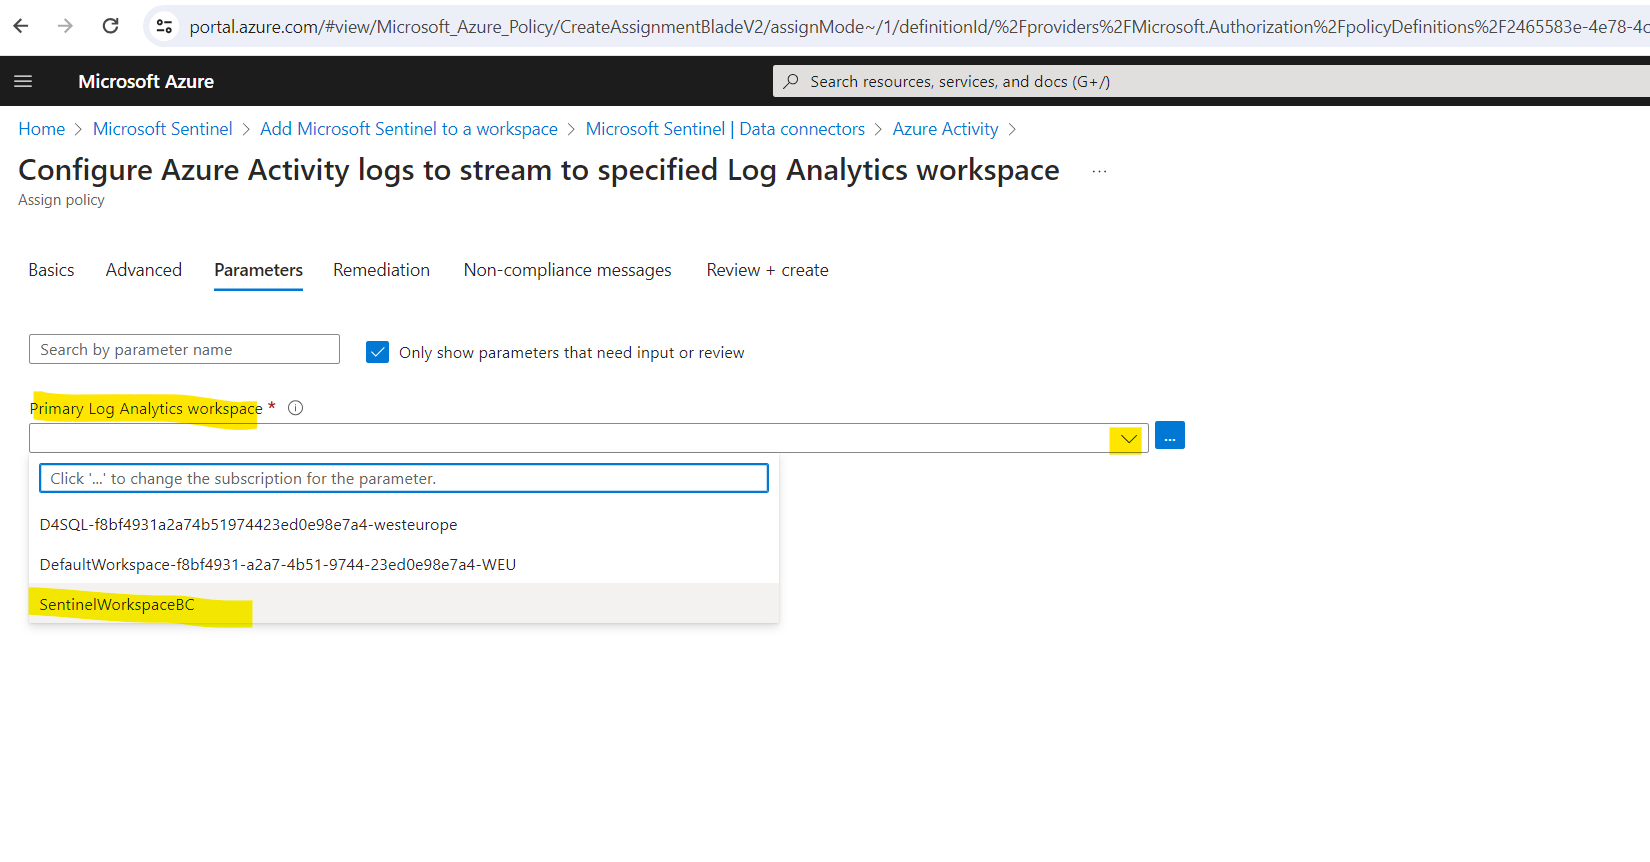
Select the Parameters tab.
Set the Primary Log Analytics workspace. This should be the workspace where Microsoft Sentinel is installed.
By default, this assignment will only take effect on newly created resources. Existing resources can be updated via a remediation task after the policy is assigned. For deployIfNotExists policies, the remediation task will deploy the specified template. For modify policies, the remediation task will edit tags on the existing resources.
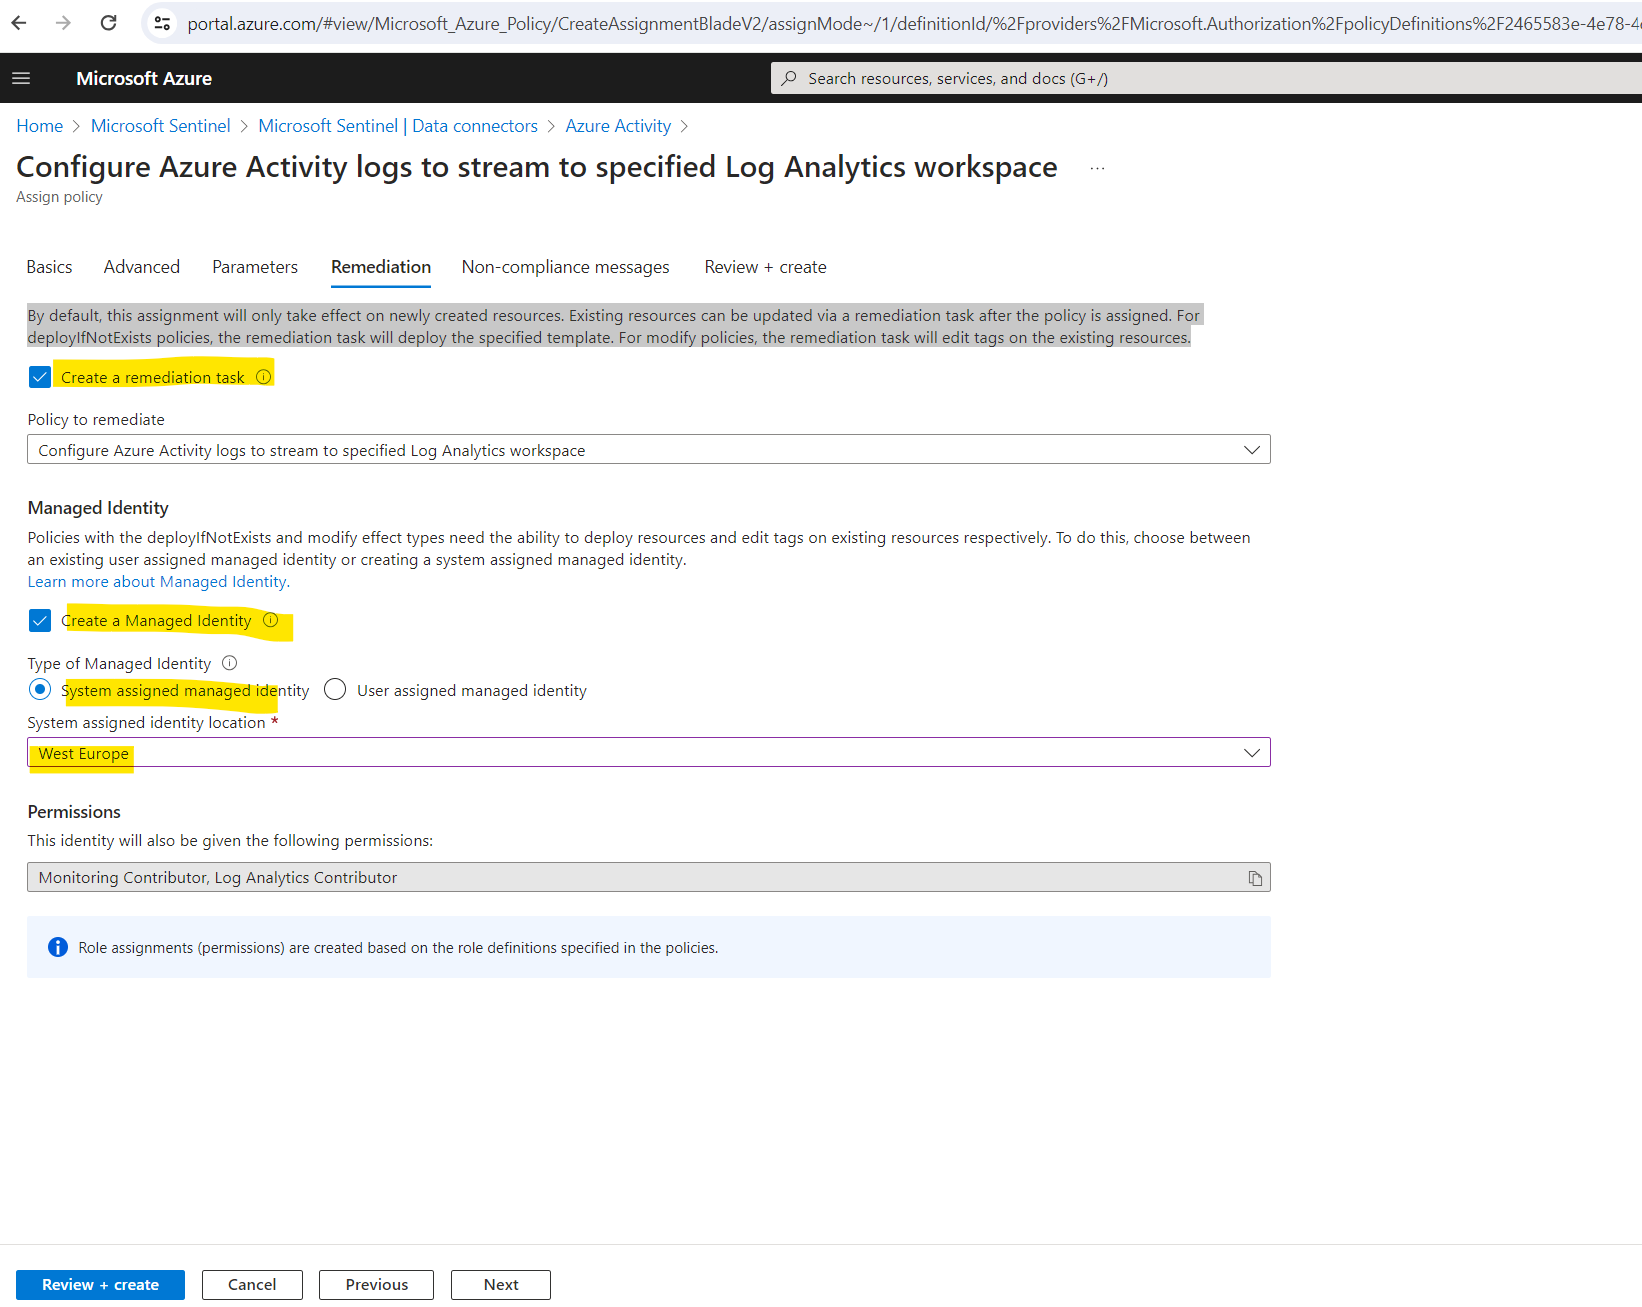
Finally select Review + create and Create.
Generate activity data
In order to test monitoring by using the Azure Activity logs, we will now first generate activity data by enabling a rule that is included in the Azure Activity solution for Microsoft Sentinel. This step also shows you how to manage content in the content hub.
In Microsoft Sentinel, select Content hub. Find and select the Azure Activity solution. From the right-hand side pane, select Manage.
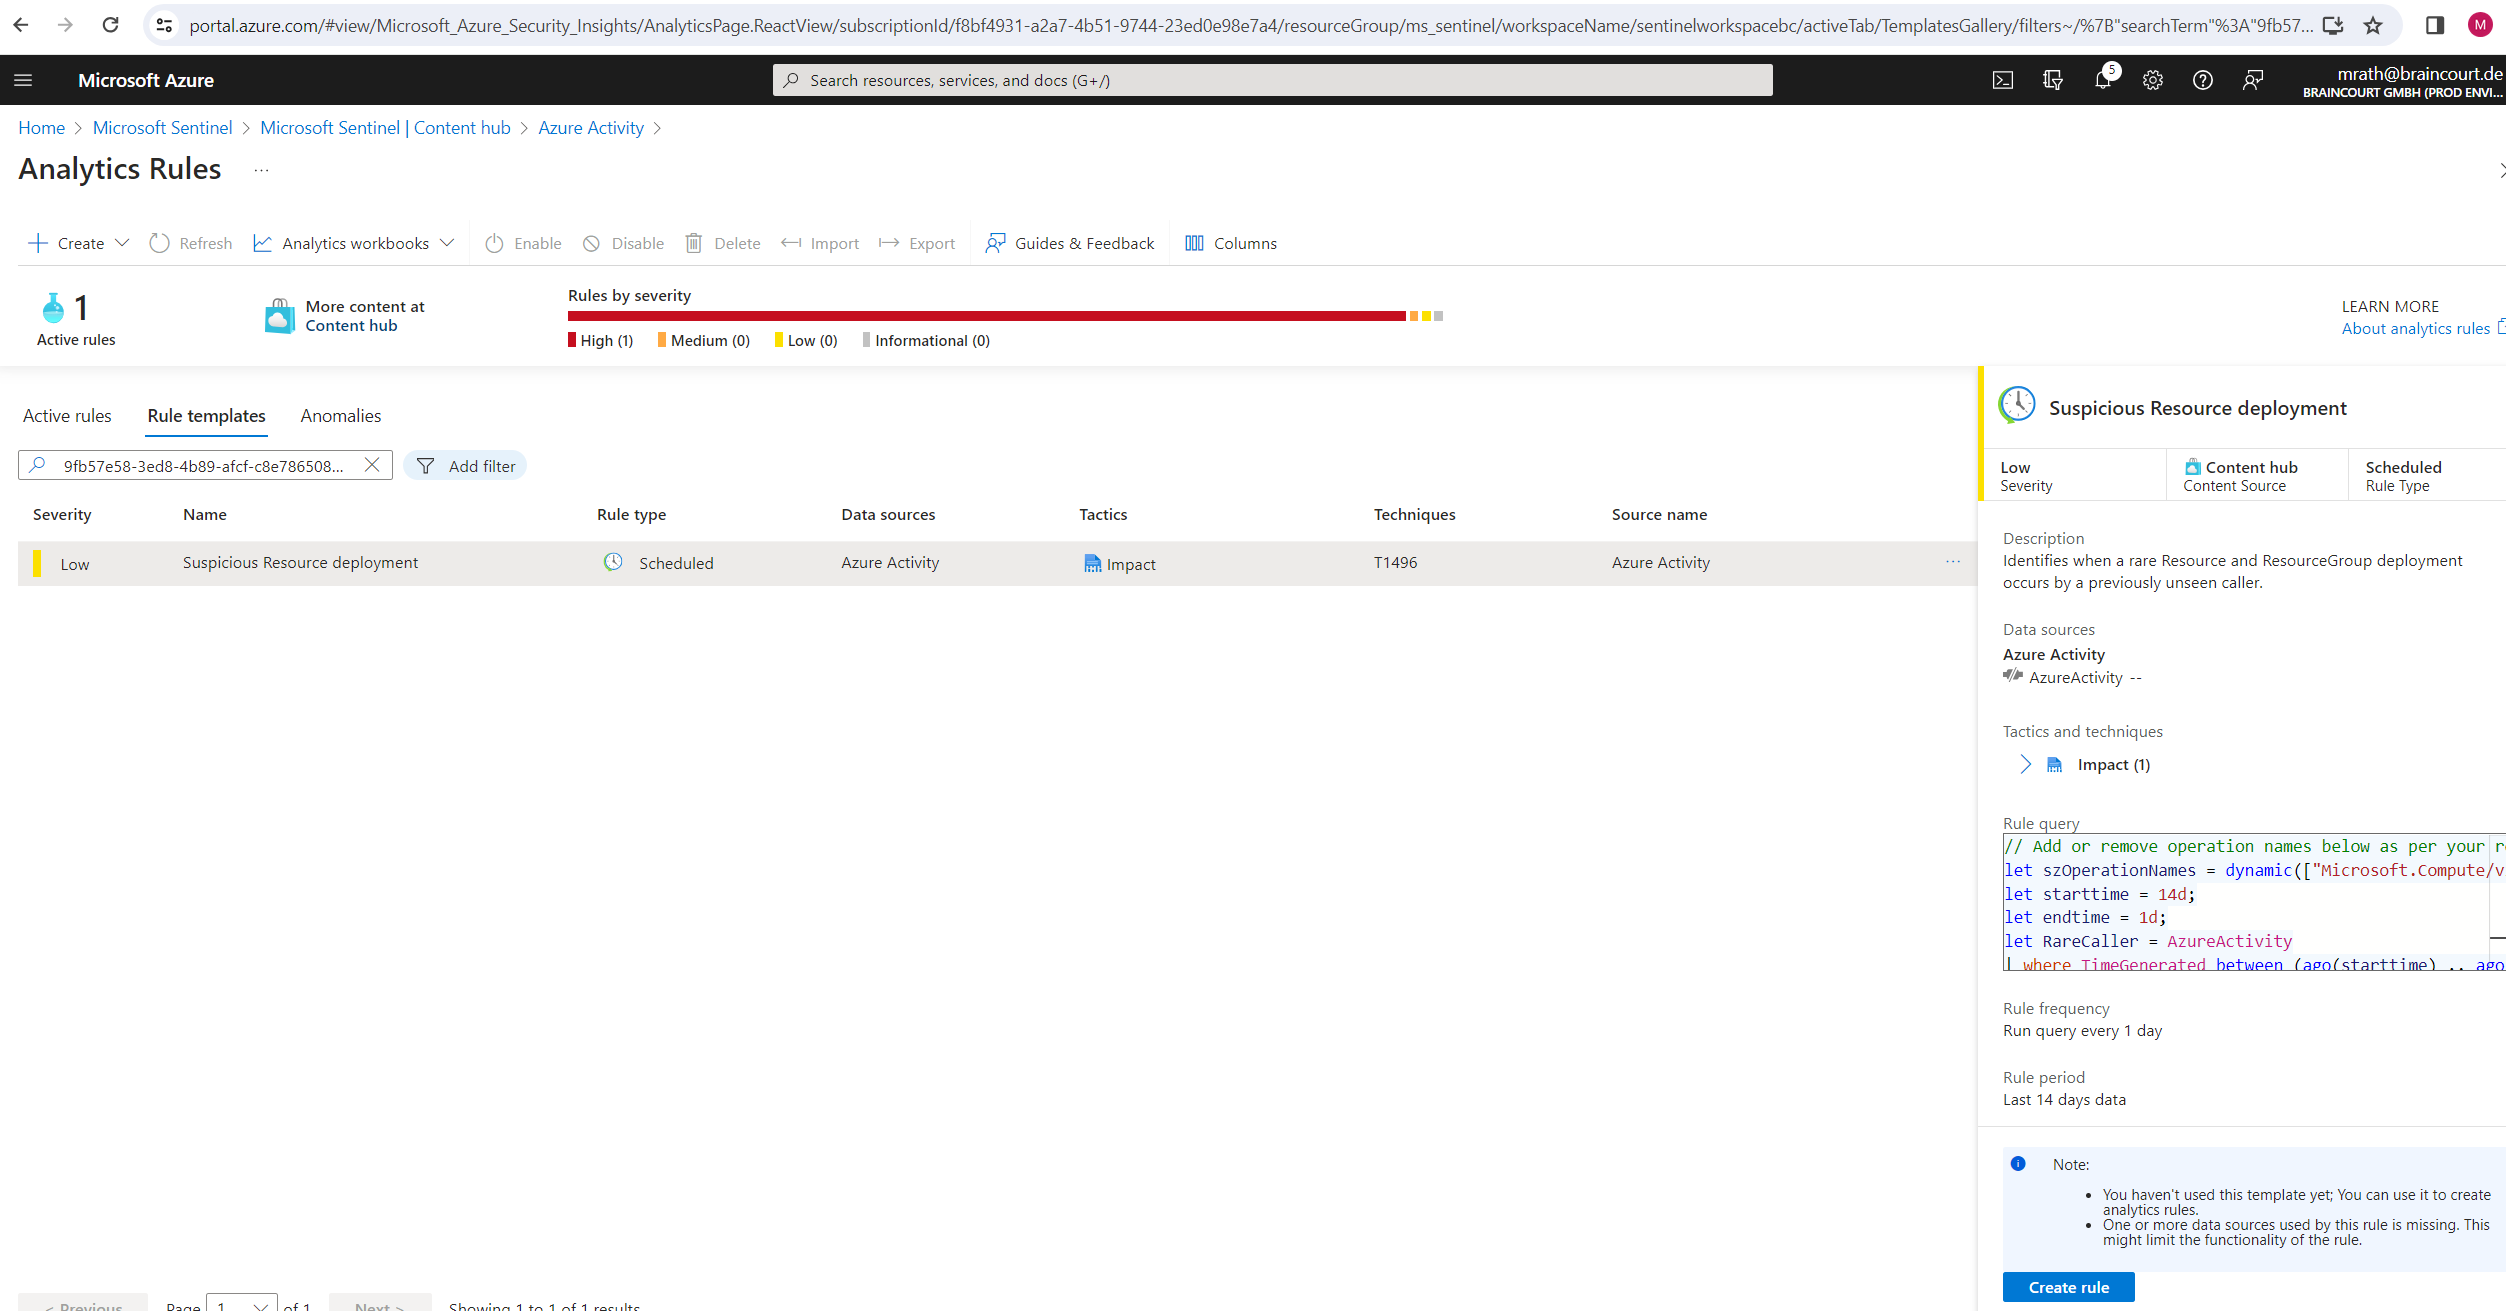
Find and select the rule template Suspicious Resource deployment.
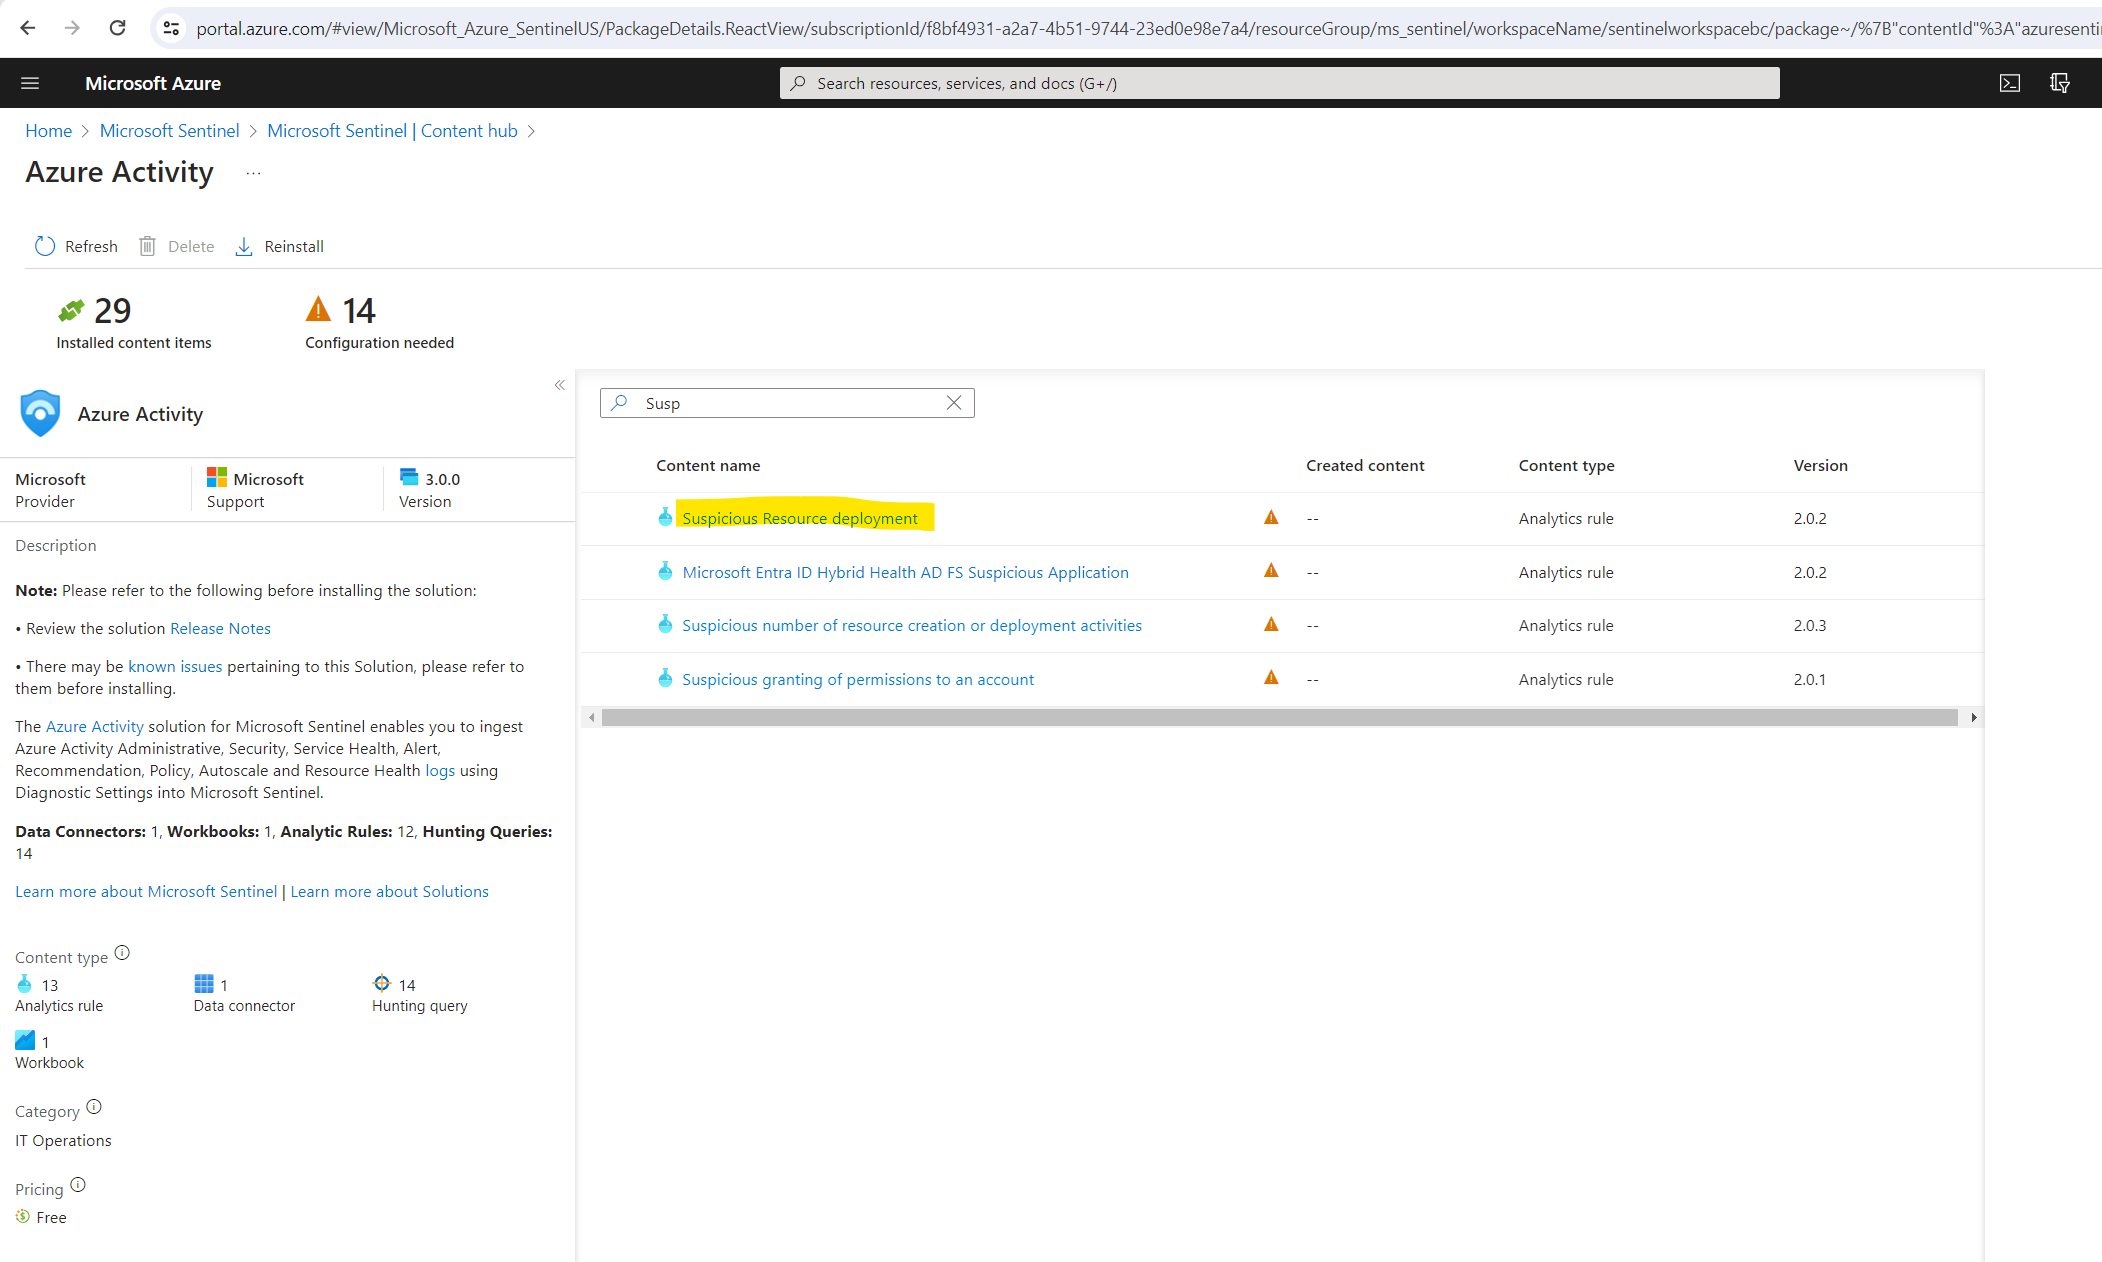
Select the rule and click on the button Create rule on the right bottom.
On the General tab, change the Status to enabled if not already pre-enabled. Leave the rest of the default values. Accept the defaults on the other tabs.
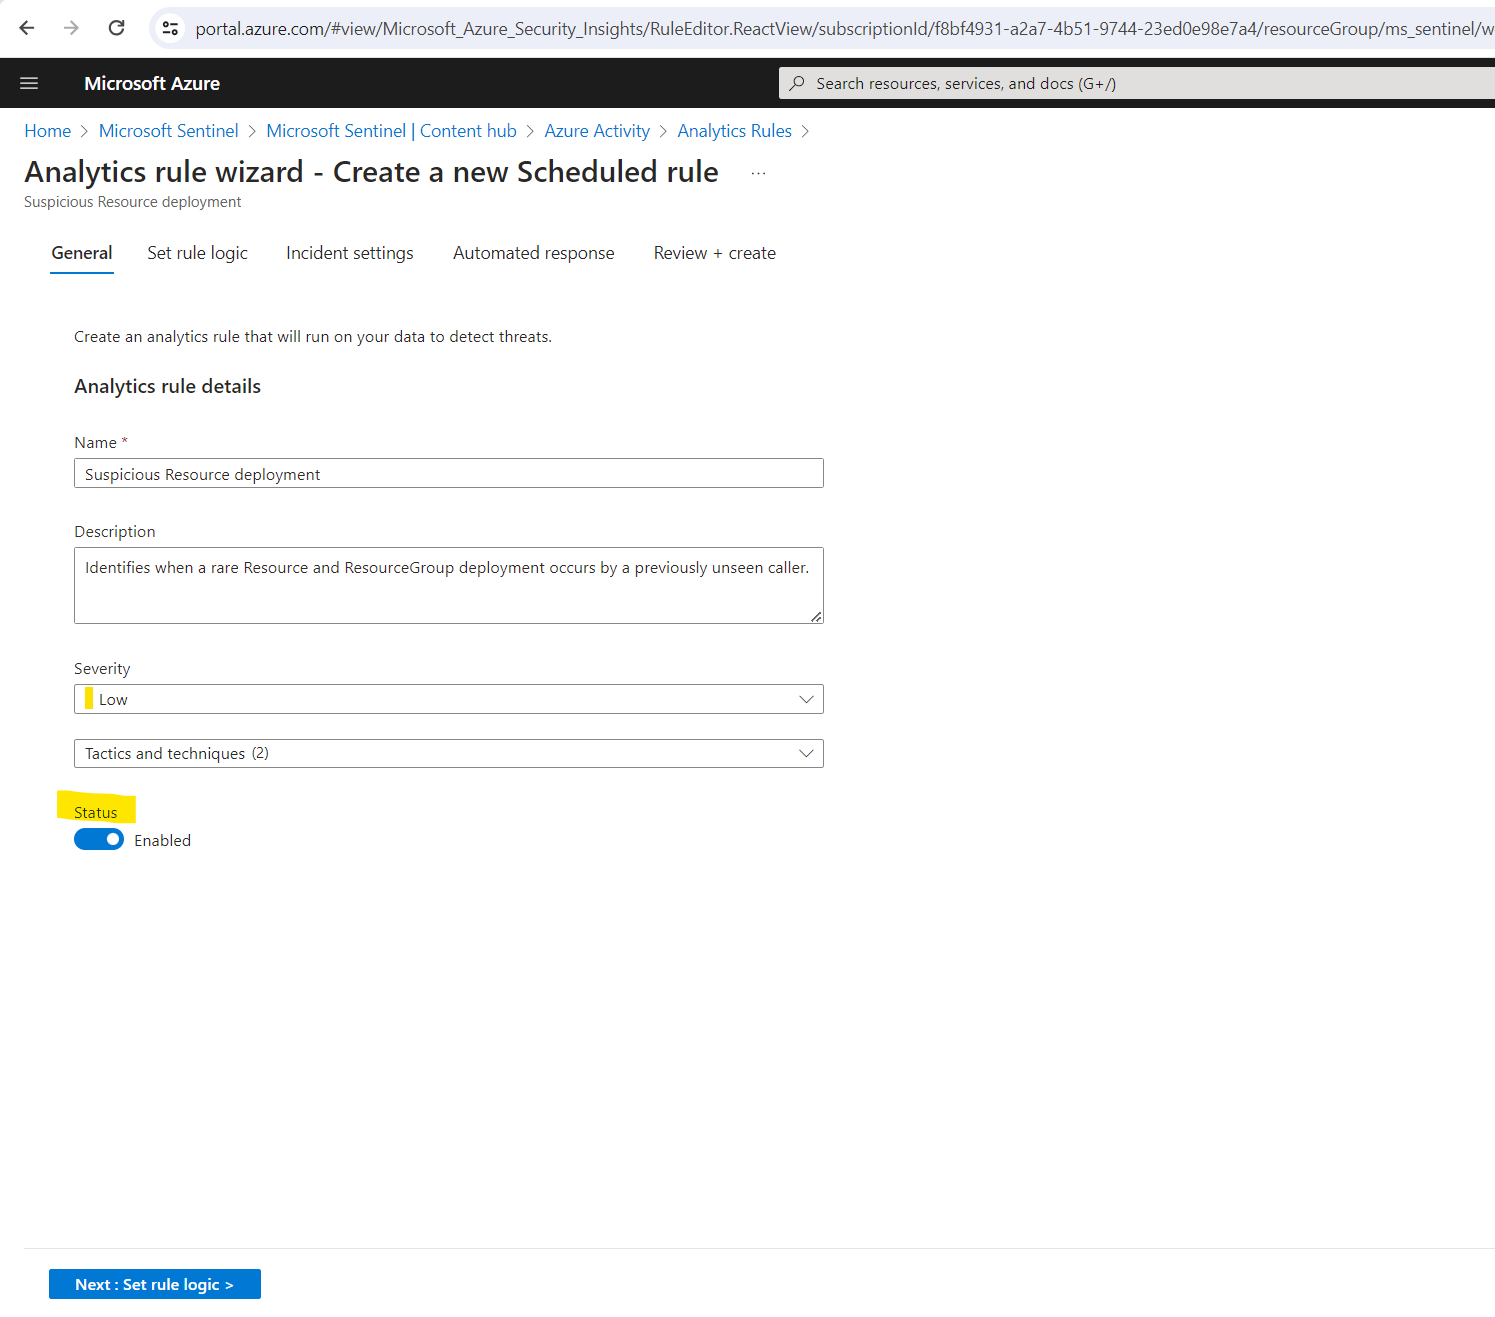
On the Review and create tab, select Create.
It can take up a few minutes till the data connector shown up as connected.
View data ingested into Microsoft Sentinel
Now that we’ve enabled the Azure Activity data connector and generated some activity data, we can now view the activity data added to our workspace.
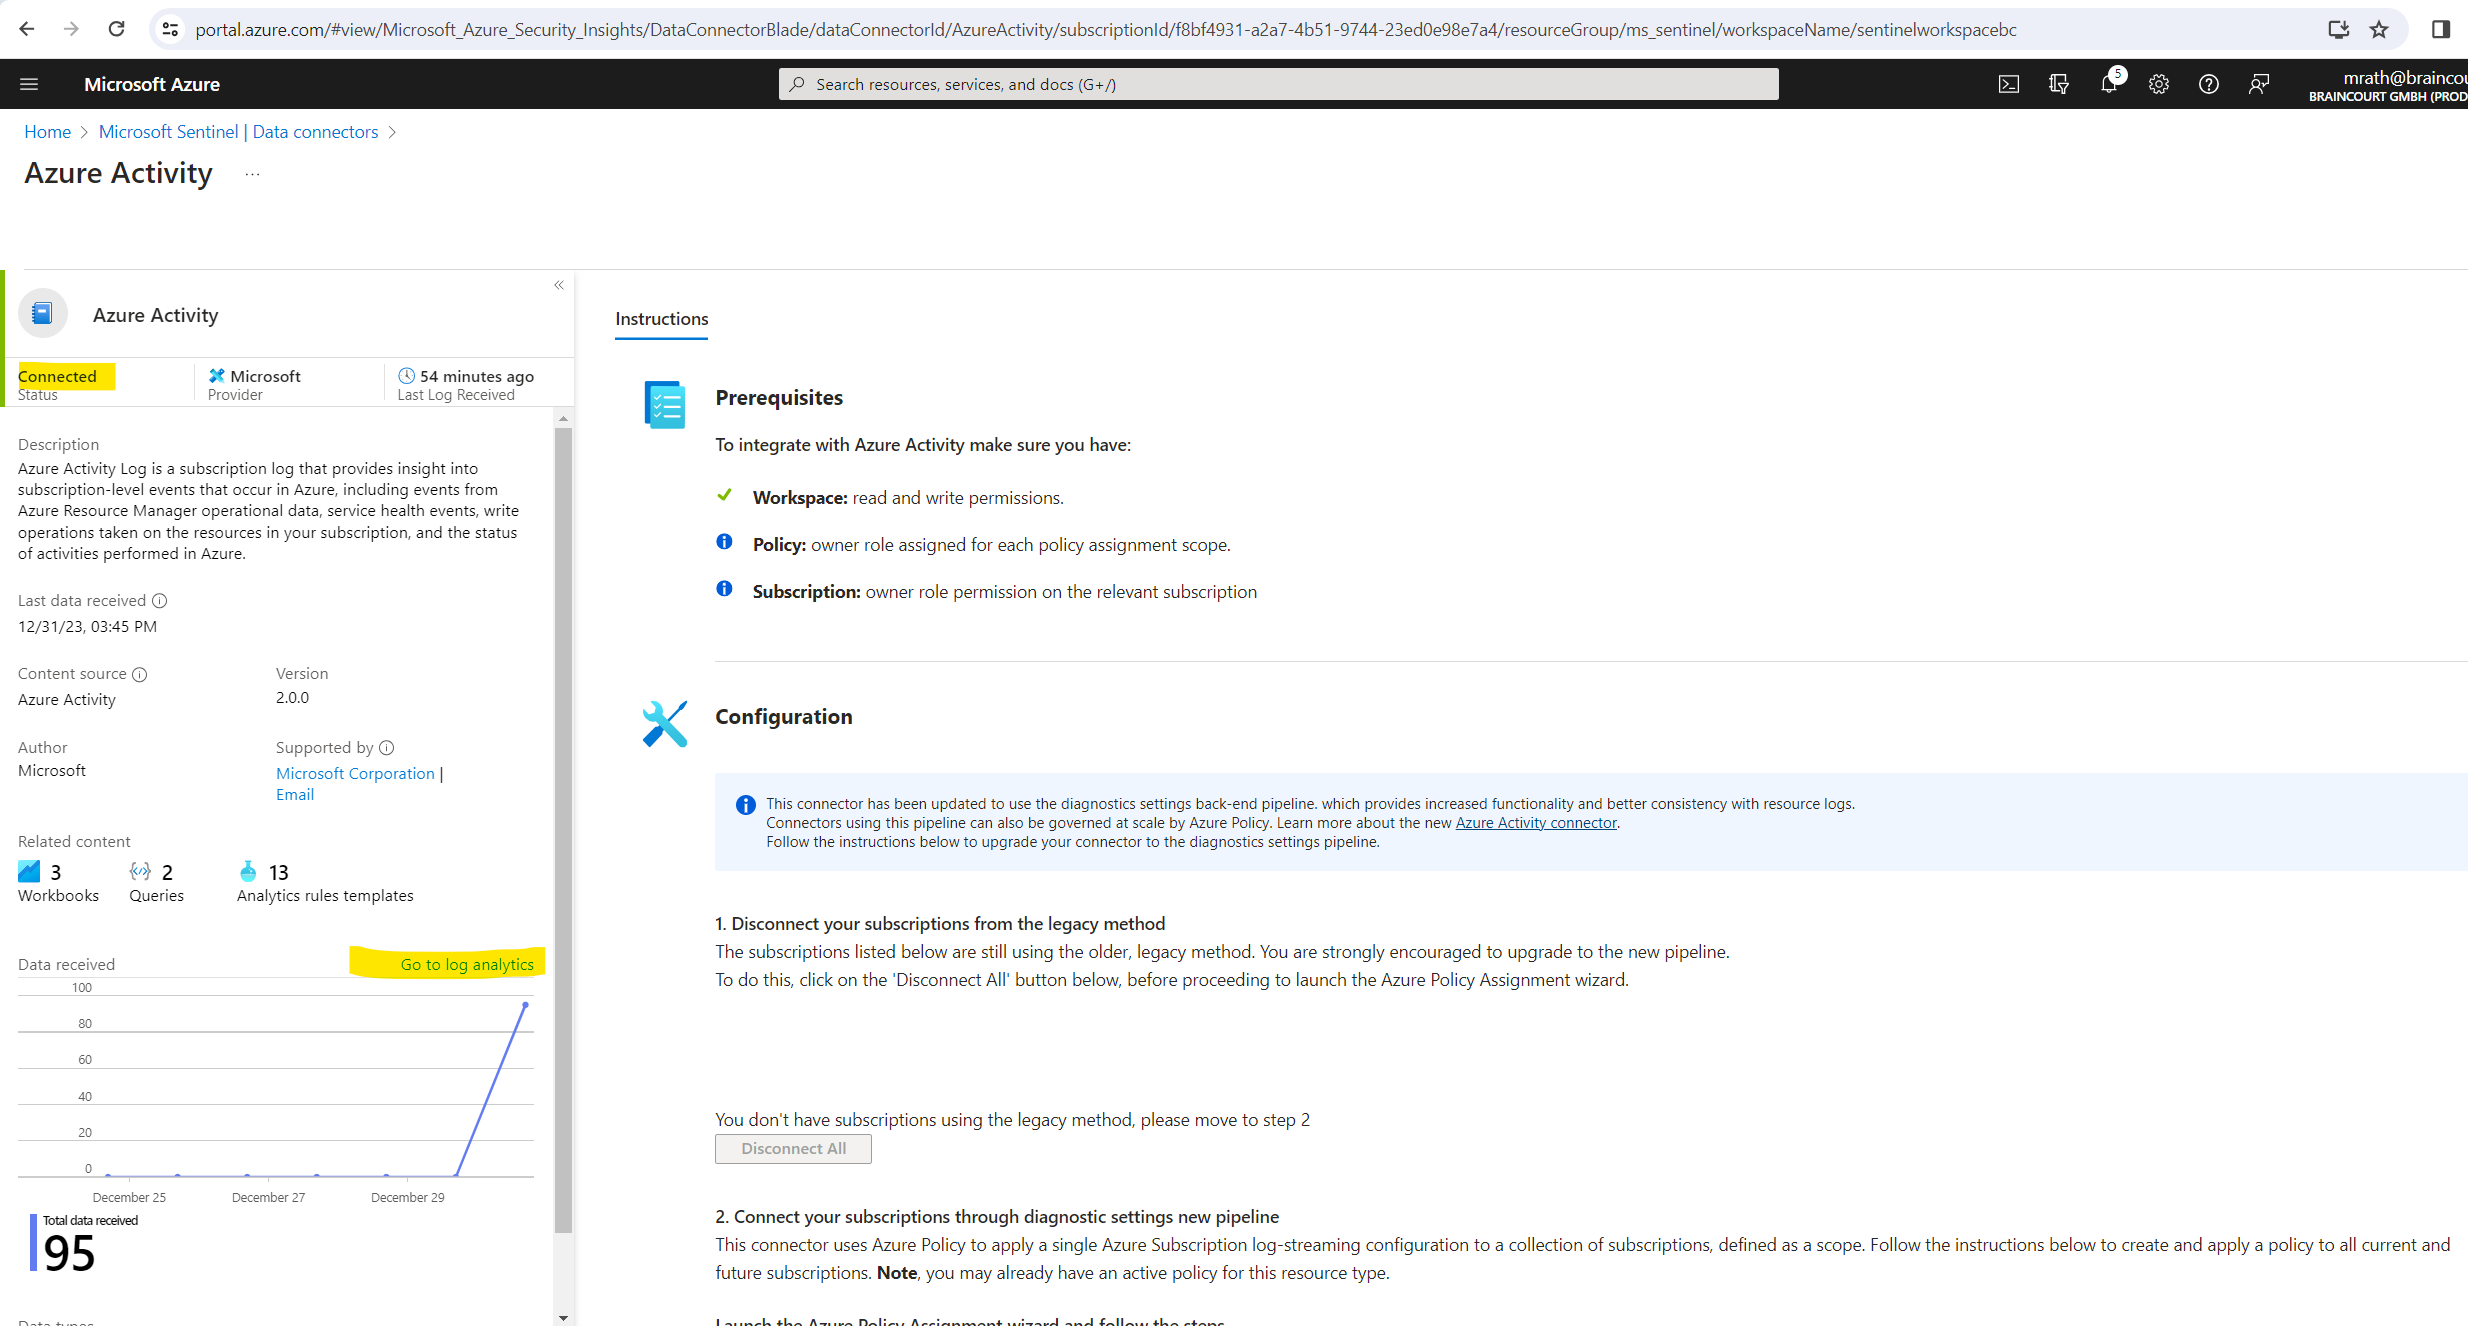
In Microsoft Sentinel, select Data connectors. Search for and select the Azure Activity data connector. In the details pane for the connector, select Open connector page.
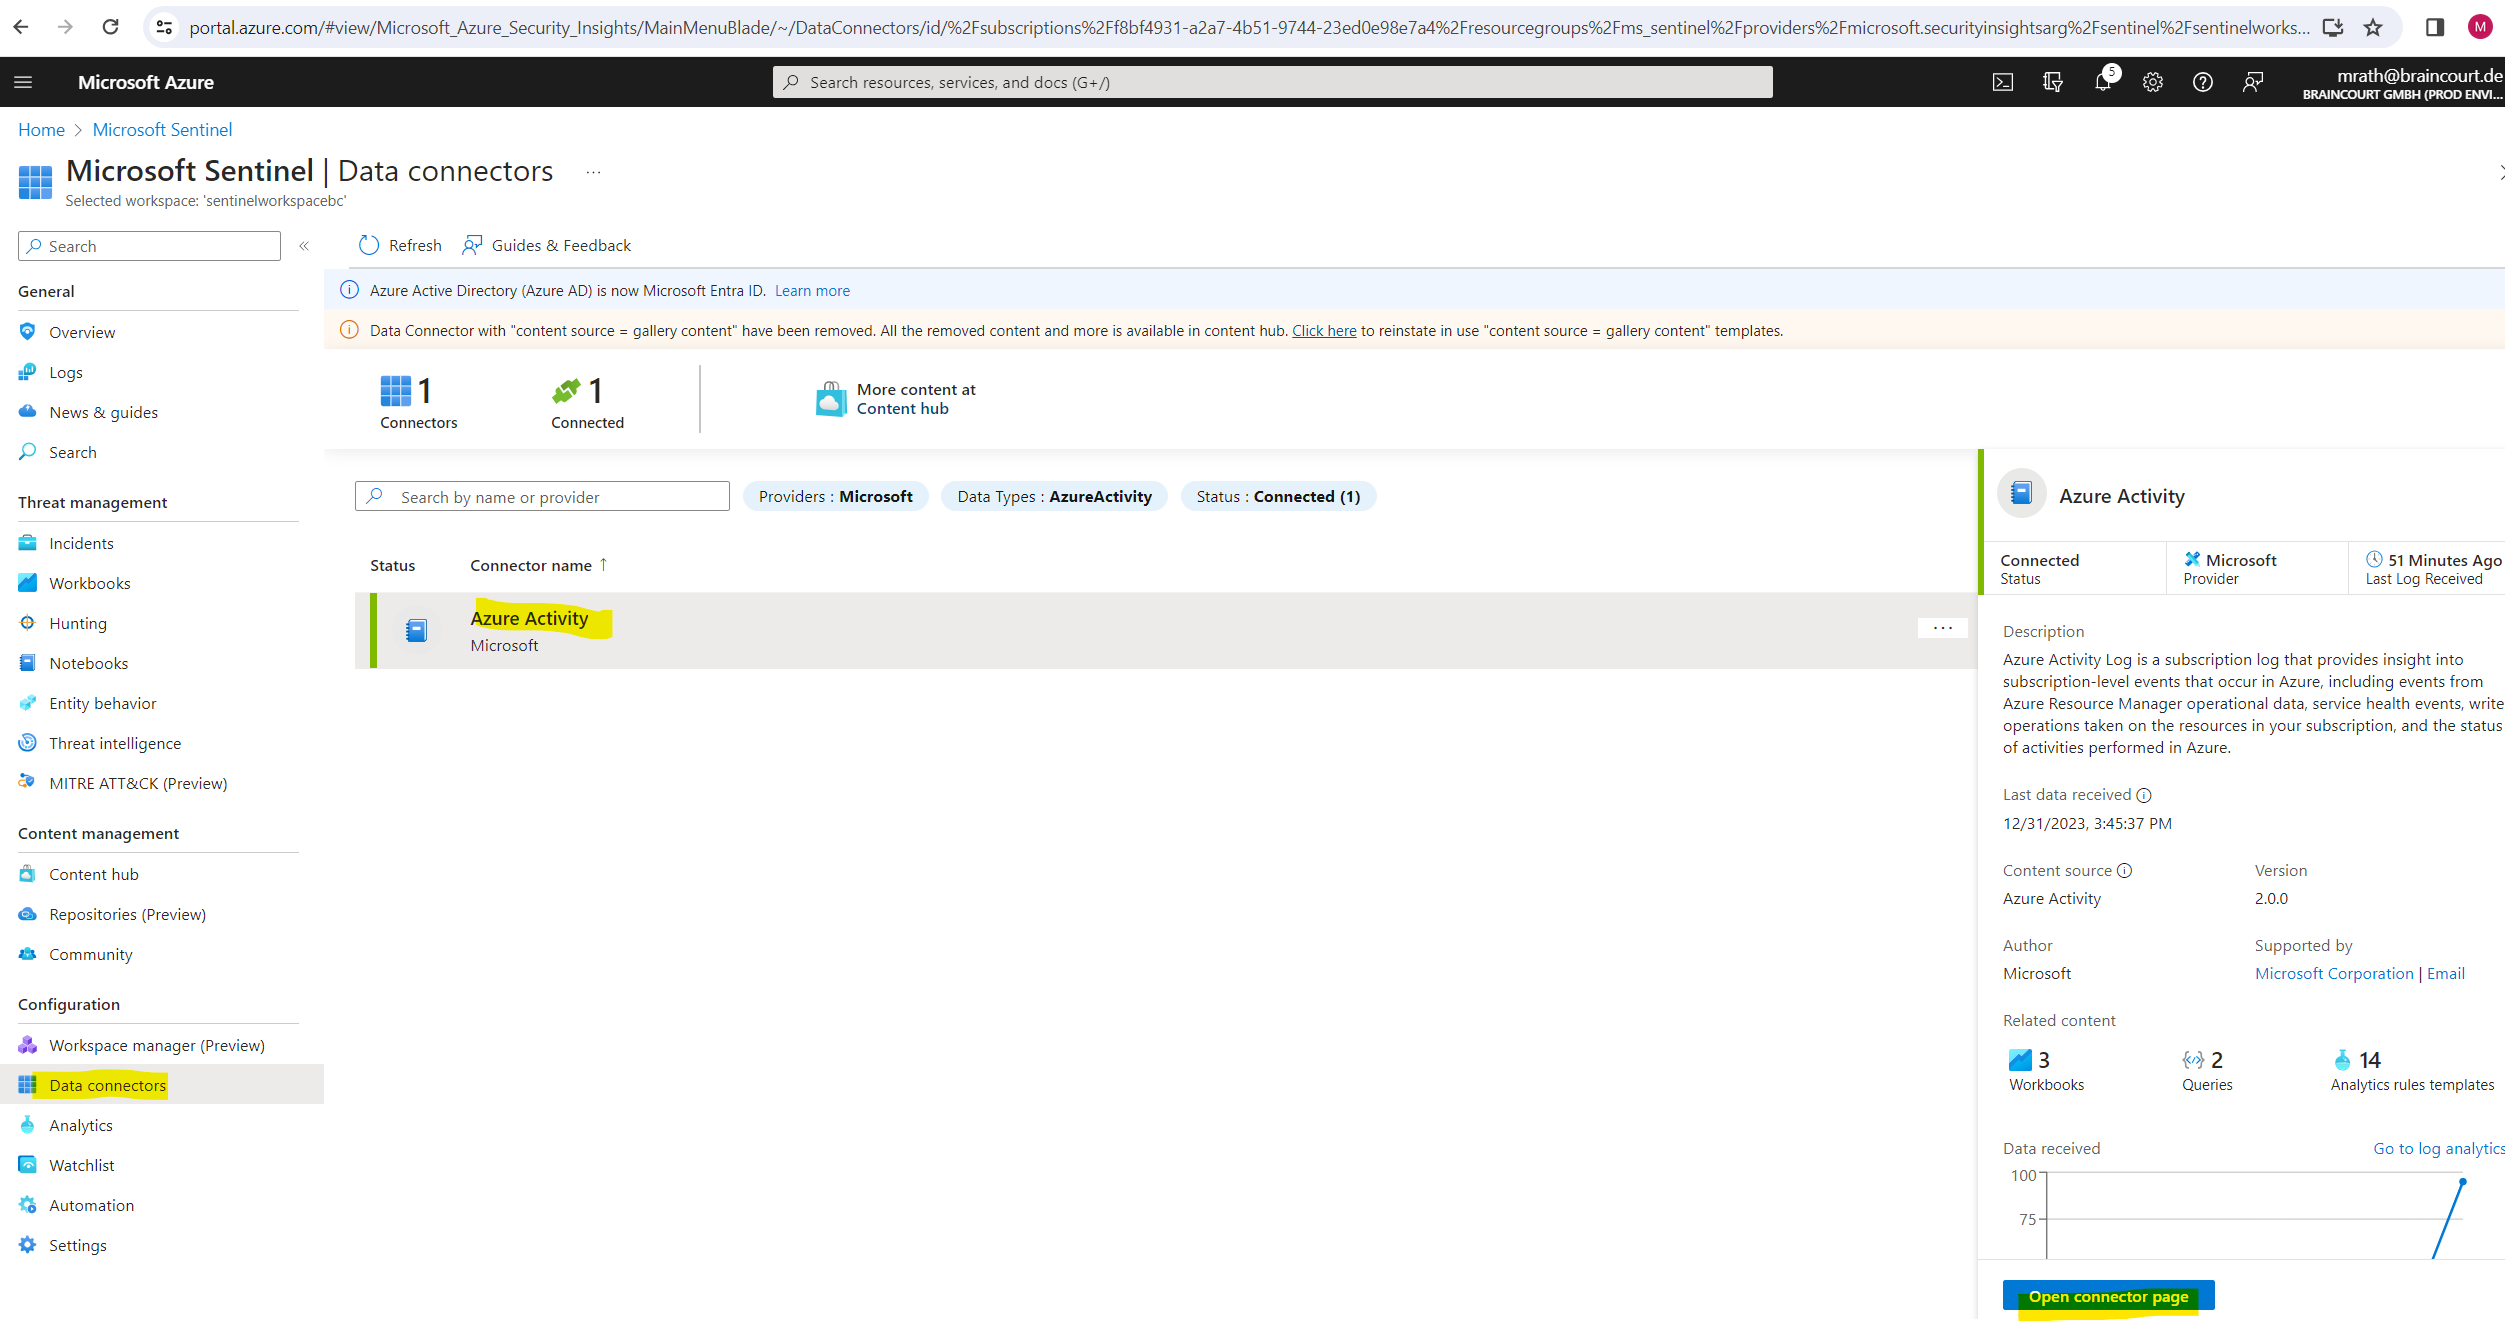
Review the Status of the data connector. It should be Connected.
In the left-hand side pane above the chart, select Go to log analytics.
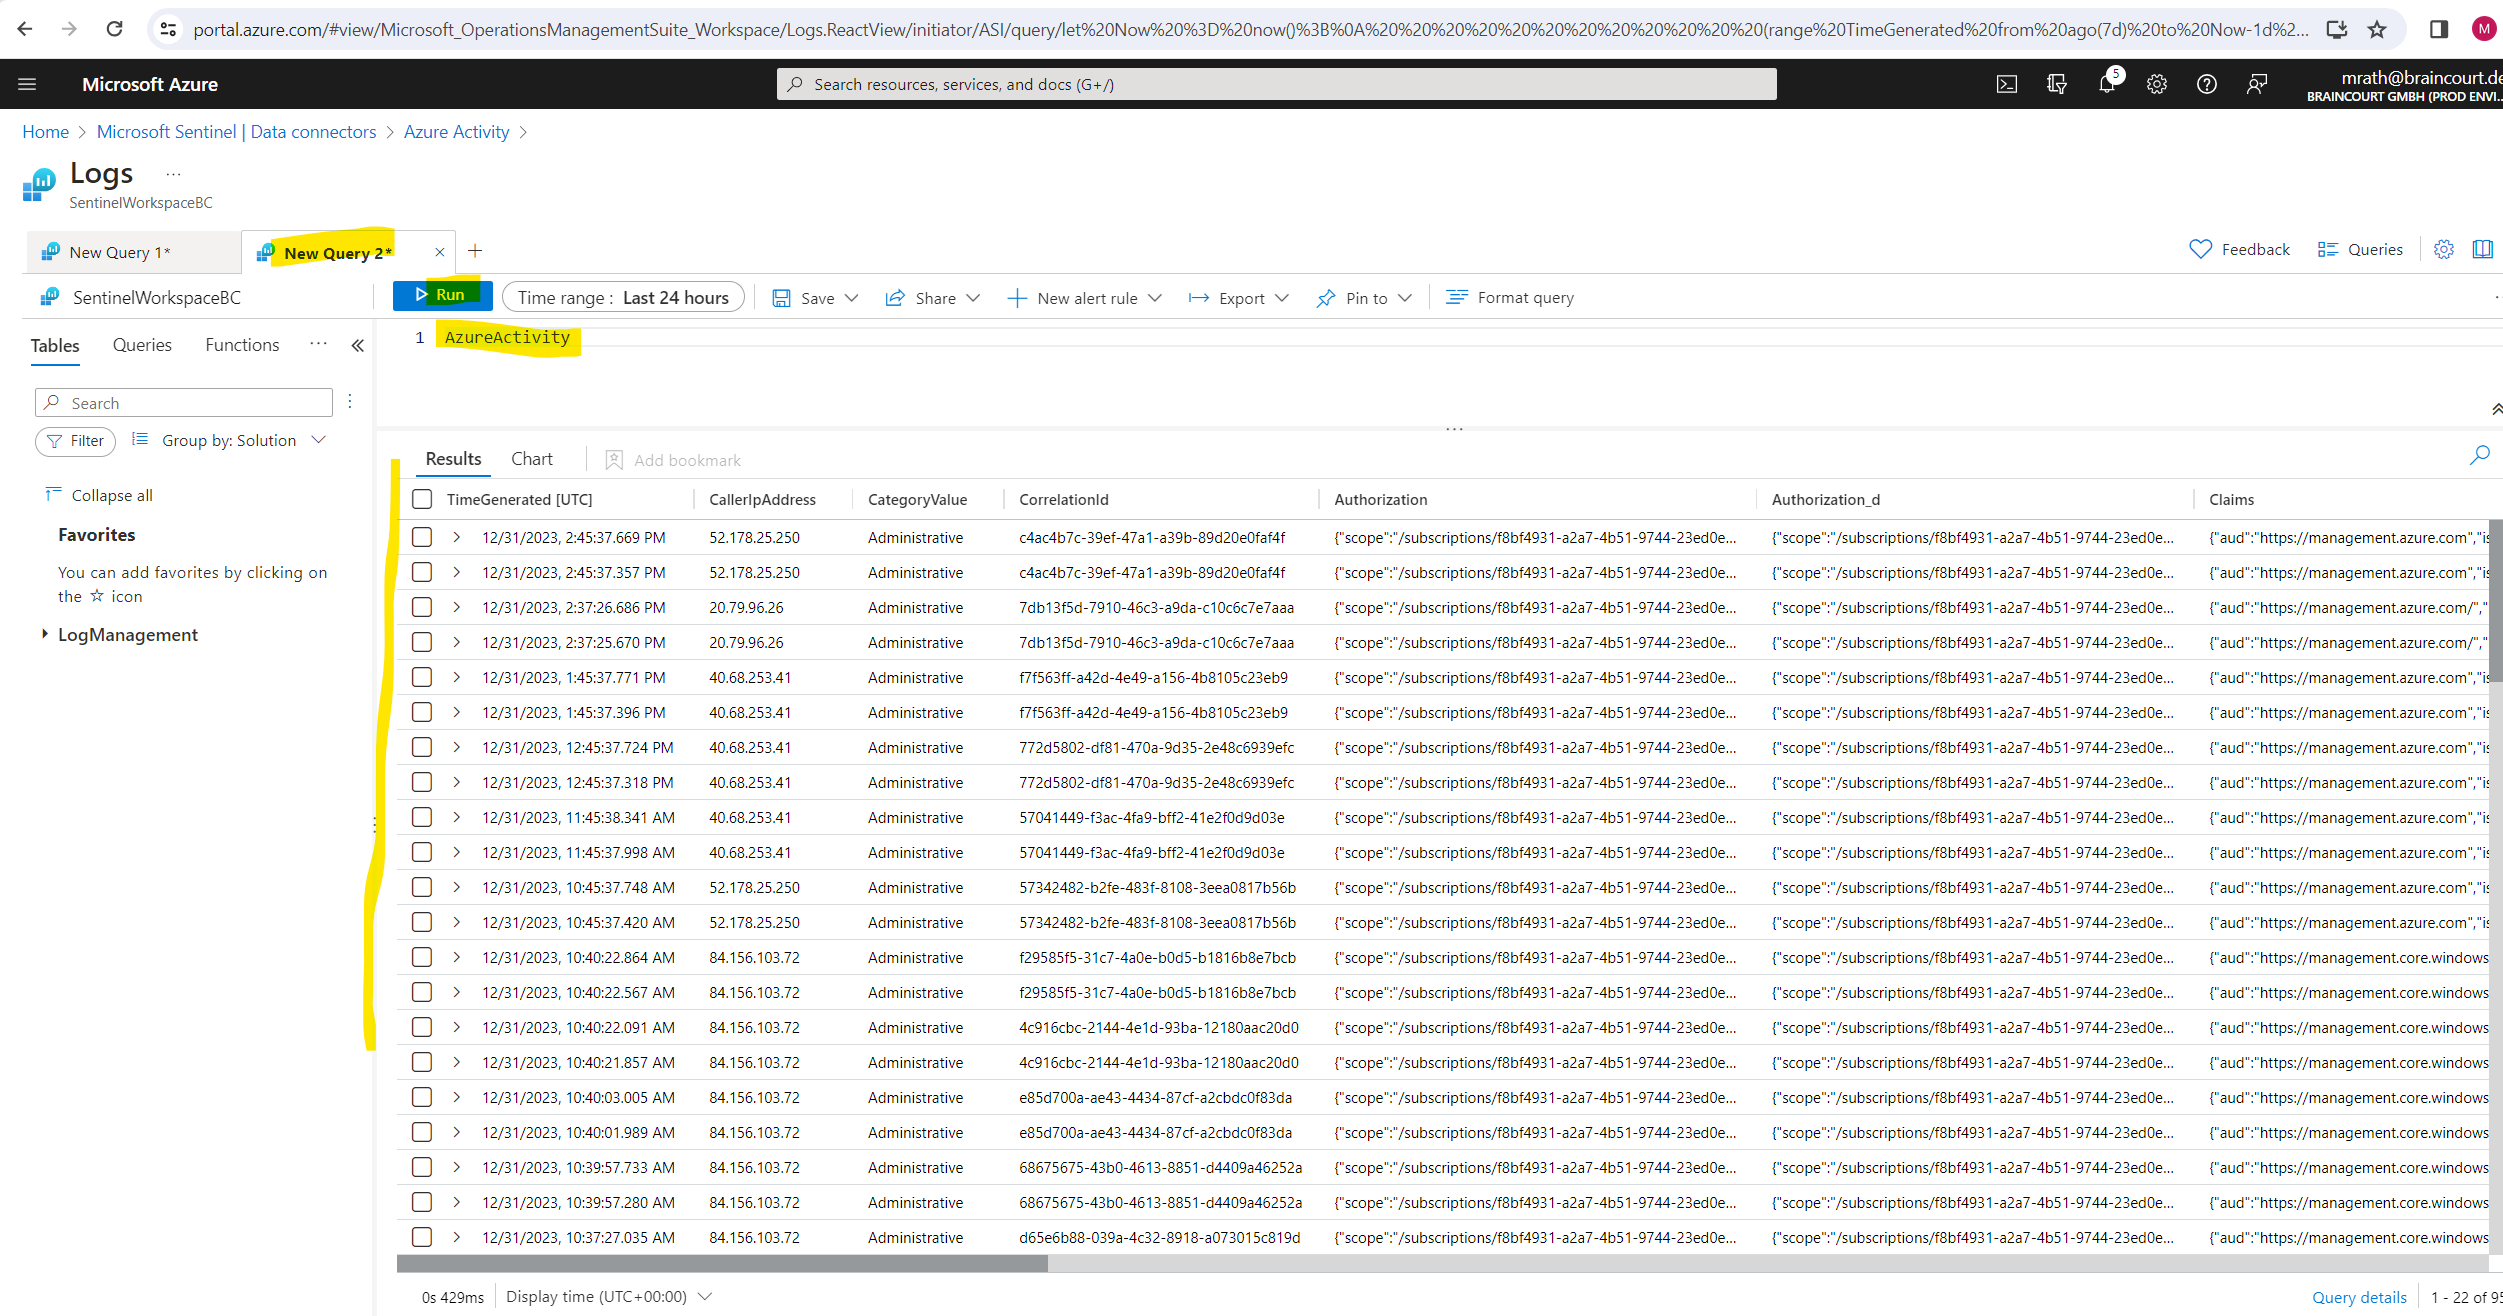
On the top of the pane, next to the New query 1 tab, select the + to add a new query tab.
In the query pane, run the following query to view the activity date ingested into the workspace.
AzureActivity
Source: https://learn.microsoft.com/en-us/azure/sentinel/quickstart-onboard
Onboard Microsoft Defender XDR to Microsoft Sentinel
So far I just added Azure Activity as data source to Microsoft Sentinel. Below I will also add Microsoft Defender XDR as data source to Microsoft Sentinel.
Microsoft Sentinel’s Microsoft Defender XDR incident integration allows you to stream all Microsoft Defender XDR incidents into Microsoft Sentinel and keep them synchronized between both portals. Incidents from Microsoft Defender XDR include all associated alerts, entities, and relevant information, providing you with enough context to perform triage and preliminary investigation in Microsoft Sentinel.
Once in Sentinel, incidents will remain bi-directionally synced with Microsoft Defender XDR, allowing you to take advantage of the benefits of both portals in your incident investigation.
This integration gives Microsoft 365 security incidents the visibility to be managed from within Microsoft Sentinel, as part of the primary incident queue across the entire organization, so you can see – and correlate – Microsoft 365 incidents together with those from all of your other cloud and on-premises systems.
Source: https://learn.microsoft.com/en-us/azure/sentinel/microsoft-365-defender-sentinel-integration
Install the Microsoft Defender XDR solution in Microsoft Sentinel
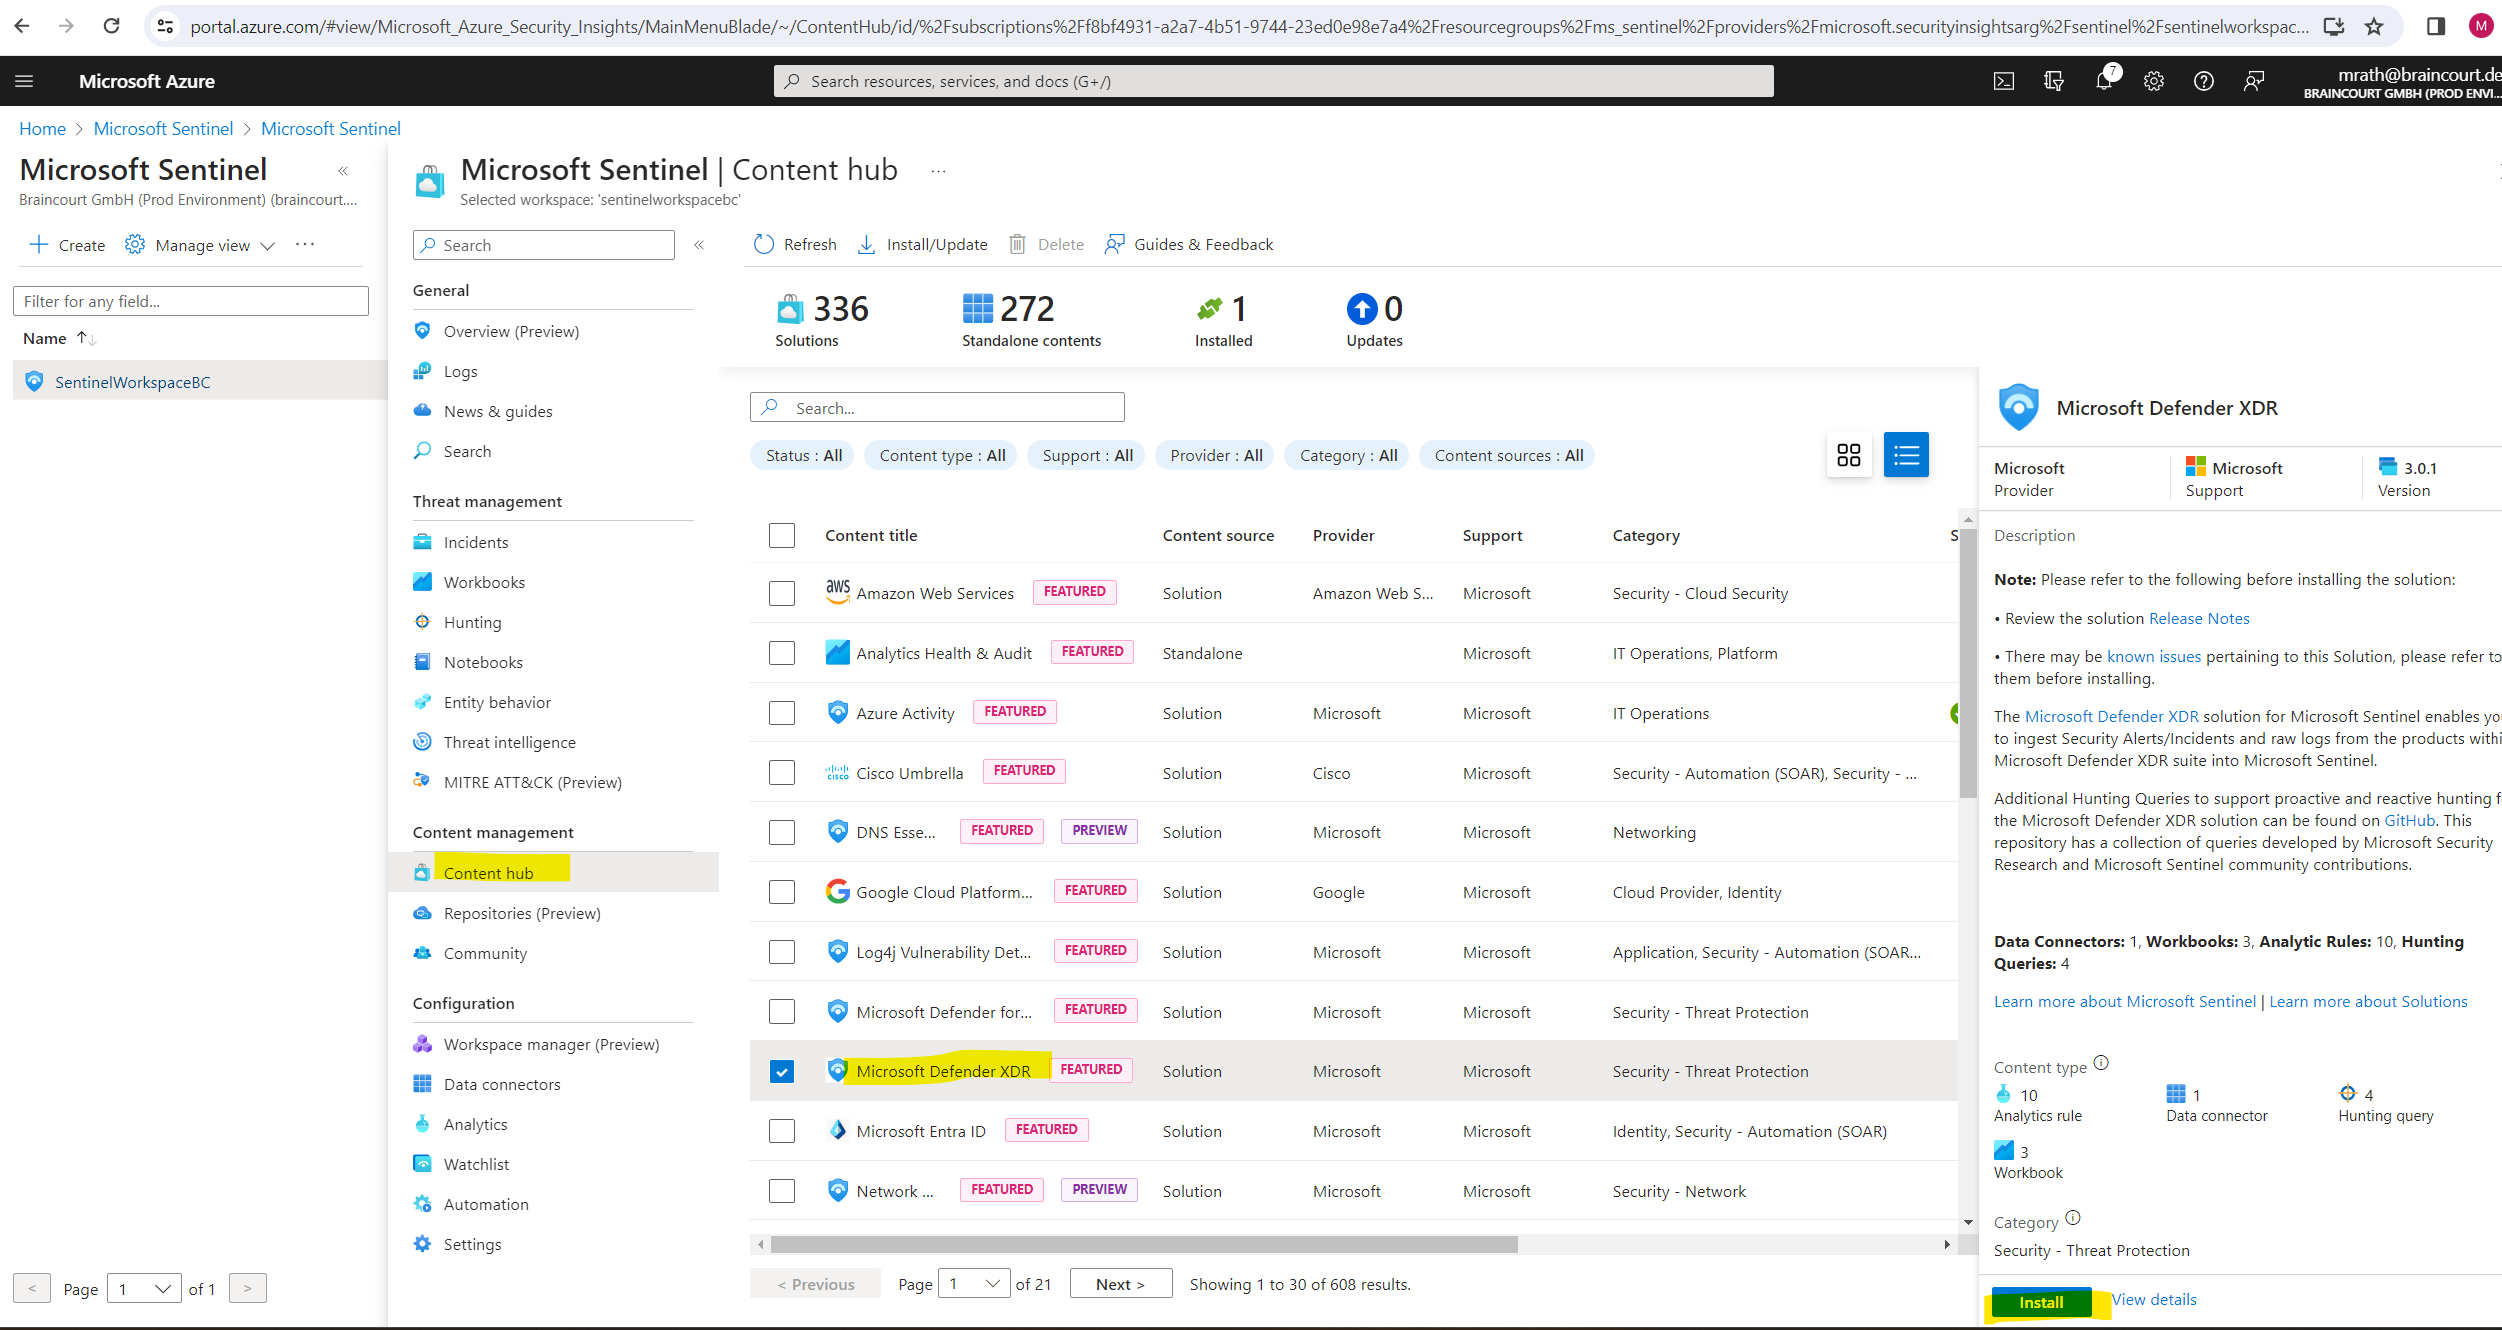
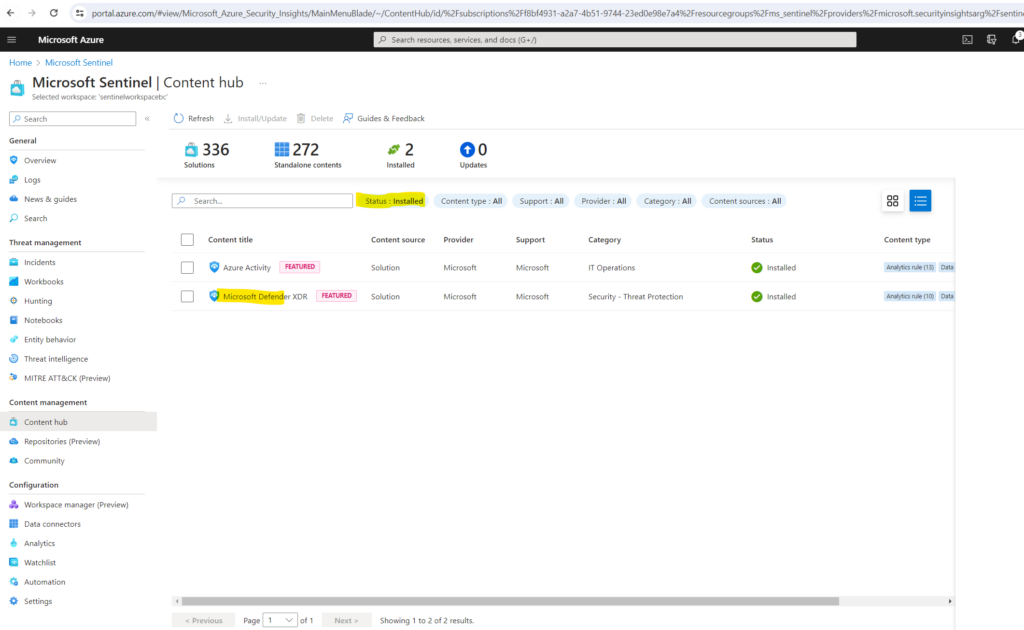
In Microsoft Sentinel, select Content hub. Find and select the Microsoft Defender XDR solution.
On the toolbar at the top of the page or in the detail pane, select Install/Update.
Set up the data connector
As mentioned, Microsoft Sentinel ingests data from services and apps by connecting to the service and forwarding the events and logs to Microsoft Sentinel.
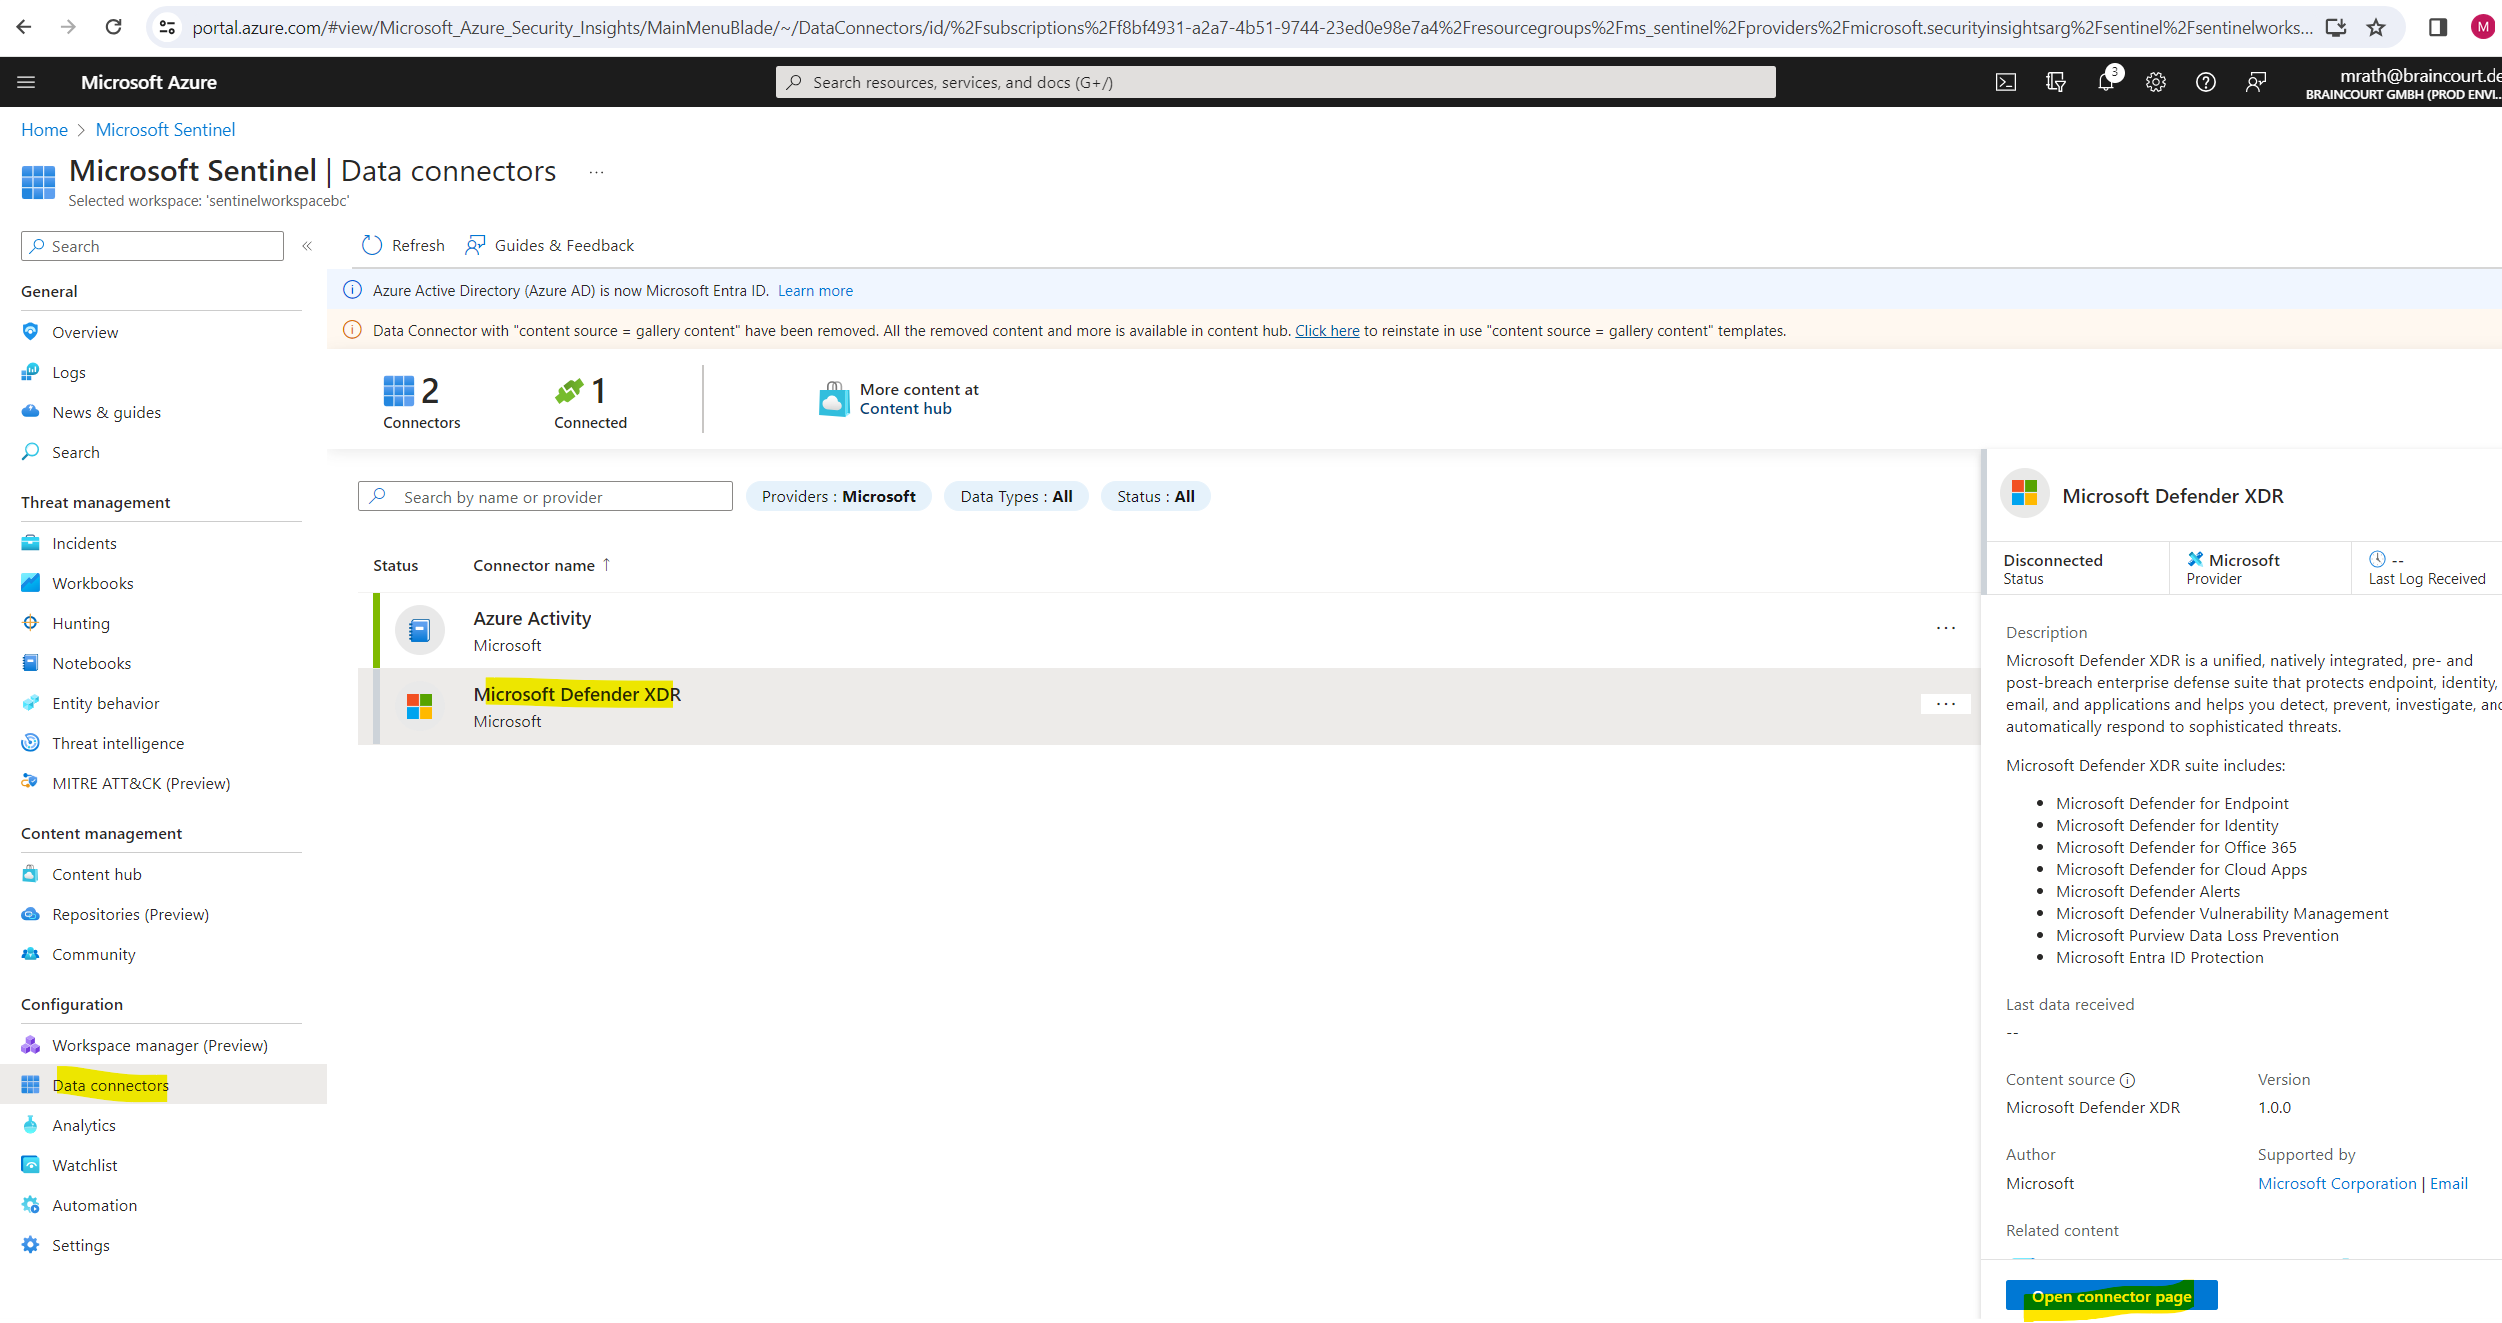
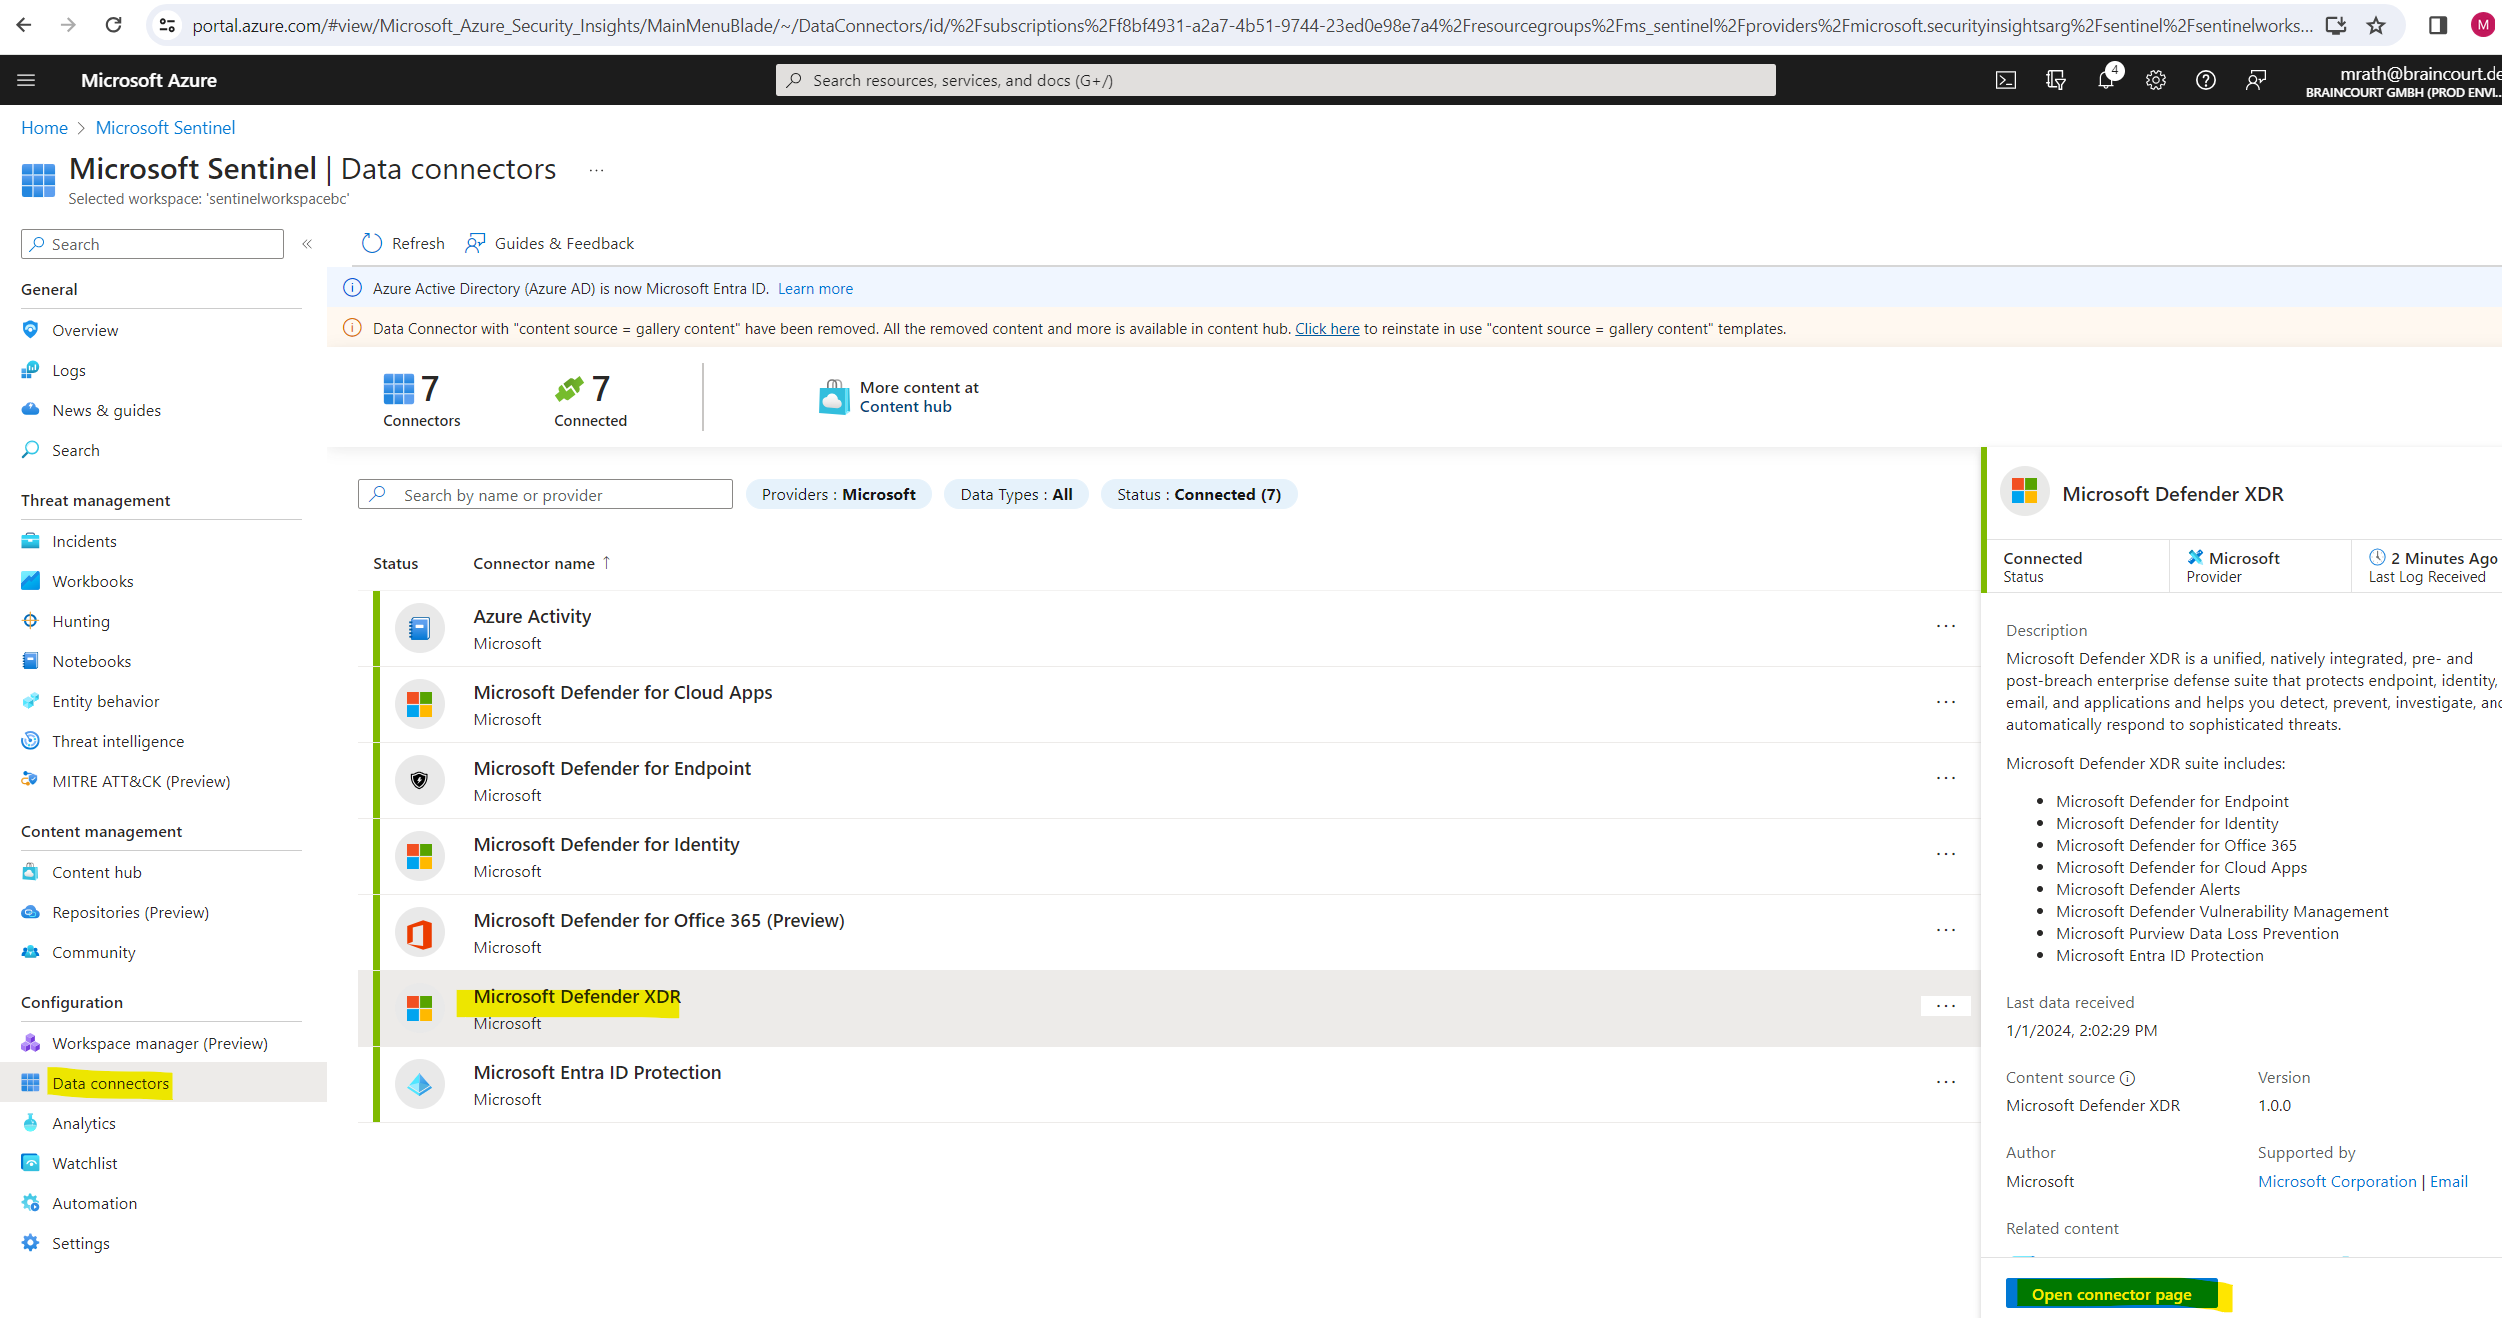
In Microsoft Sentinel, select Data connectors and here the Microsoft Defender XDR which was installed along with the solution previously.
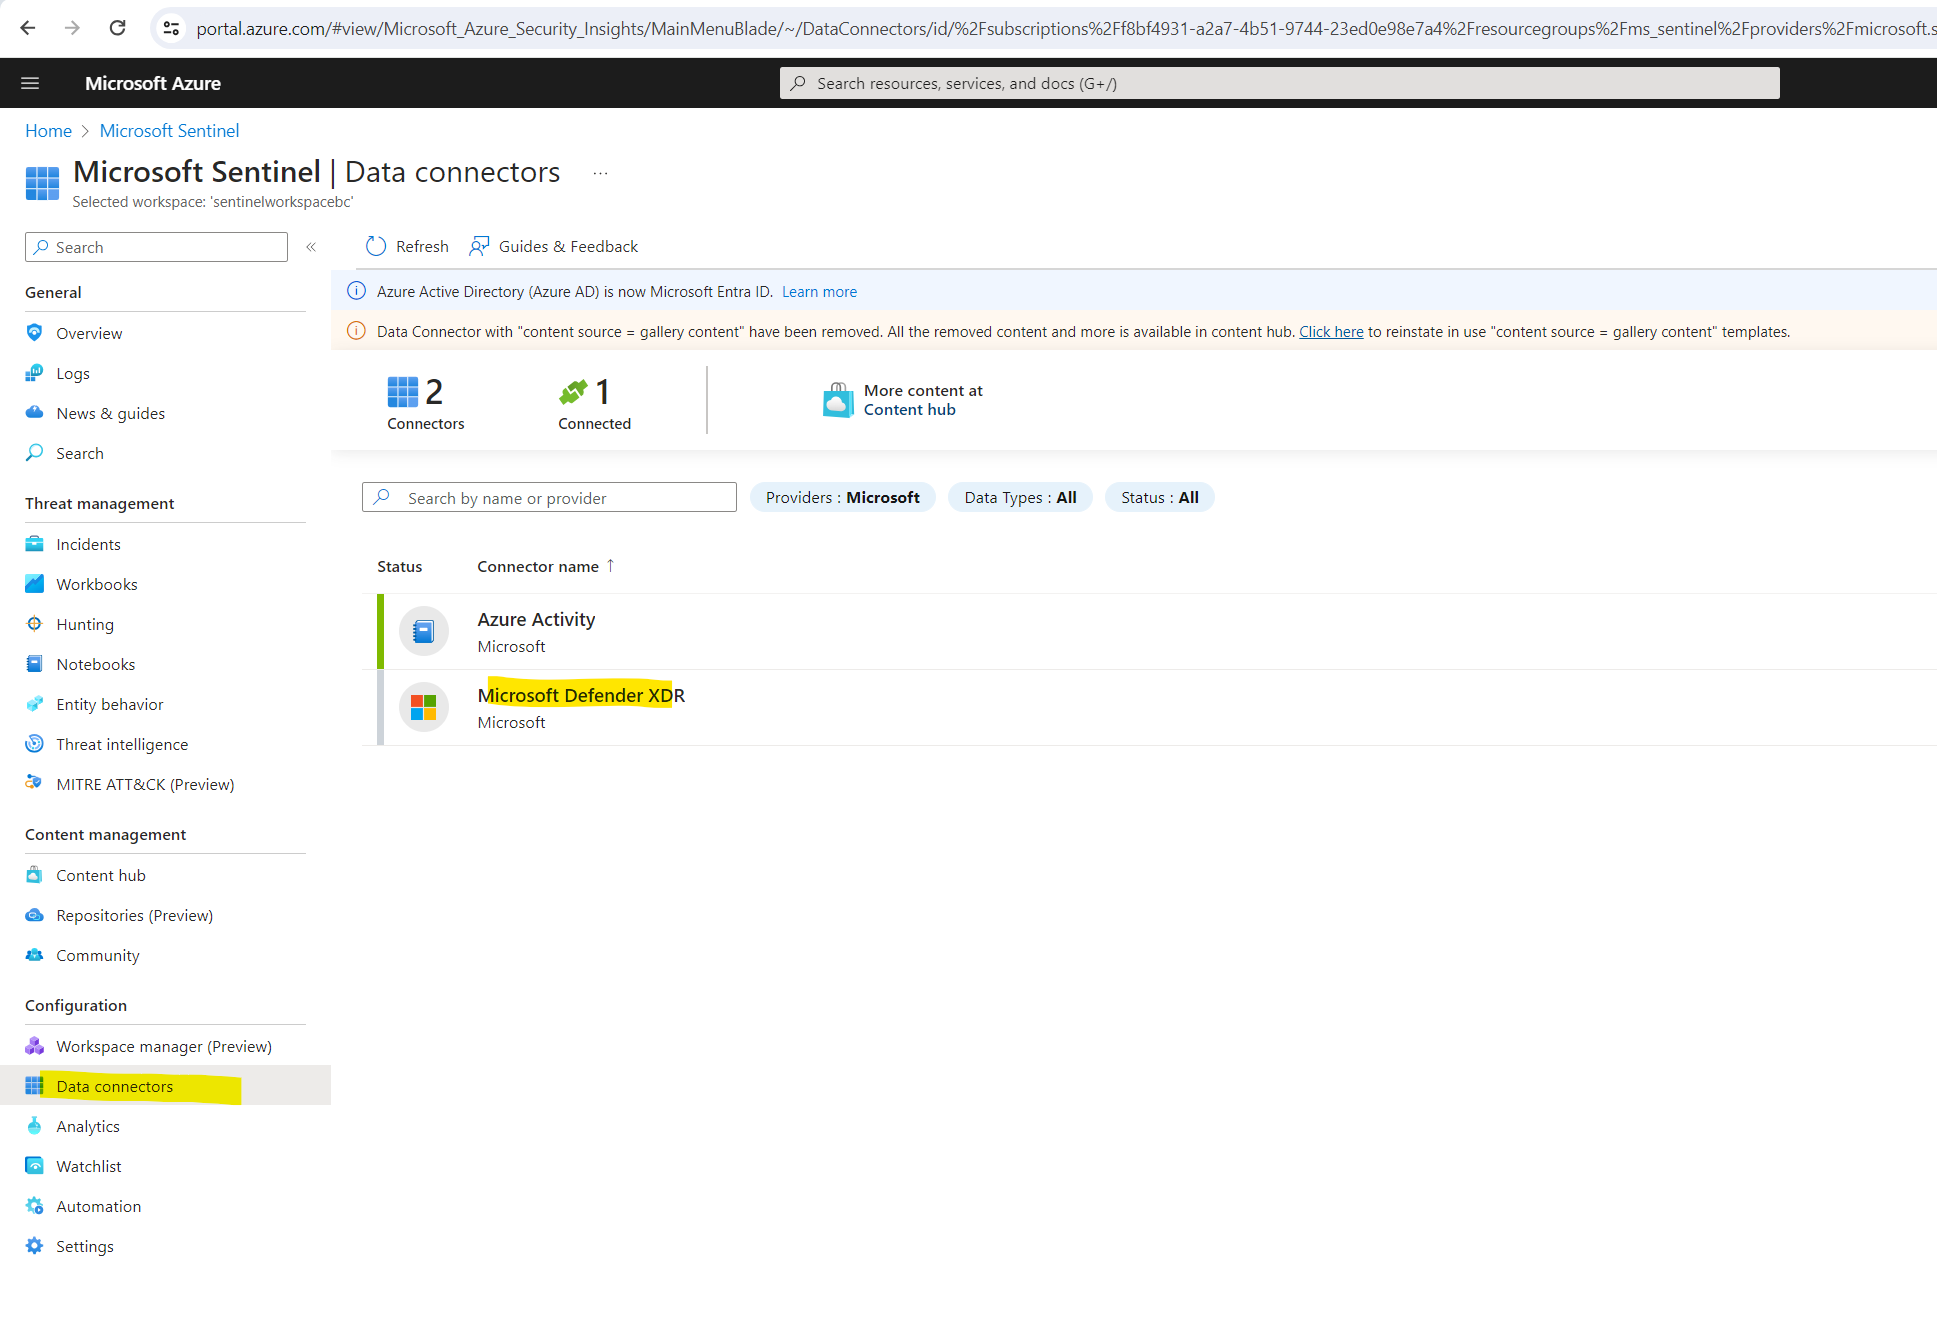
In the details pane for the connector, select Open connector page.
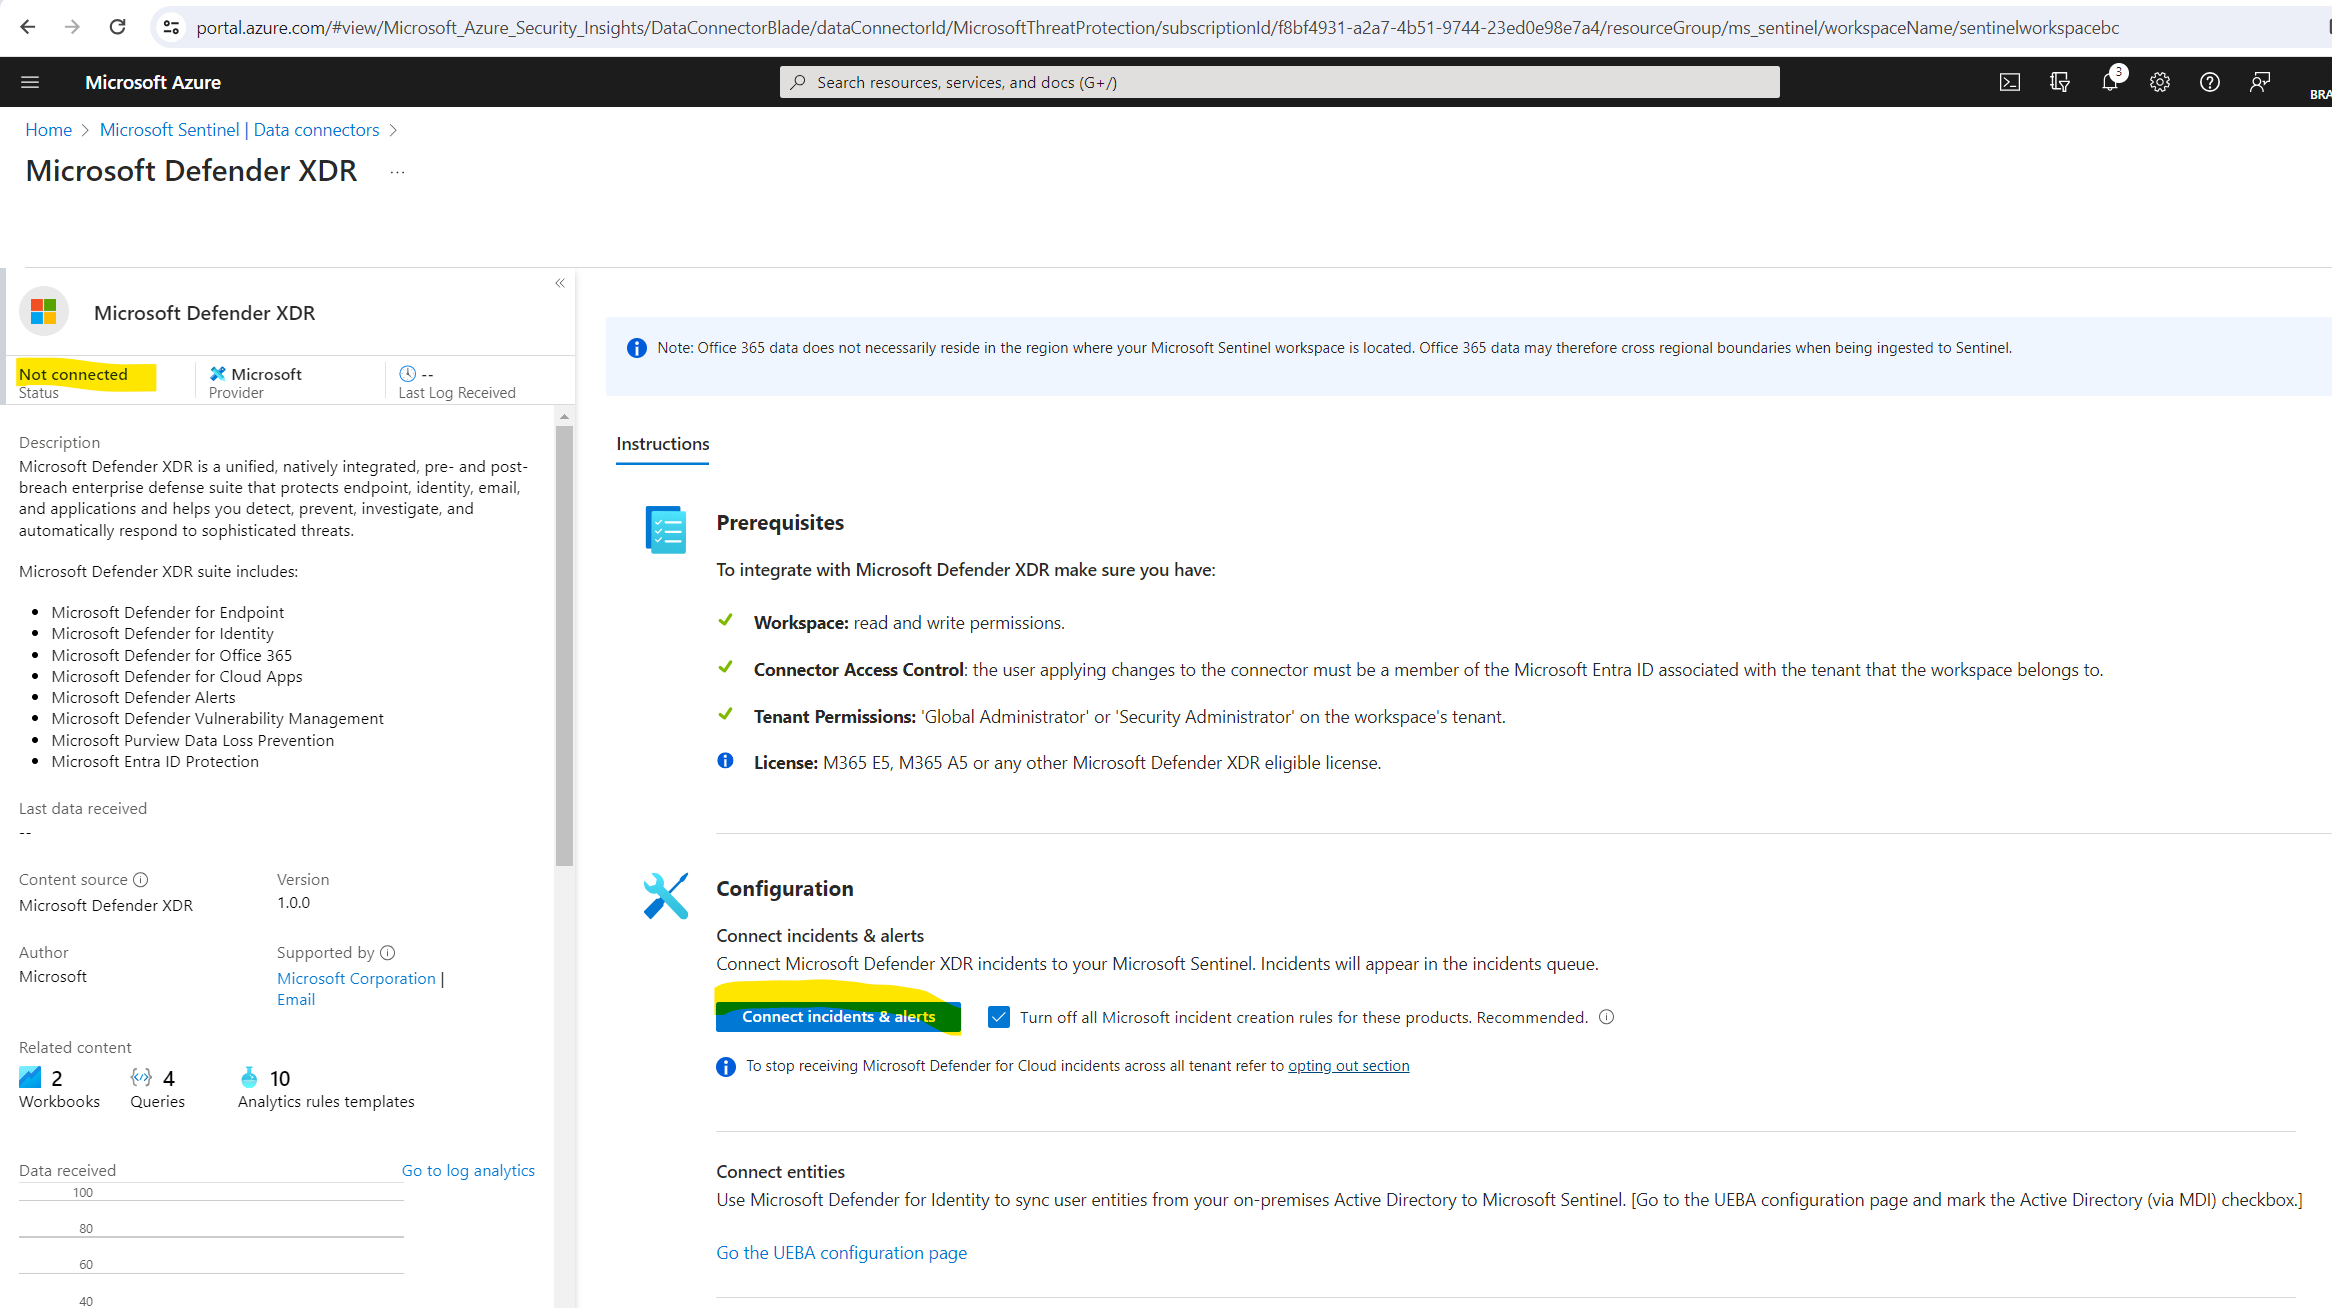
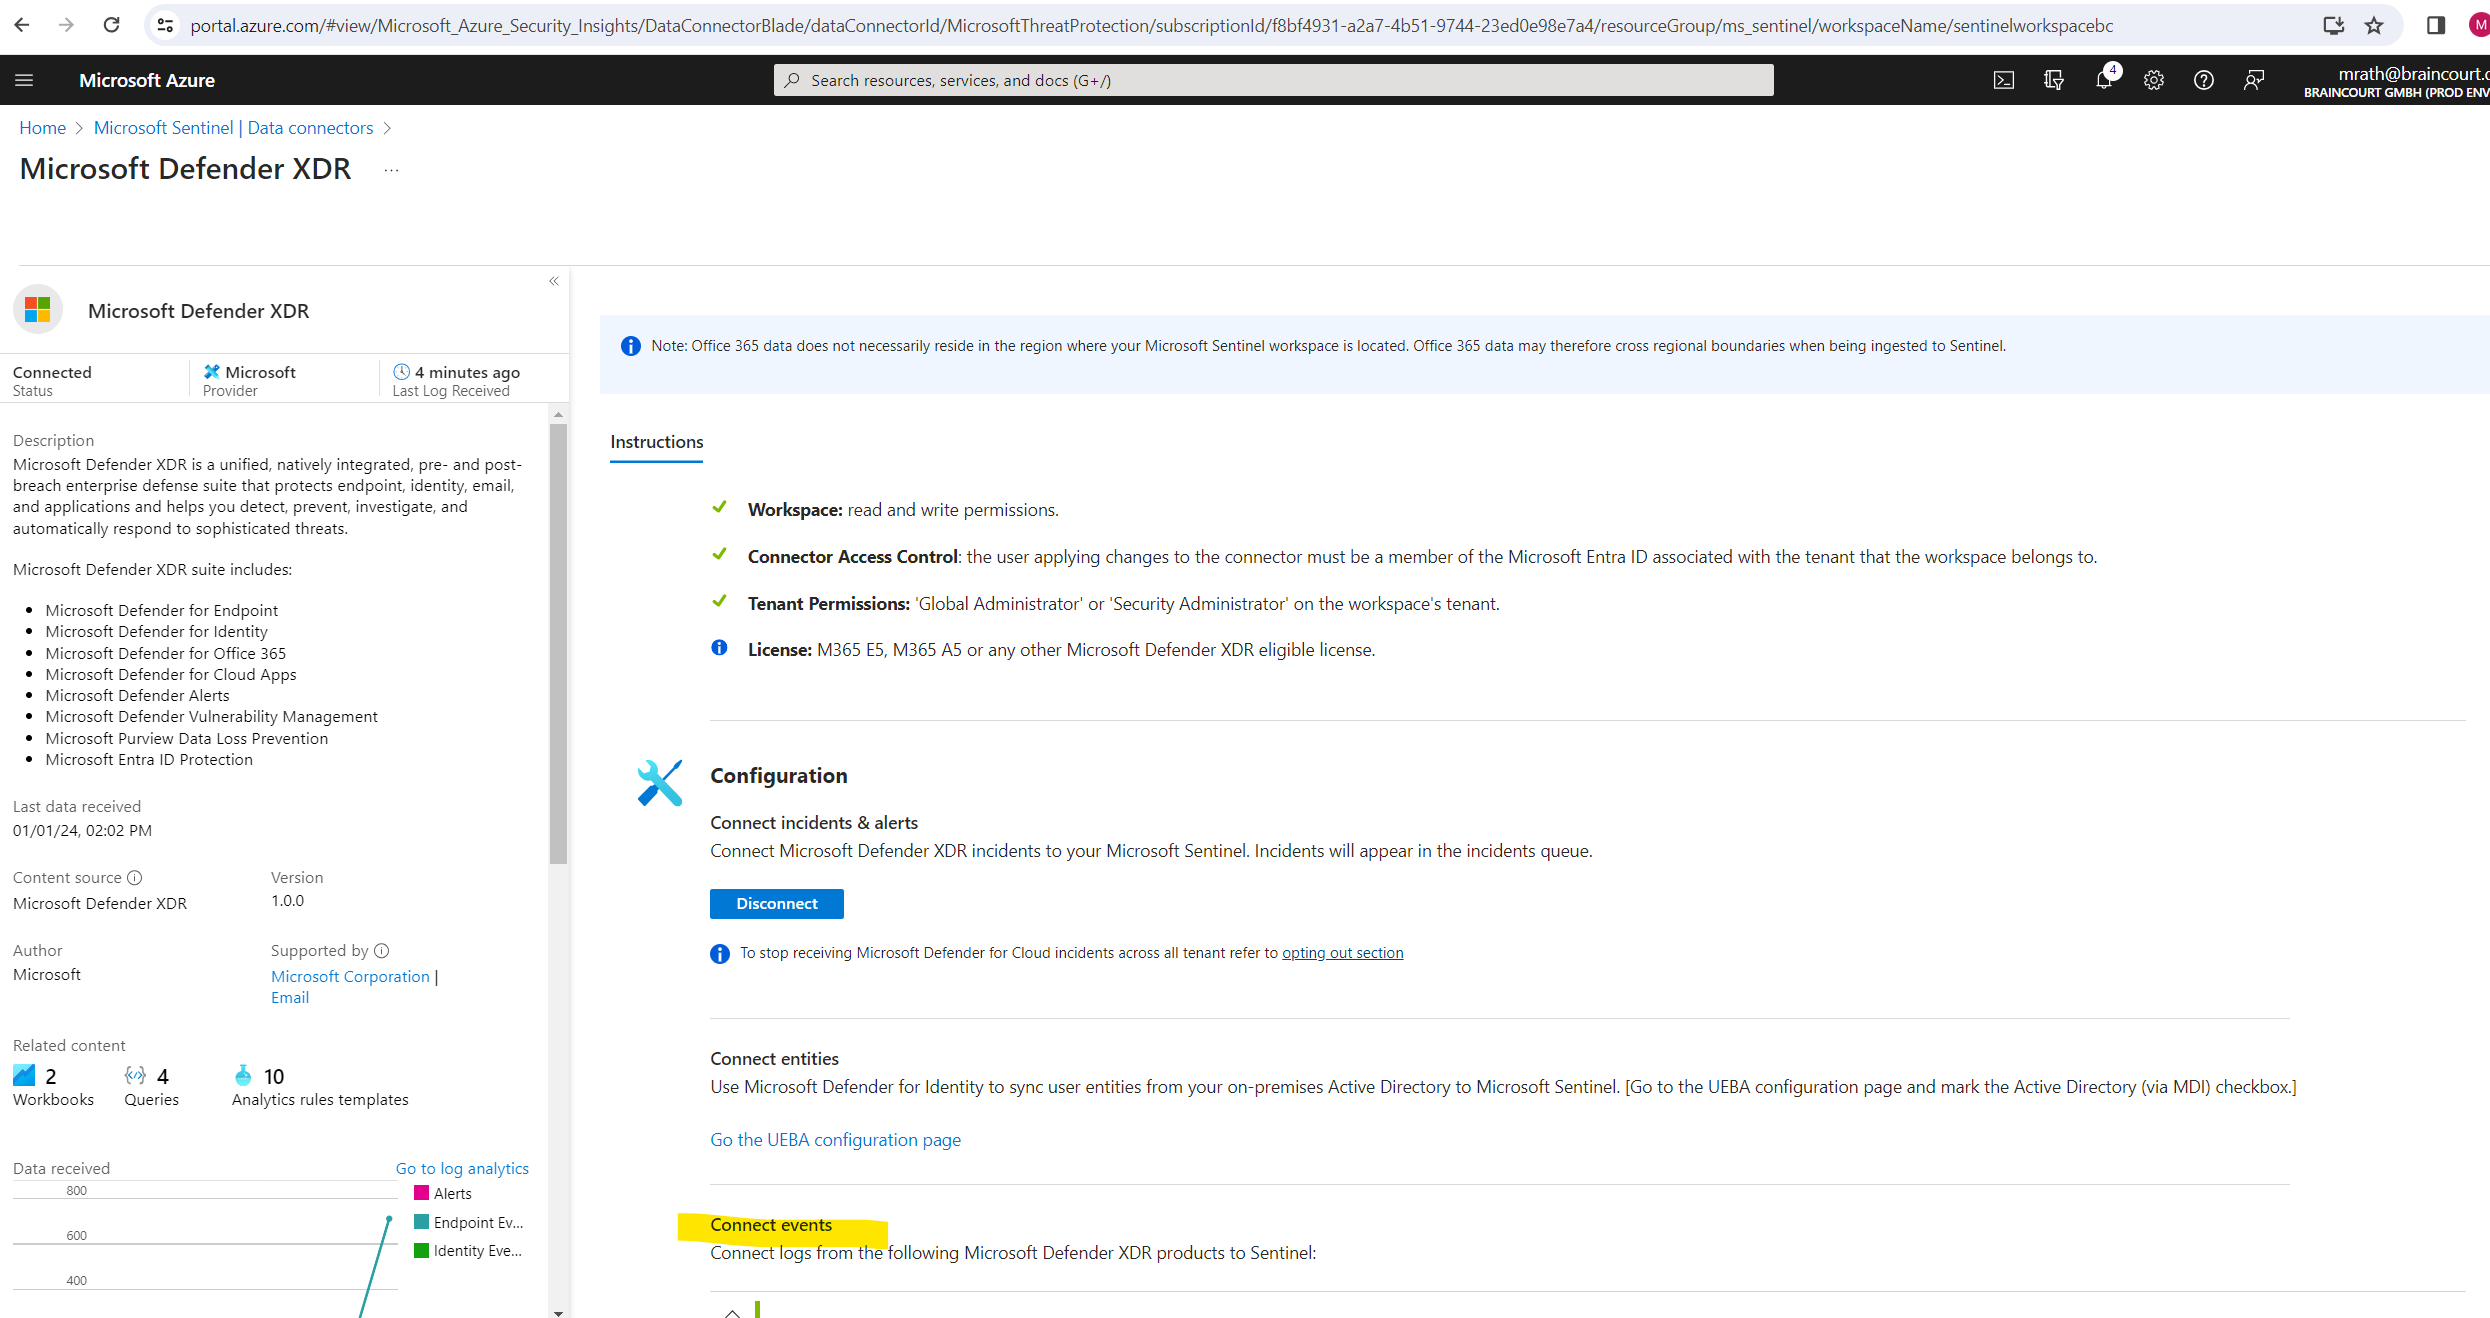
Click on Connect incidents & alerts.
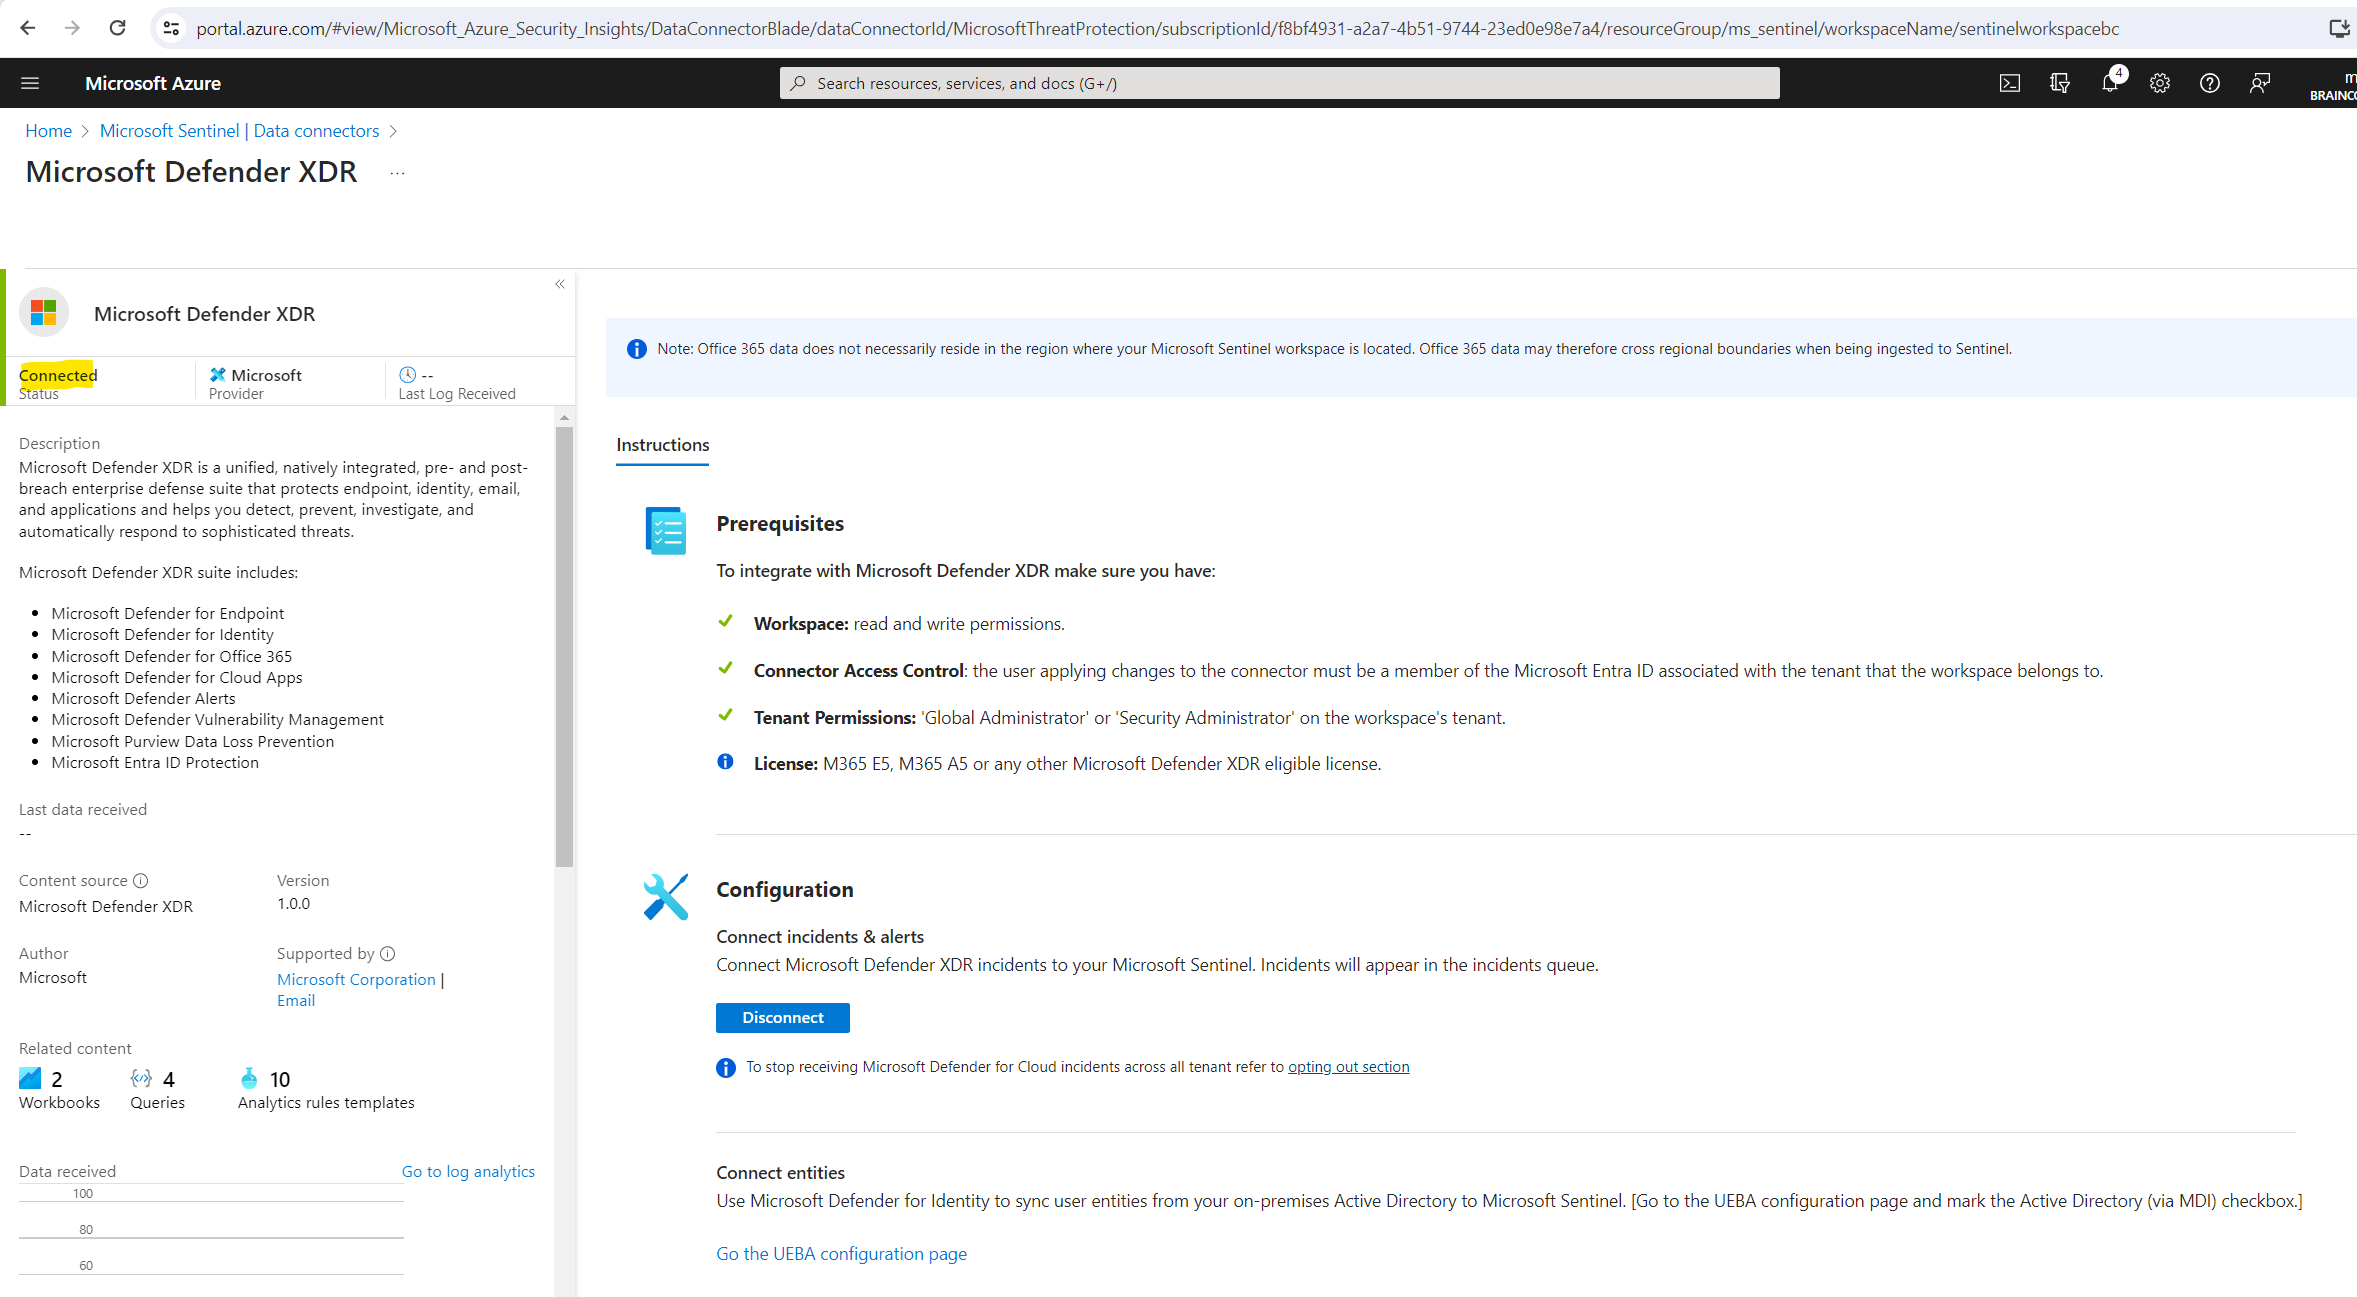
Microsoft Defender XDR is now connected to Microsoft Sentinel.
Once the Microsoft Defender XDR integration is connected, the connectors for all the integrated components and services (Defender for Endpoint, Defender for Identity, Defender for Office 365, Defender for Cloud Apps, Microsoft Entra ID Protection) will be automatically connected in the background if they weren’t already. If any component licenses were purchased after Microsoft Defender XDR was connected, the alerts and incidents from the new product will still flow to Microsoft Sentinel with no additional configuration or charge.
More about all Microsoft Defender XDR products you will find in my following post.
You will see all further installed Microsoft Defender XDR connectors by selecting the Data connectors menu as shown below.
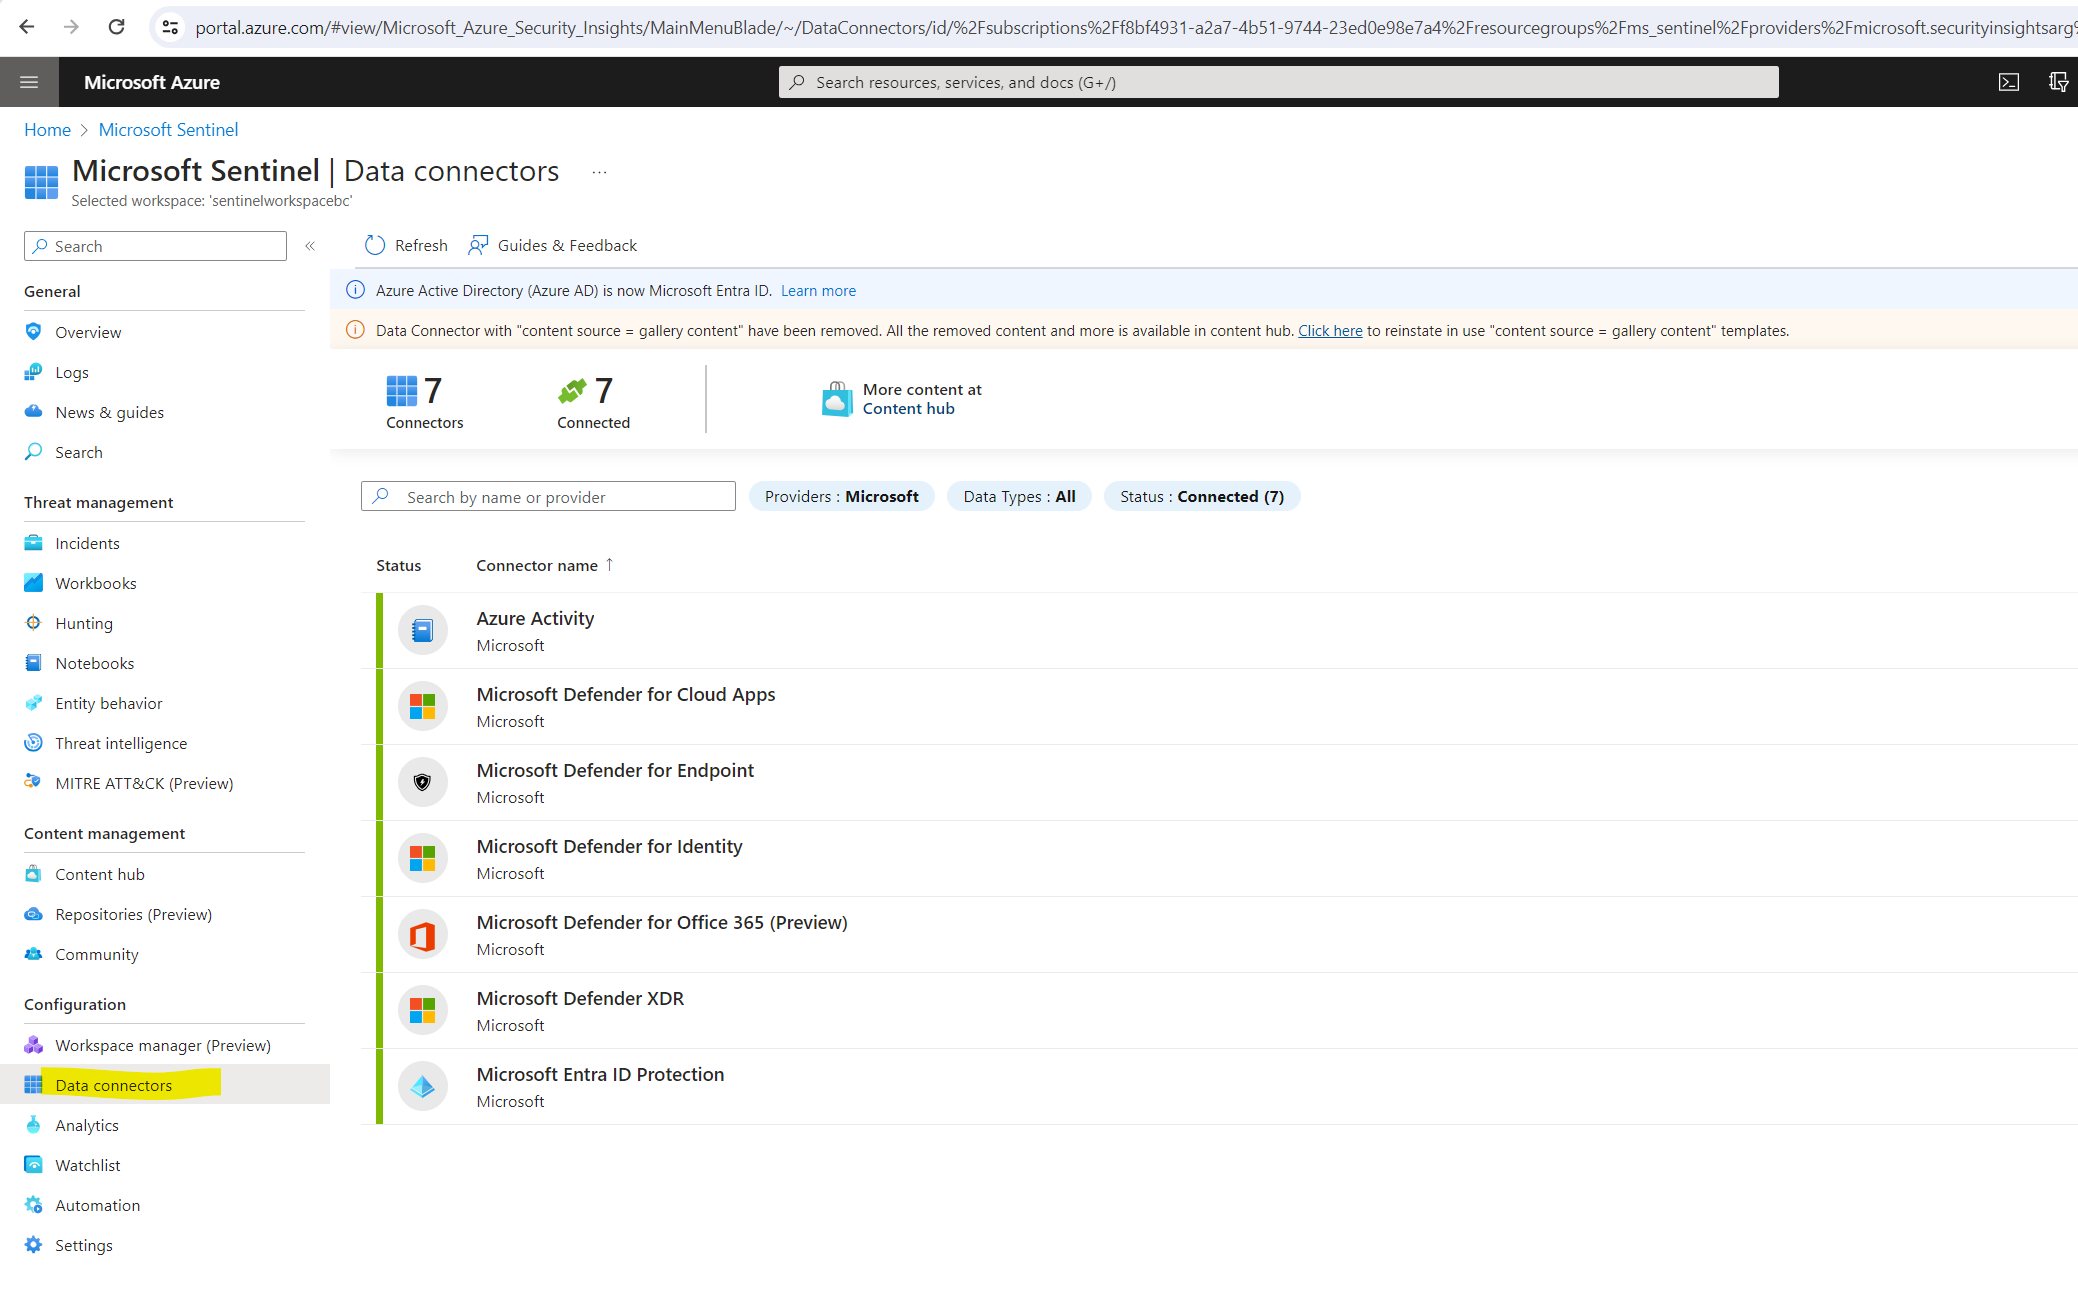
More about you will find here https://learn.microsoft.com/en-us/azure/sentinel/connect-microsoft-365-defender.
Microsoft Defender XDR incidents appear in the Microsoft Sentinel incidents queue, with Microsoft Defender XDR in the Product name field, shortly after they are generated in Microsoft Defender XDR.
- It can take up to 10 minutes from the time an incident is generated in Microsoft Defender XDR to the time it appears in Microsoft Sentinel.
- Alerts and incidents from Microsoft Defender XDR (those items which populate the SecurityAlert and SecurityIncident tables) are ingested into and synchronized with Microsoft Sentinel at no charge. For all other data types from individual Defender components (such as DeviceInfo, DeviceFileEvents, EmailEvents, and so on), ingestion will be charged.
Connect logs from Microsoft Defender XDR products to Sentinel
As already mentioned, Microsoft Sentinel ingests data from services and apps by connecting to the service and forwarding the events and logs to Microsoft Sentinel.
In order to forward data for Microsoft Defender XDR and all its covered products to Microsoft Sentinel, we need to connect the desired logs we want to monitor from Microsoft Defender XDR to Microsoft Sentinel as shown below.
We need to configure here the main data connector from Microsoft Defender XDR.
In the Azure portal, select Microsoft Sentinel and then select the workspace you want to configure the data connectors for.
Then select the Microsoft Defender XDR connector within you can configure also all other included and installed connectors by and its logs like e.g. (Defender for Cloud Apps, Defender for Endpoint, Defender for Identity, Defender for Office 365, …).
Click on Open connector page.
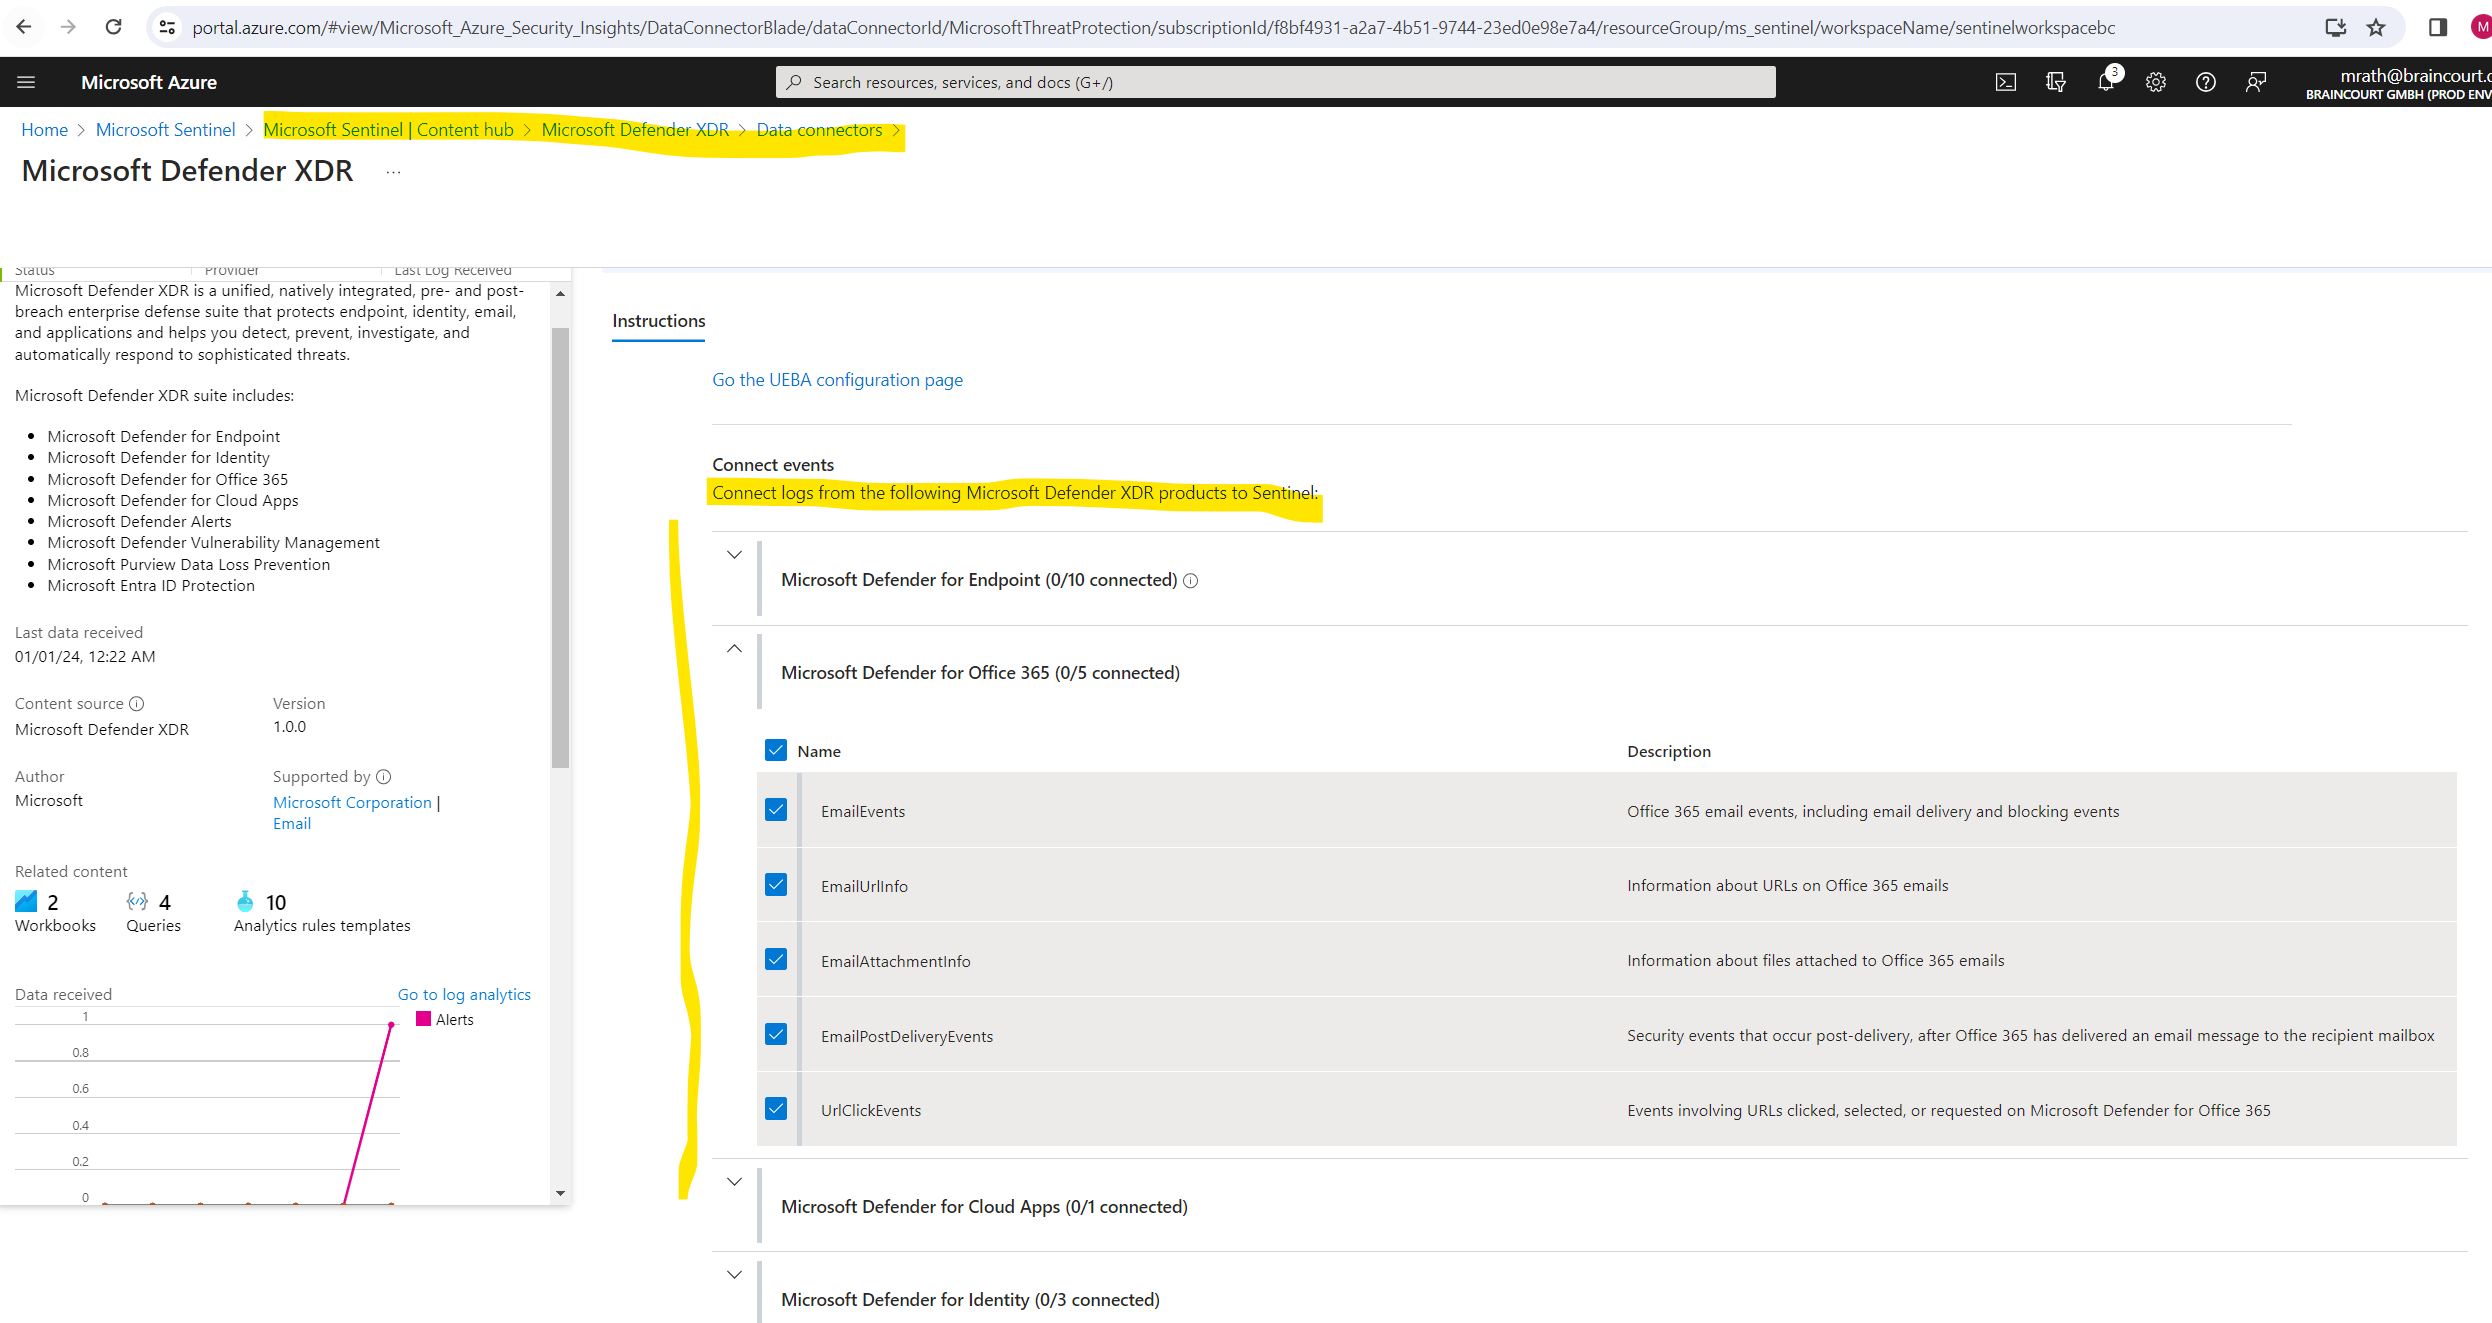
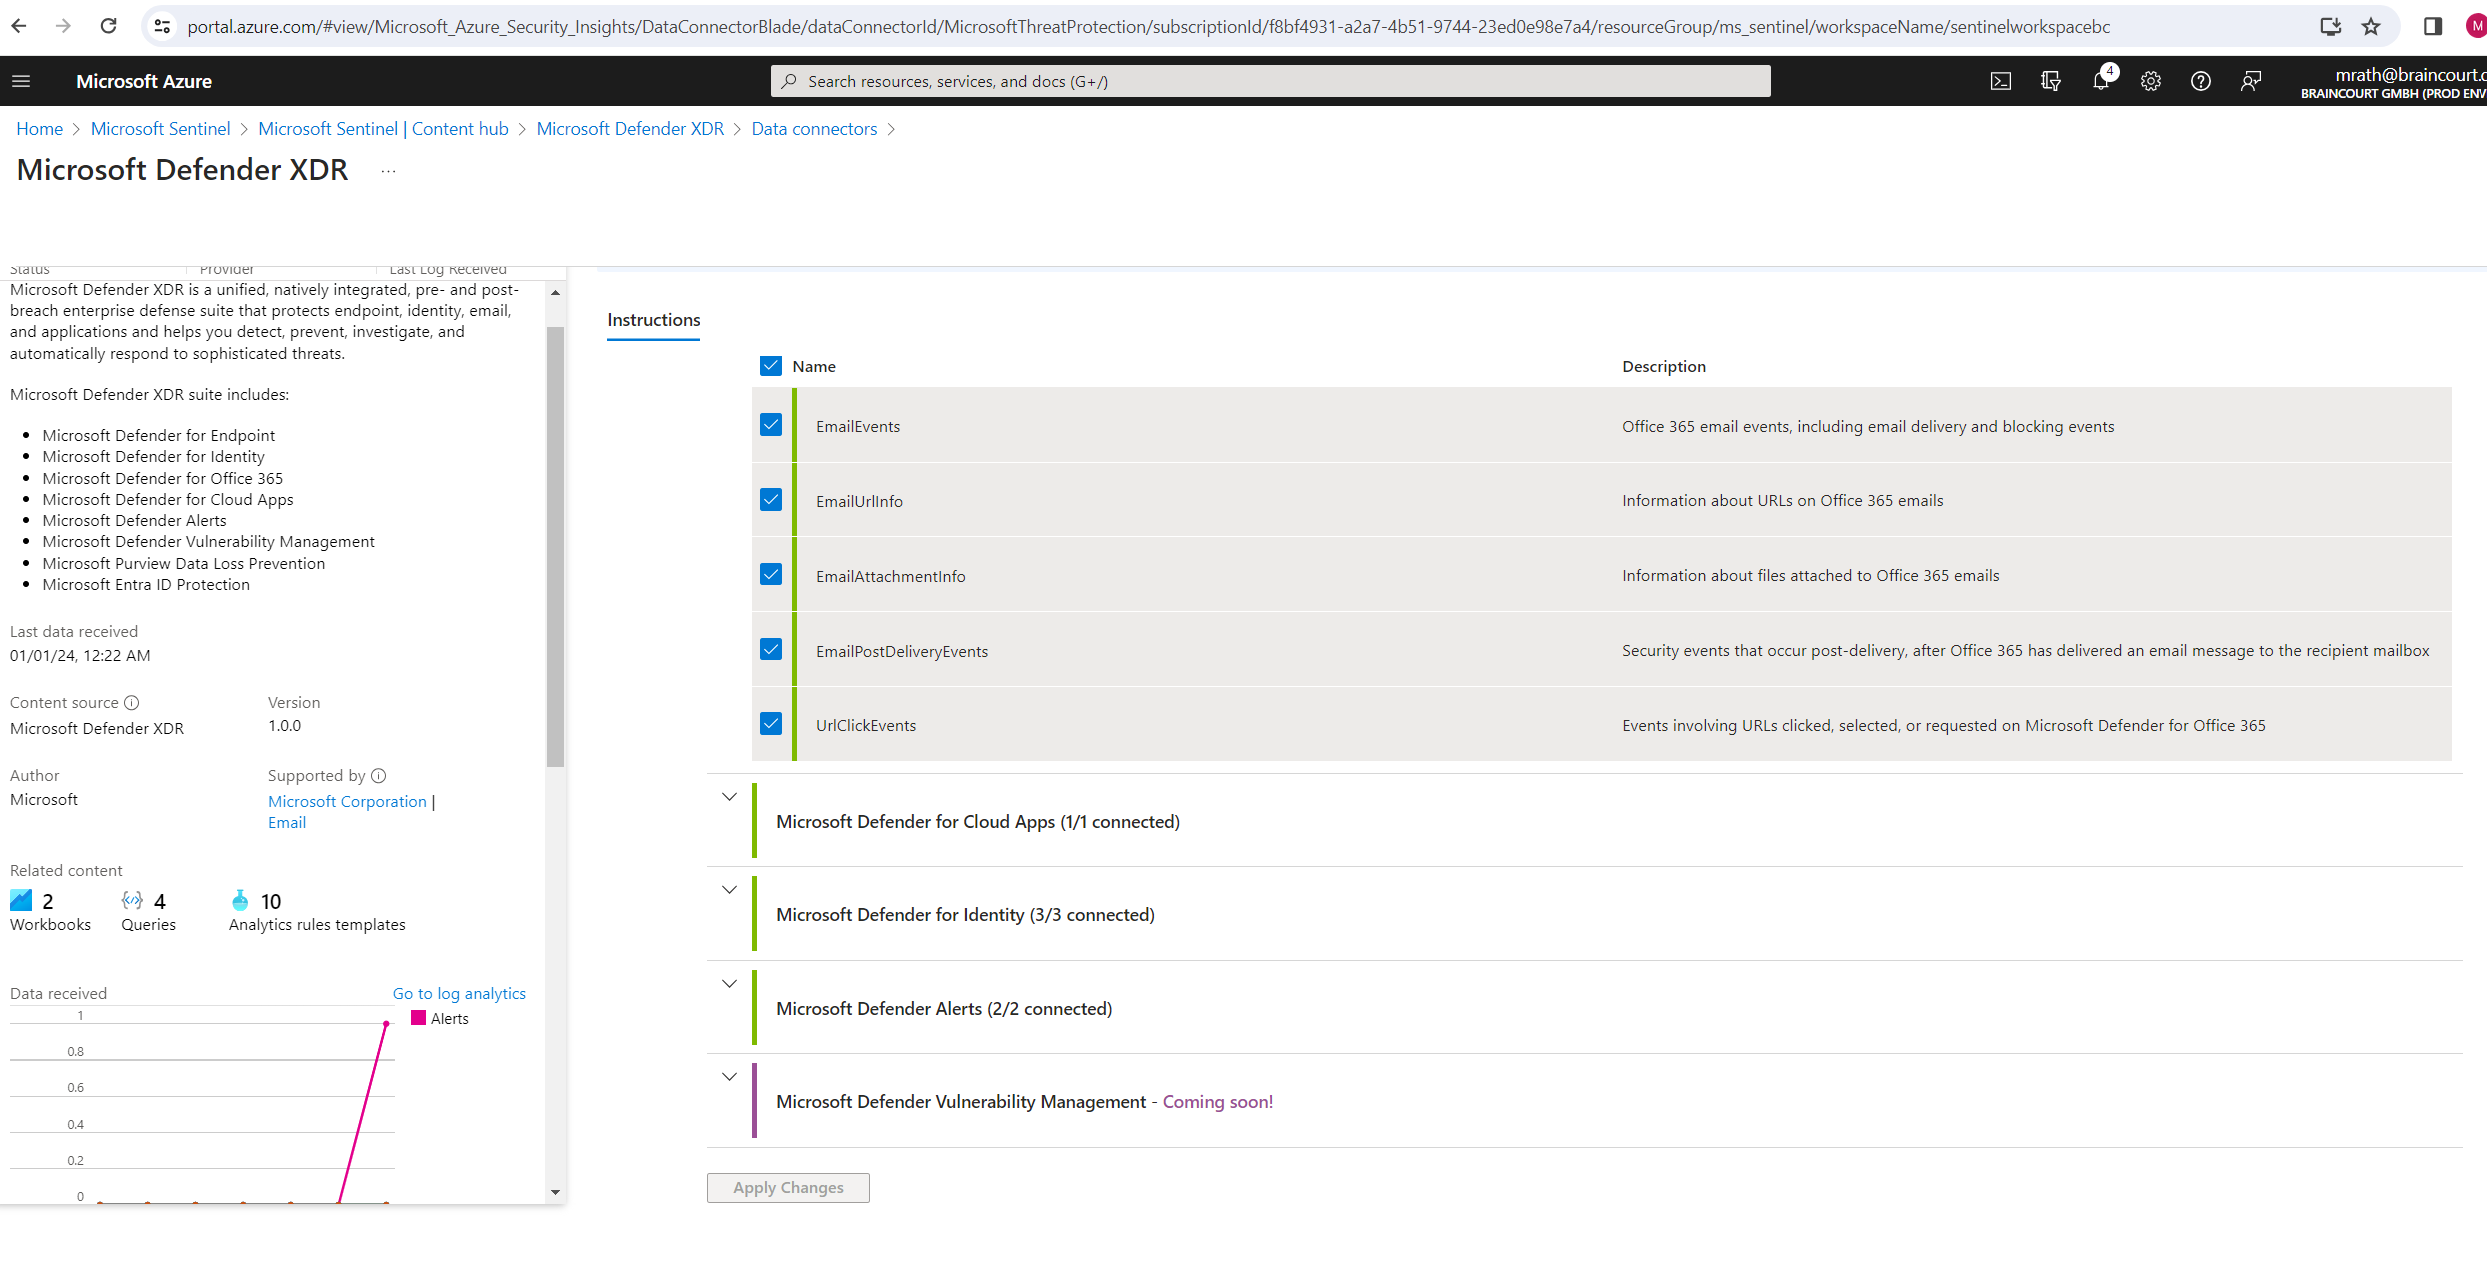
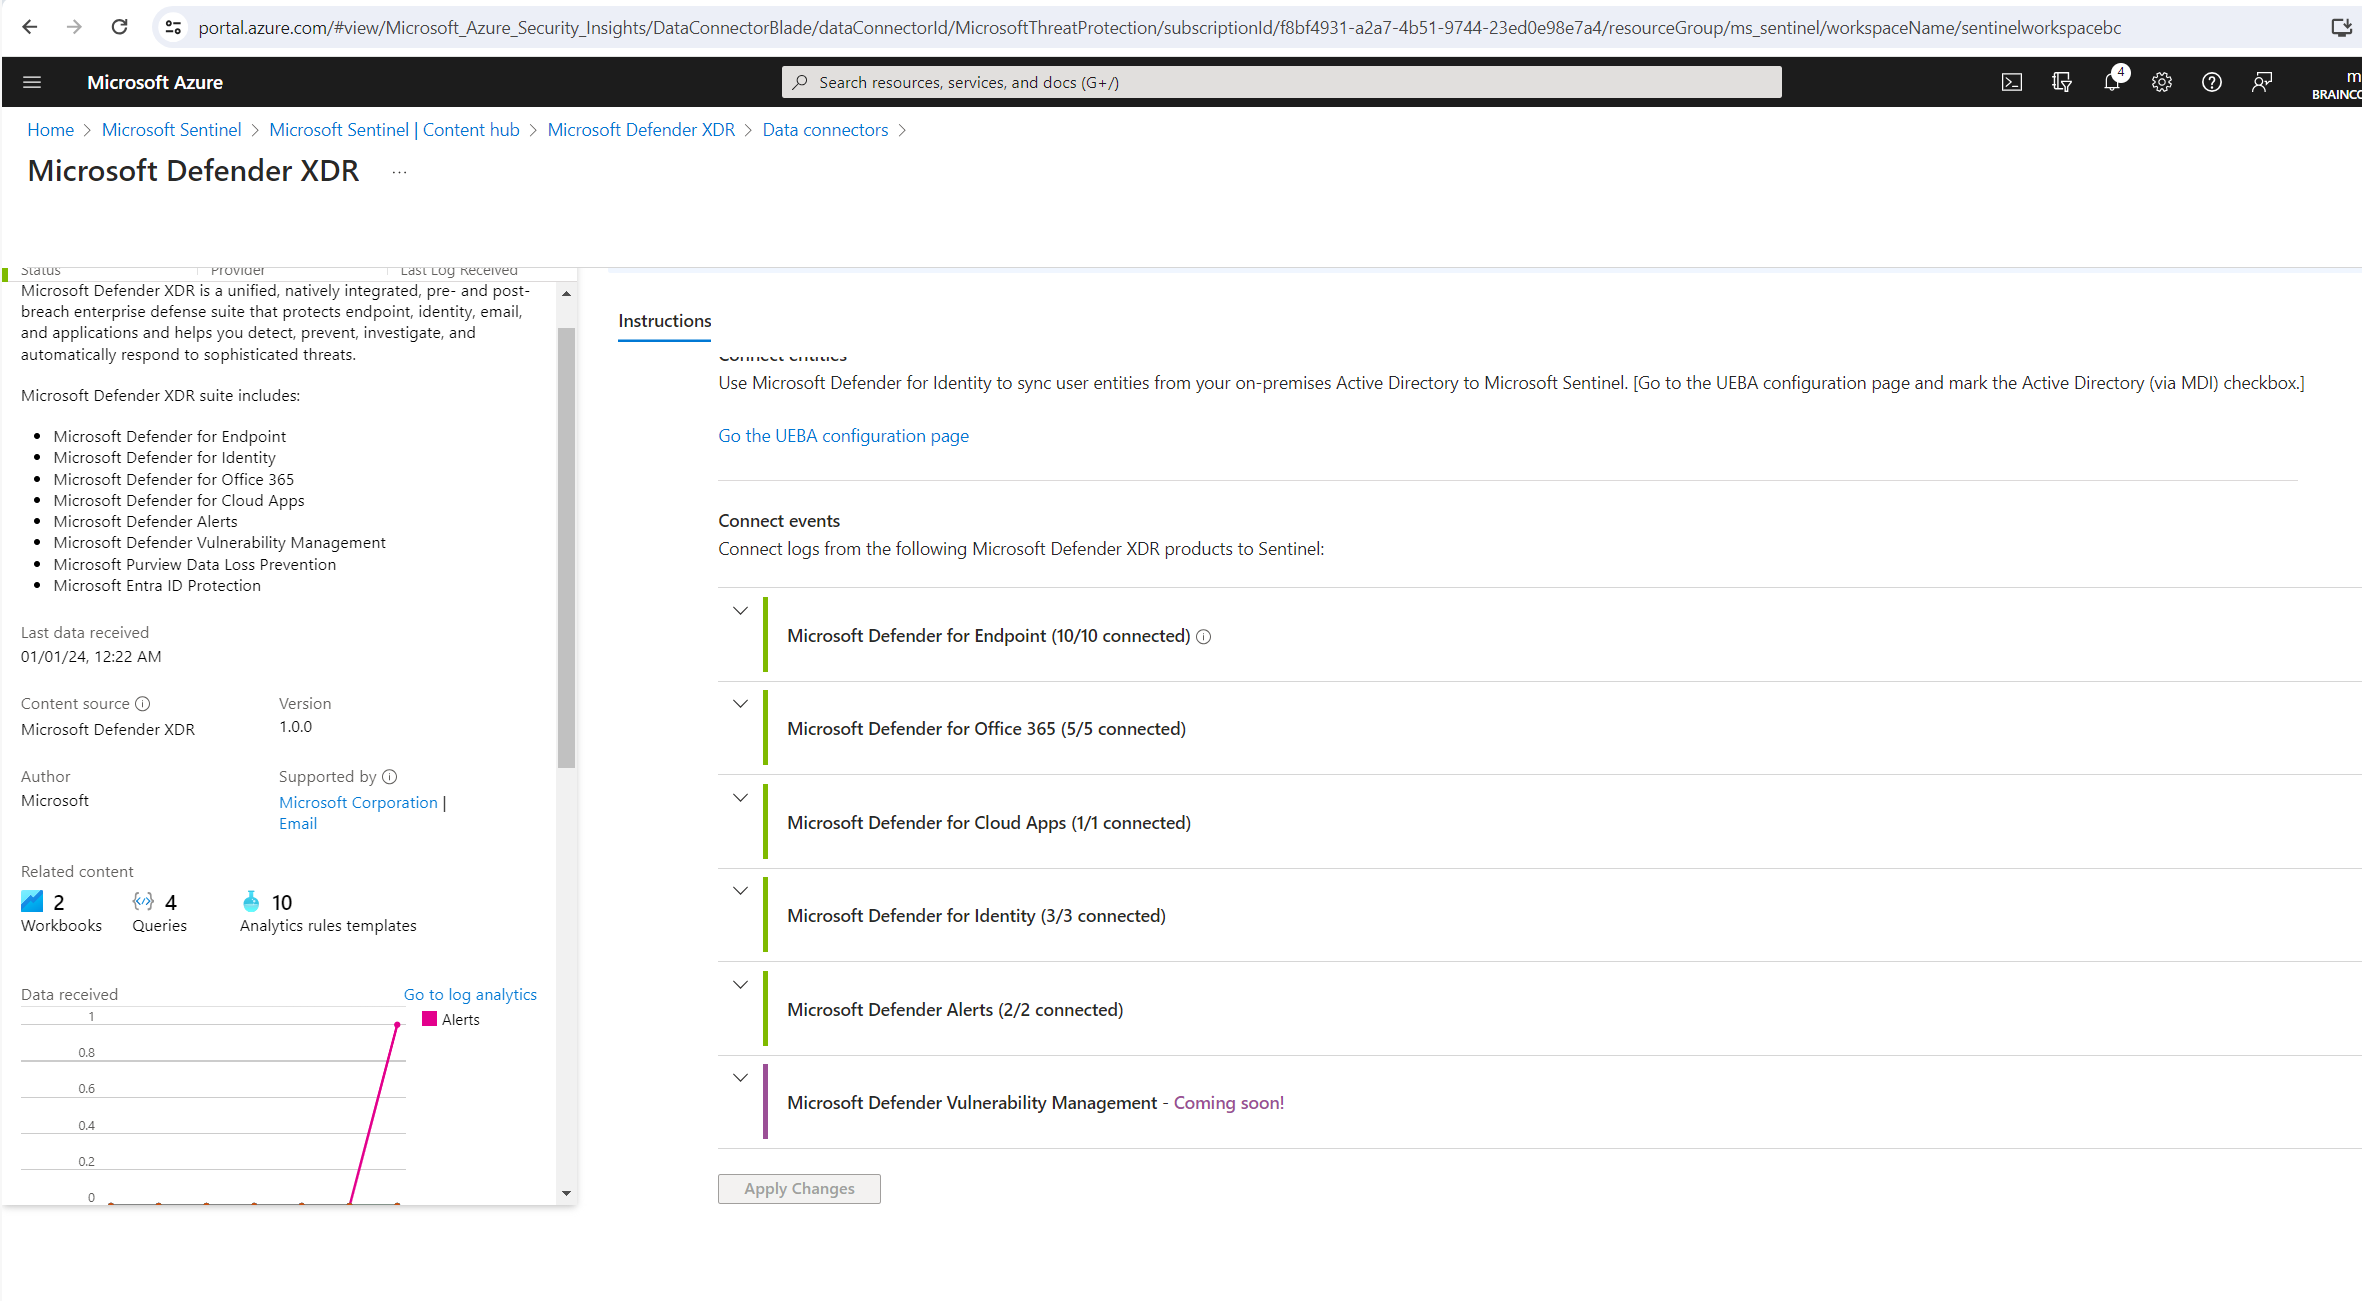
Here scroll down to the Connect events section.
Within the Connect events section you can select what data and logs should be send from the Microsoft Defender XDR products to Microsoft Sentinel.
Monitor and visualize data in Microsoft Sentinel
After you connected your data sources to Microsoft Sentinel, you get instant visualization and analysis of data so that you can know what’s happening across all your connected data sources.
Microsoft Sentinel gives you workbooks that provide you with the full power of tools already available in Azure as well as tables and charts that are built in to provide you with analytics for your logs and queries.
You can either use workbook templates or create a new workbook easily, from scratch or based on an existing workbook.
Get visualization
To visualize and get analysis of what’s happening on your environment, first, take a look at the overview dashboard to get an idea of the security posture of your organization. To help you reduce noise and minimize the number of alerts you have to review and investigate, Microsoft Sentinel uses a fusion technique to correlate alerts into incidents.
Incidents are groups of related alerts that together create an actionable incident that you can investigate and resolve.
In the Azure portal, select Microsoft Sentinel and then select the workspace you want to monitor.
By default you will see here different types of incident data under Incidents.
- On the top left, you see the number of new, active, and closed incidents over the last 24 hours.
- On the top right, you see incidents organized by severity, and closed incidents by closing classification.
- On the bottom left, a graph breaks up the incident status by creation time, in four hour intervals.
- On the bottom right, you can see the mean time to acknowledge an incident and mean time to close, with a link to the SOC efficiency workbook.
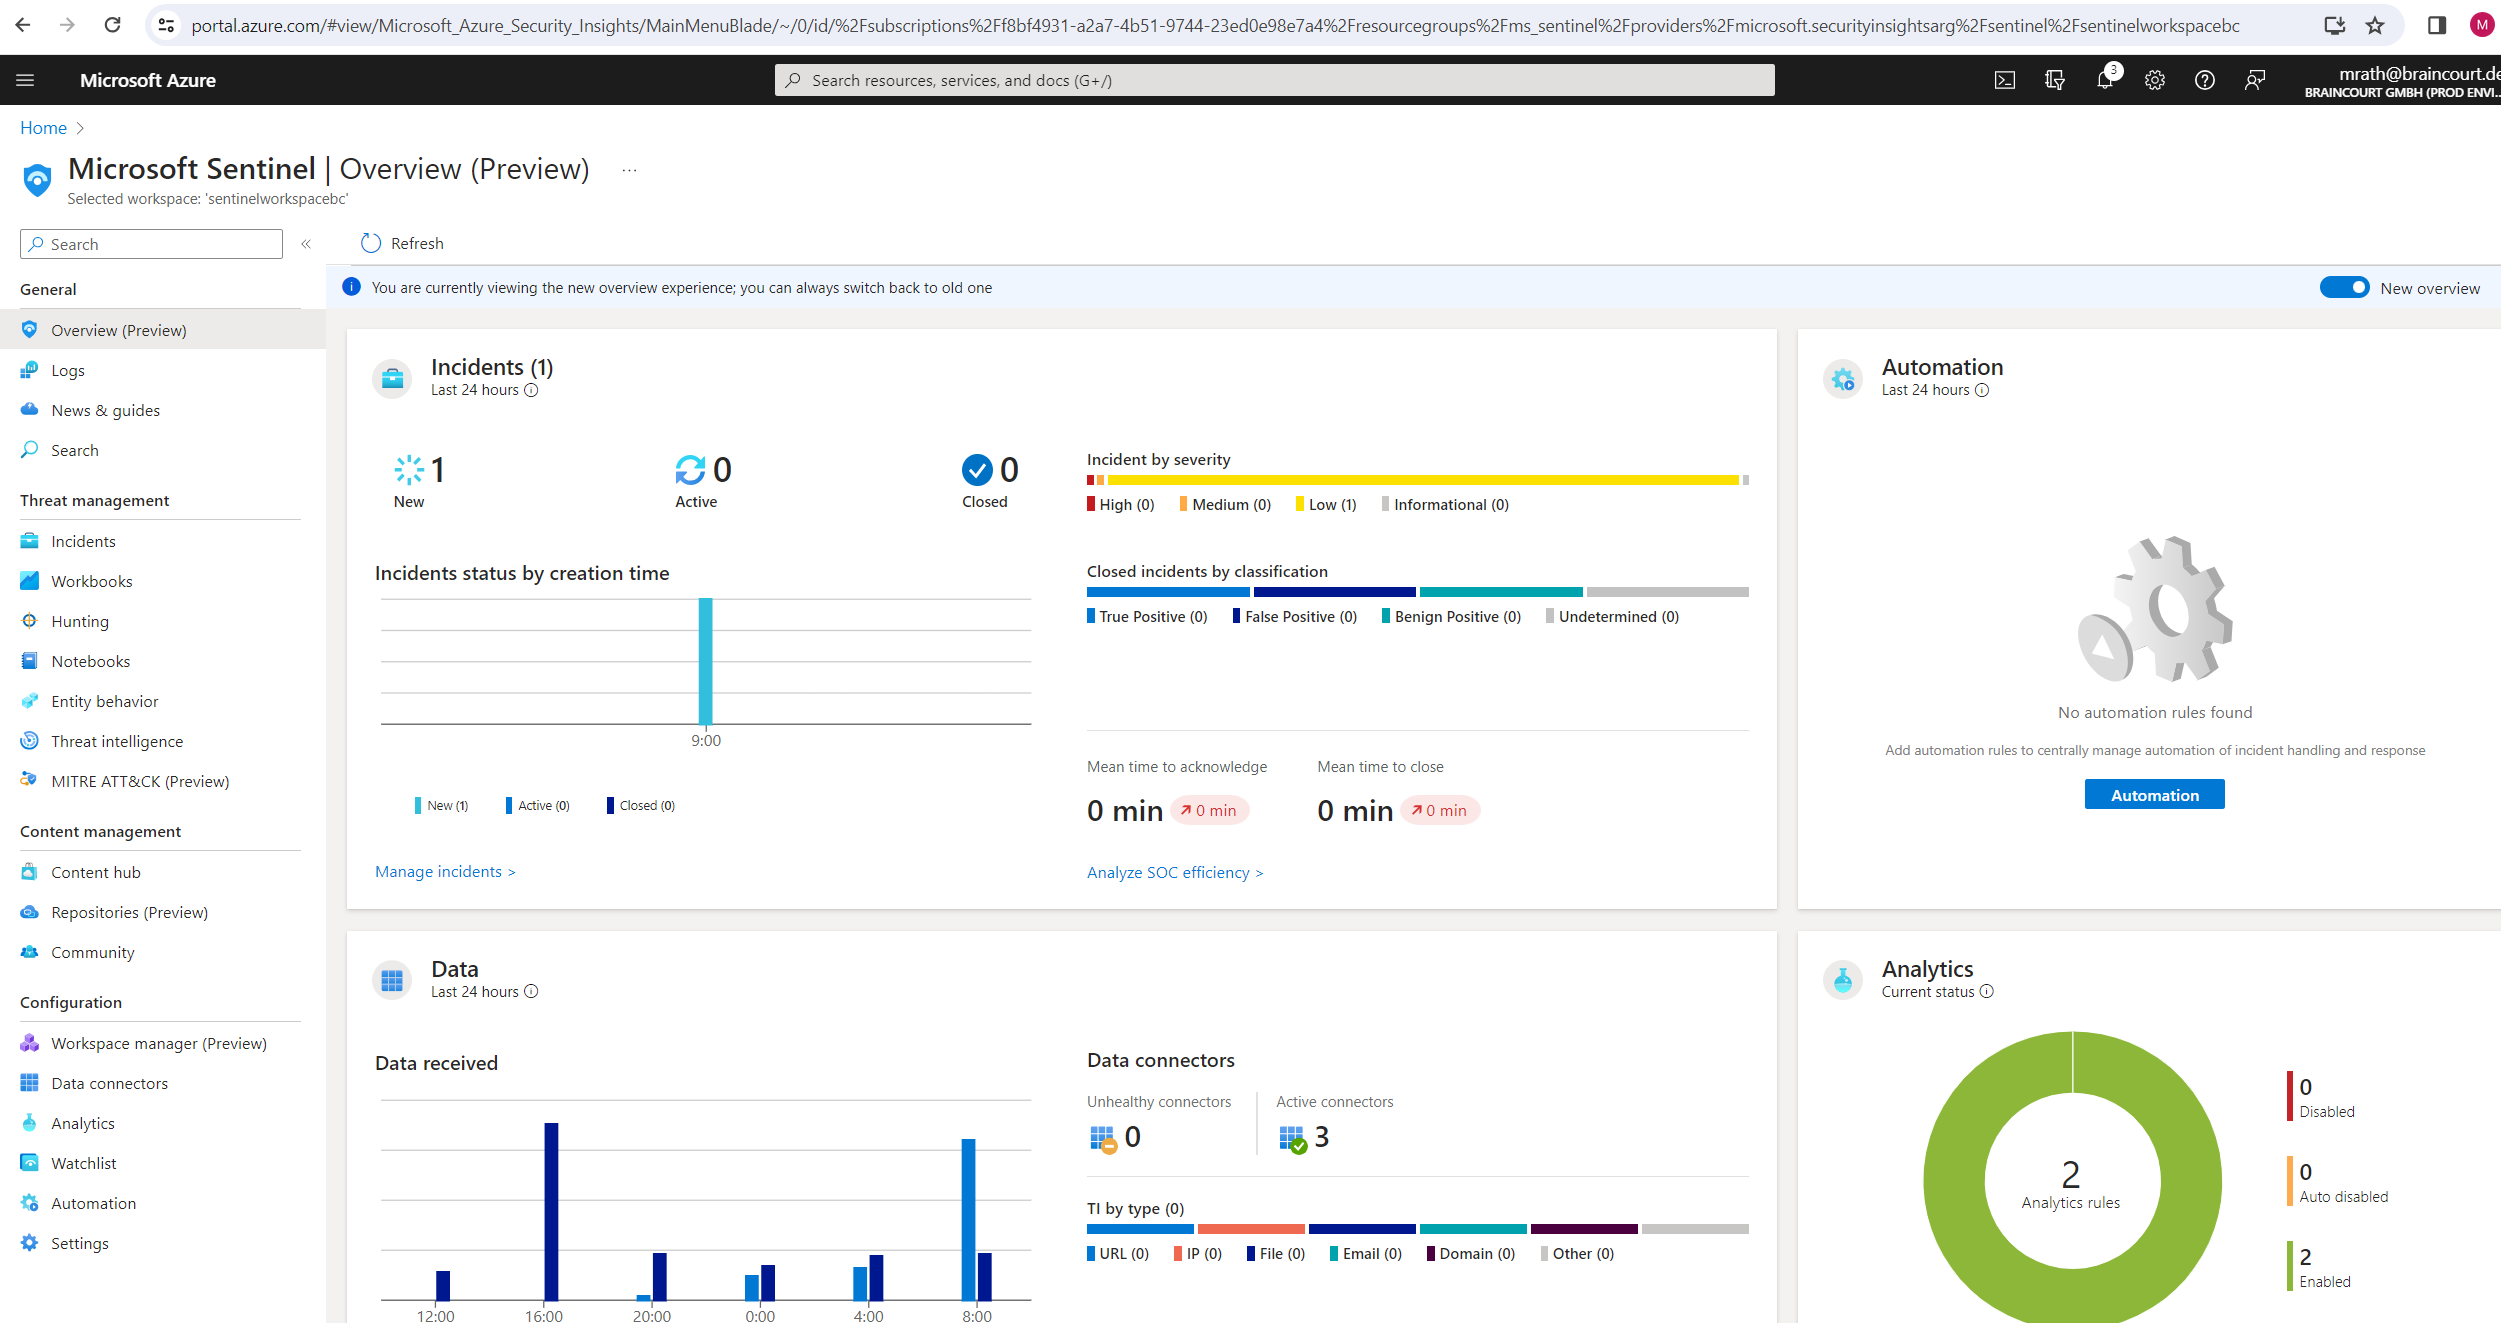
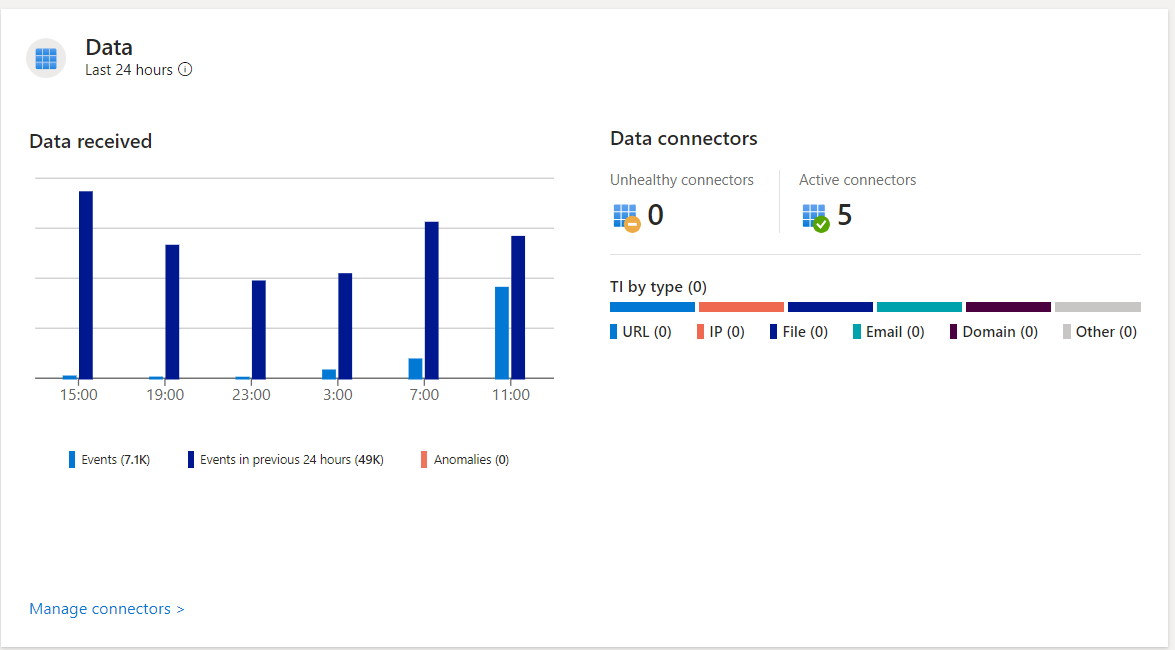
You see different types of data on data records, data collectors, and threat intelligence under Data.
- On the left, a graph shows the number of records that Microsoft Sentinel collected in the last 24 hours, compared to the previous 24 hours, and anomalies detected in that time period.
- On the top right, you see a summary of the data connector status, divided by unhealthy and active connectors. Unhealthy connectors indicate how many connectors have errors. Active connectors are connectors with data streaming into Microsoft Sentinel, as measured by a query included in the connector.
- On the bottom right, you can see threat intelligence records in Microsoft Sentinel, by indicator of compromise.
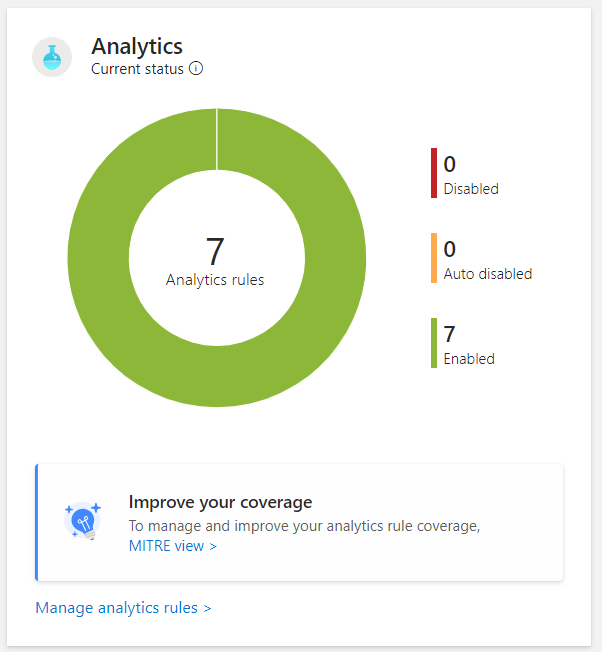
You see data for analytics rules under Analytics. You see the number of analytics rules in Microsoft Sentinel, by enabled, disabled, or auto-disabled status.
After you’ve set up Microsoft Sentinel to collect data from all over your organization, you’ll need to dig through all that data to detect security threats to your environment. But don’t worry, Microsoft Sentinel provides templates to help you create threat detection rules to do all that work for you. These rules are known as analytics rules.
Microsoft’s team of security experts and analysts designed these analytics rule templates based on known threats, common attack vectors, and suspicious activity escalation chains. Rules created from these templates automatically search across your environment for any activity that looks suspicious. Many of the templates can be customized to search for activities, or filter them out, according to your needs. The alerts generated by these rules create incidents that you can assign and investigate in your environment.
Source: https://learn.microsoft.com/en-us/azure/sentinel/detect-threats-built-in
Sentinel Workbooks (templates)
Workbook templates provide integrated data from your connected data sources to let you deep dive into the events generated in those services.
Workbook templates include Microsoft Entra ID, Azure activity events, and on-premises, which can be data from Windows Events from servers, from first party alerts, from any third-party including firewall traffic logs, Office 365, and insecure protocols based on Windows events. The workbooks are based on Azure Monitor Workbooks to provide you with enhanced customizability and flexibility in designing your own workbook. For more information, see Workbooks.
Source: https://learn.microsoft.com/en-us/azure/sentinel/get-visibility
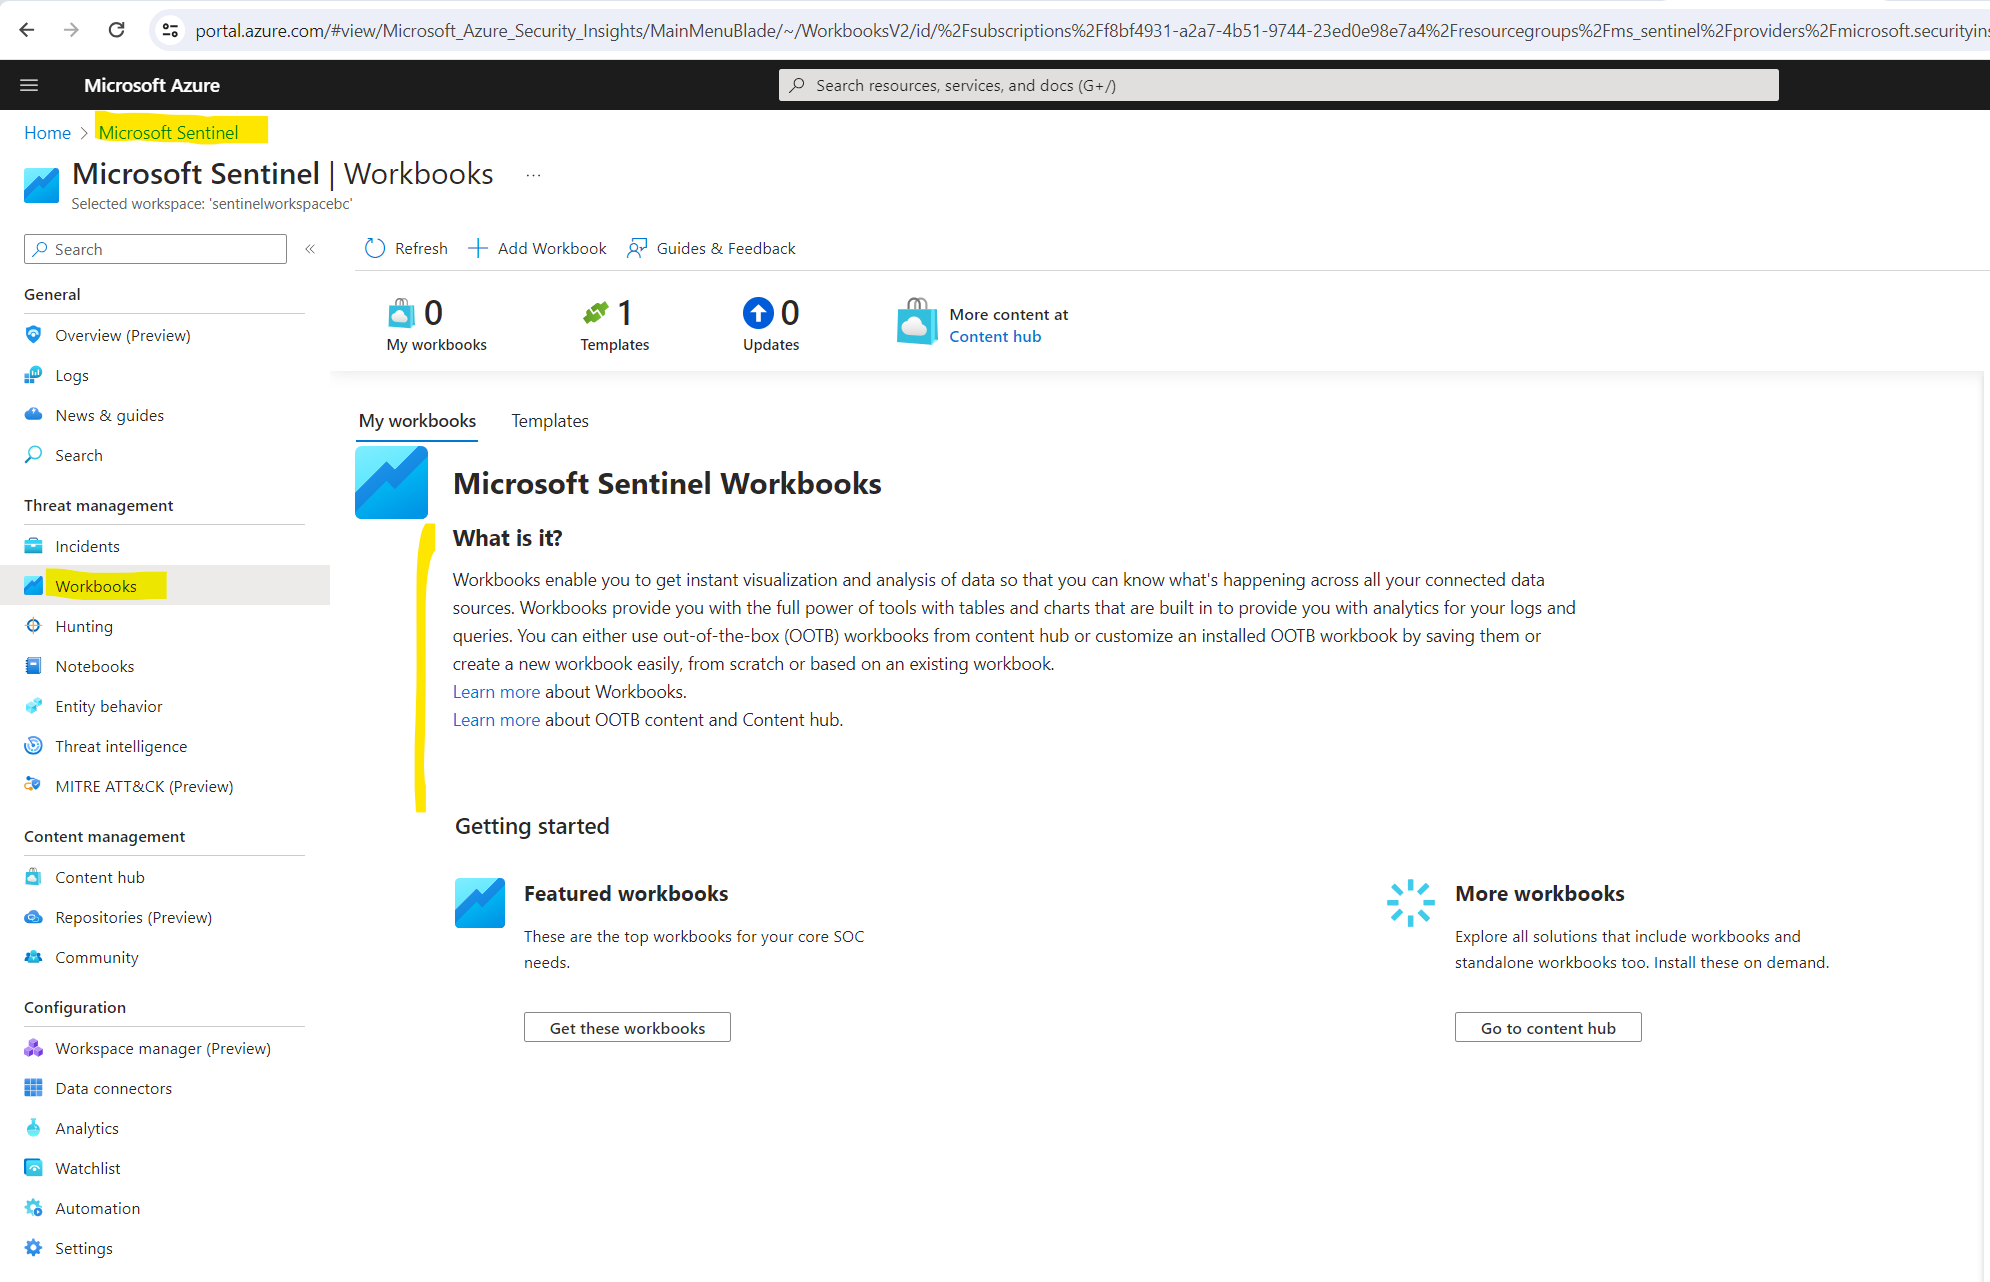
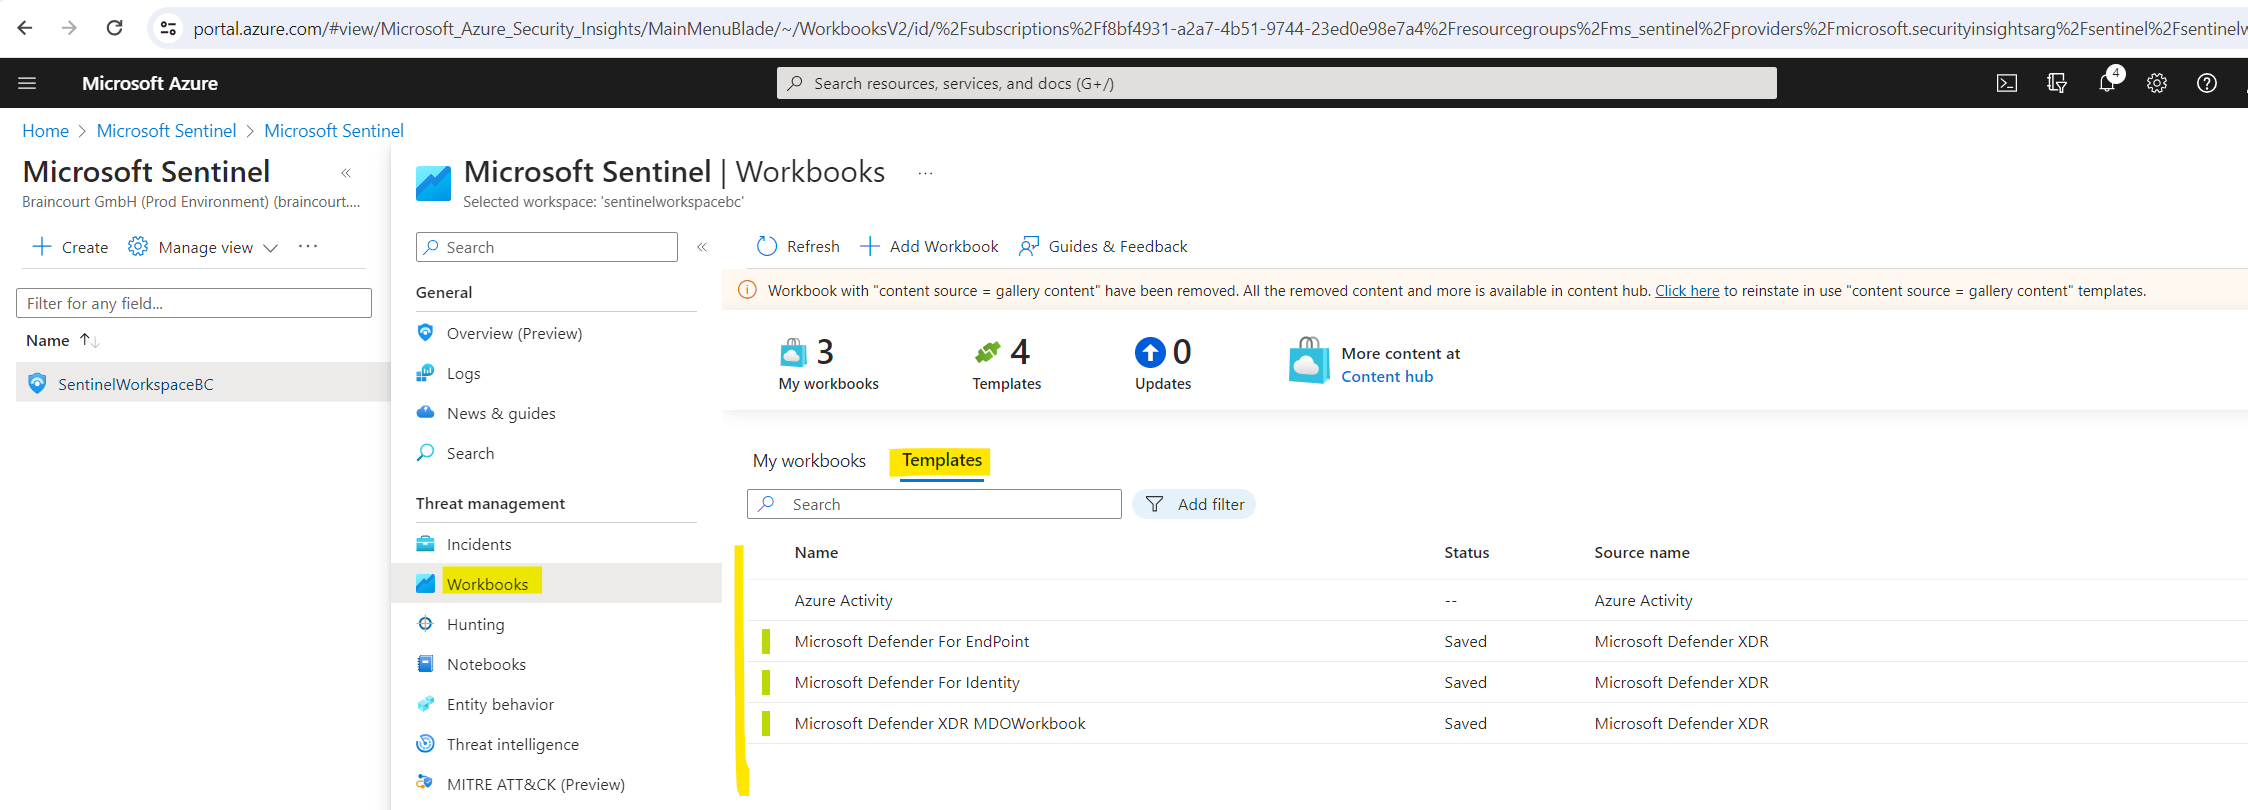
As mentioned these workbook templates provides you out of the box integrated data from your connected data sources to let you deep dive into the events generated in those services.
You can also customize these workbook templates, therefore you first need to save a workbook template which will create a workbook based on the selected template in the My workbooks tabs.
These workbooks you can then customize by first view the saved workbook and then click on Edit.
You can also create a new workbook from scratch.
More about using workbook templates you will find here https://learn.microsoft.com/en-us/azure/sentinel/get-visibility#use-workbooks-templates.
Analytics rules (templates)
As already mentioned above, analytics rules will help you to dig through all the collected data to detect security threats to your environment.
Microsoft’s team of security experts and analysts designed these analytics rule templates based on known threats, common attack vectors, and suspicious activity escalation chains. Rules created from these templates automatically search across your environment for any activity that looks suspicious.
Many of the templates can be customized to search for activities, or filter them out, according to your needs. The alerts generated by these rules create incidents that you can assign and investigate in your environment.
To view the installed analytics rules and detections in Microsoft Sentinel, go to Analytics > Rule templates. This tab contains all the installed rule templates, according to the types displayed in the following table. To find more rule templates, go to the Content hub in Microsoft Sentinel to install the related product solutions or standalone content.
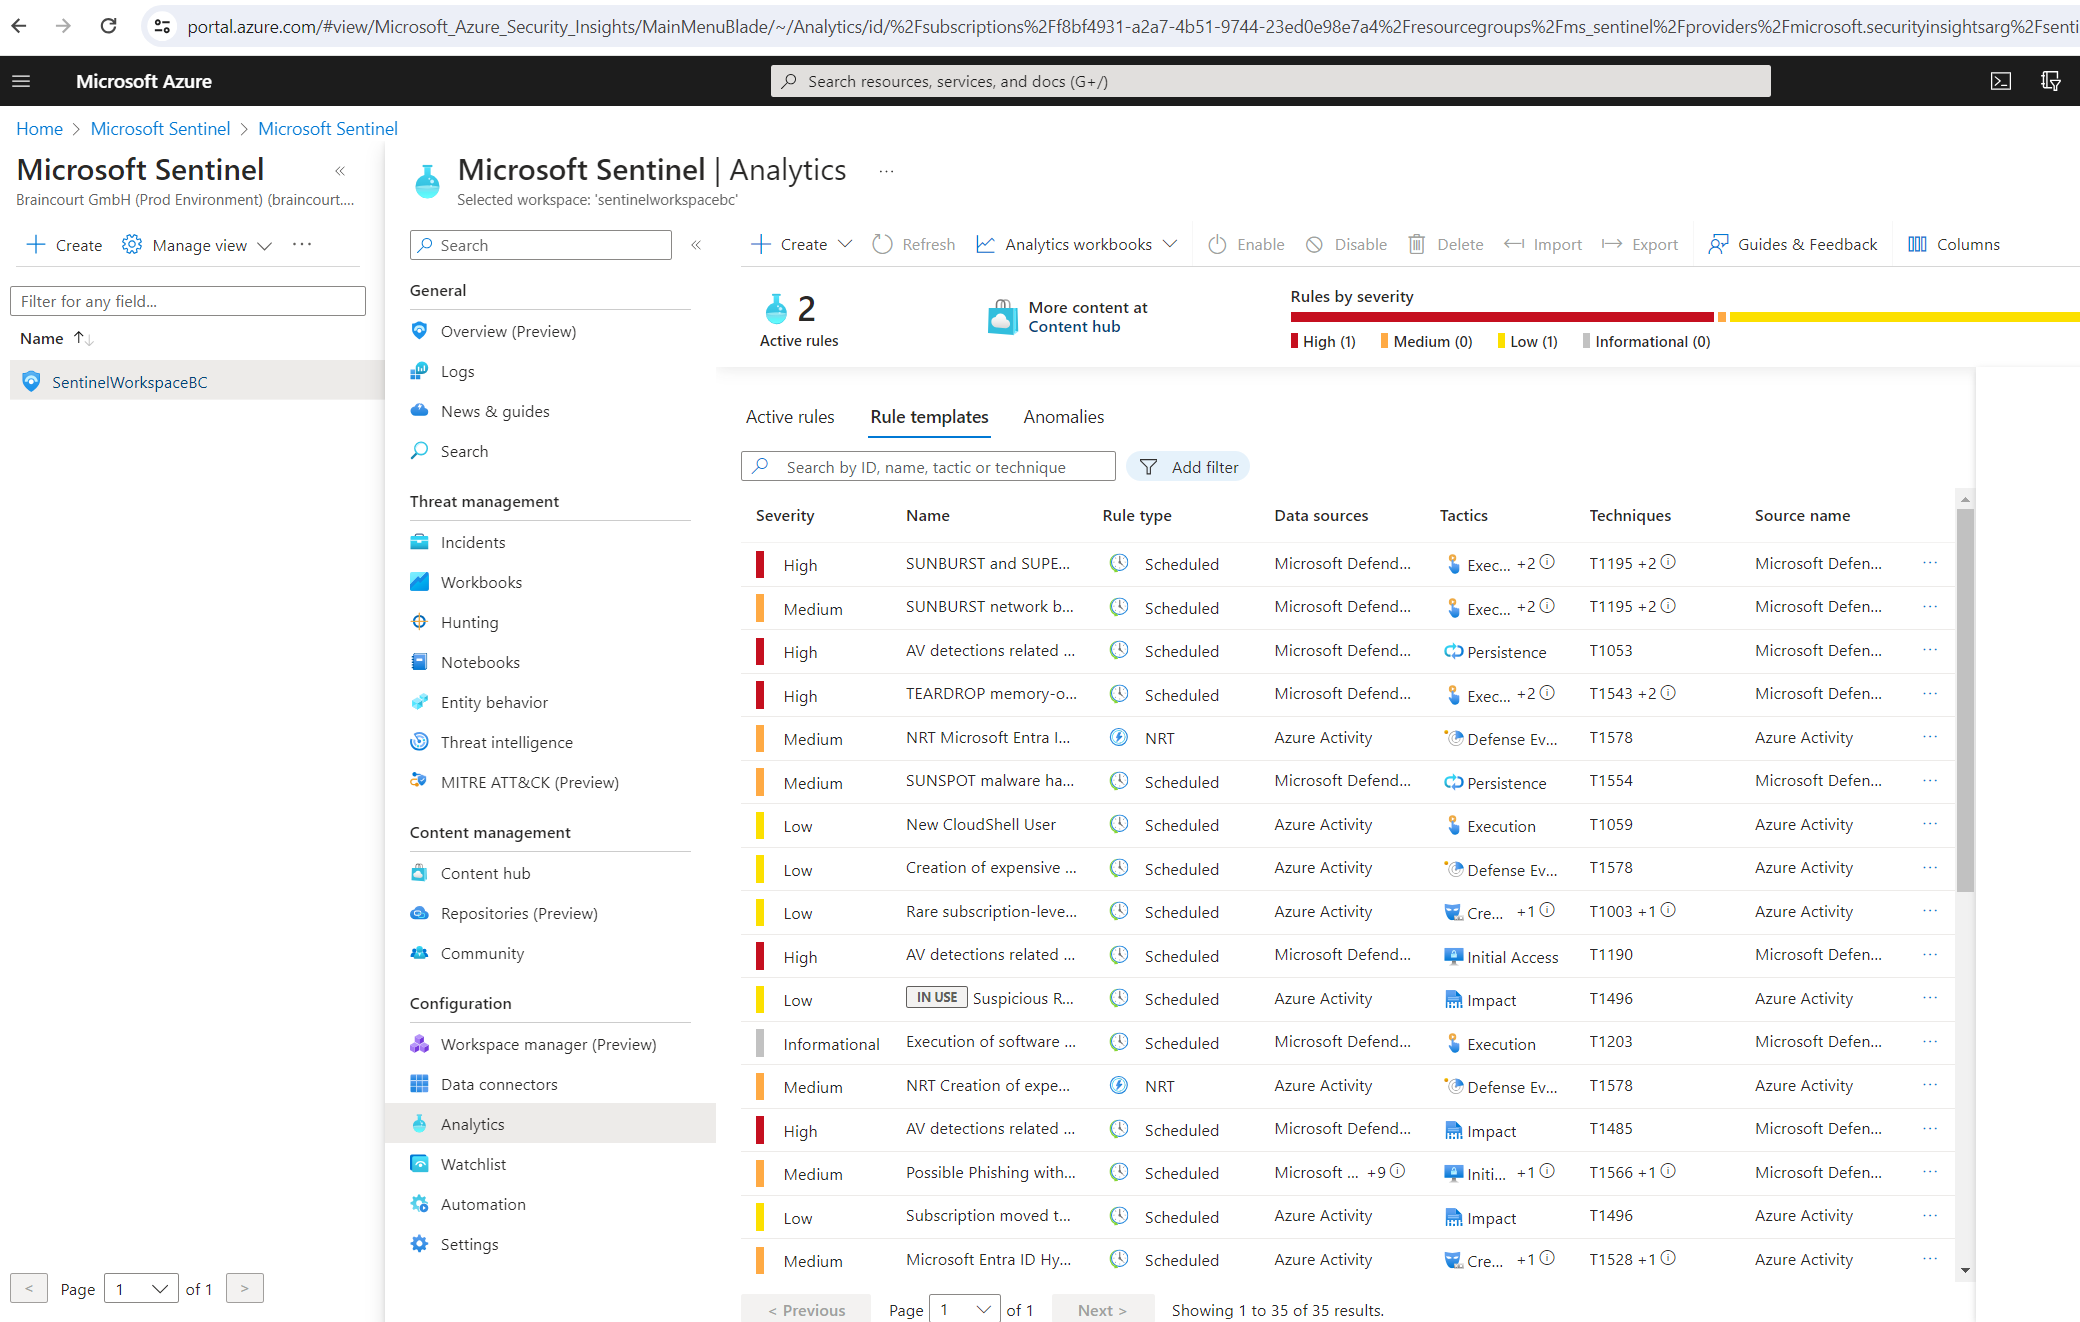
To create a new rule in order to detect threats within all the collected logs and data, use the templates as follows.
In the Microsoft Sentinel > Analytics > Rule templates page, select a template name, and then select the Create rule button on the details pane to create a new active rule based on that template.
Each template has a list of required data sources. When you open the template, the data sources are automatically checked for availability. If there’s an availability issue, the Create rule button may be disabled, or you may see a warning to that effect.
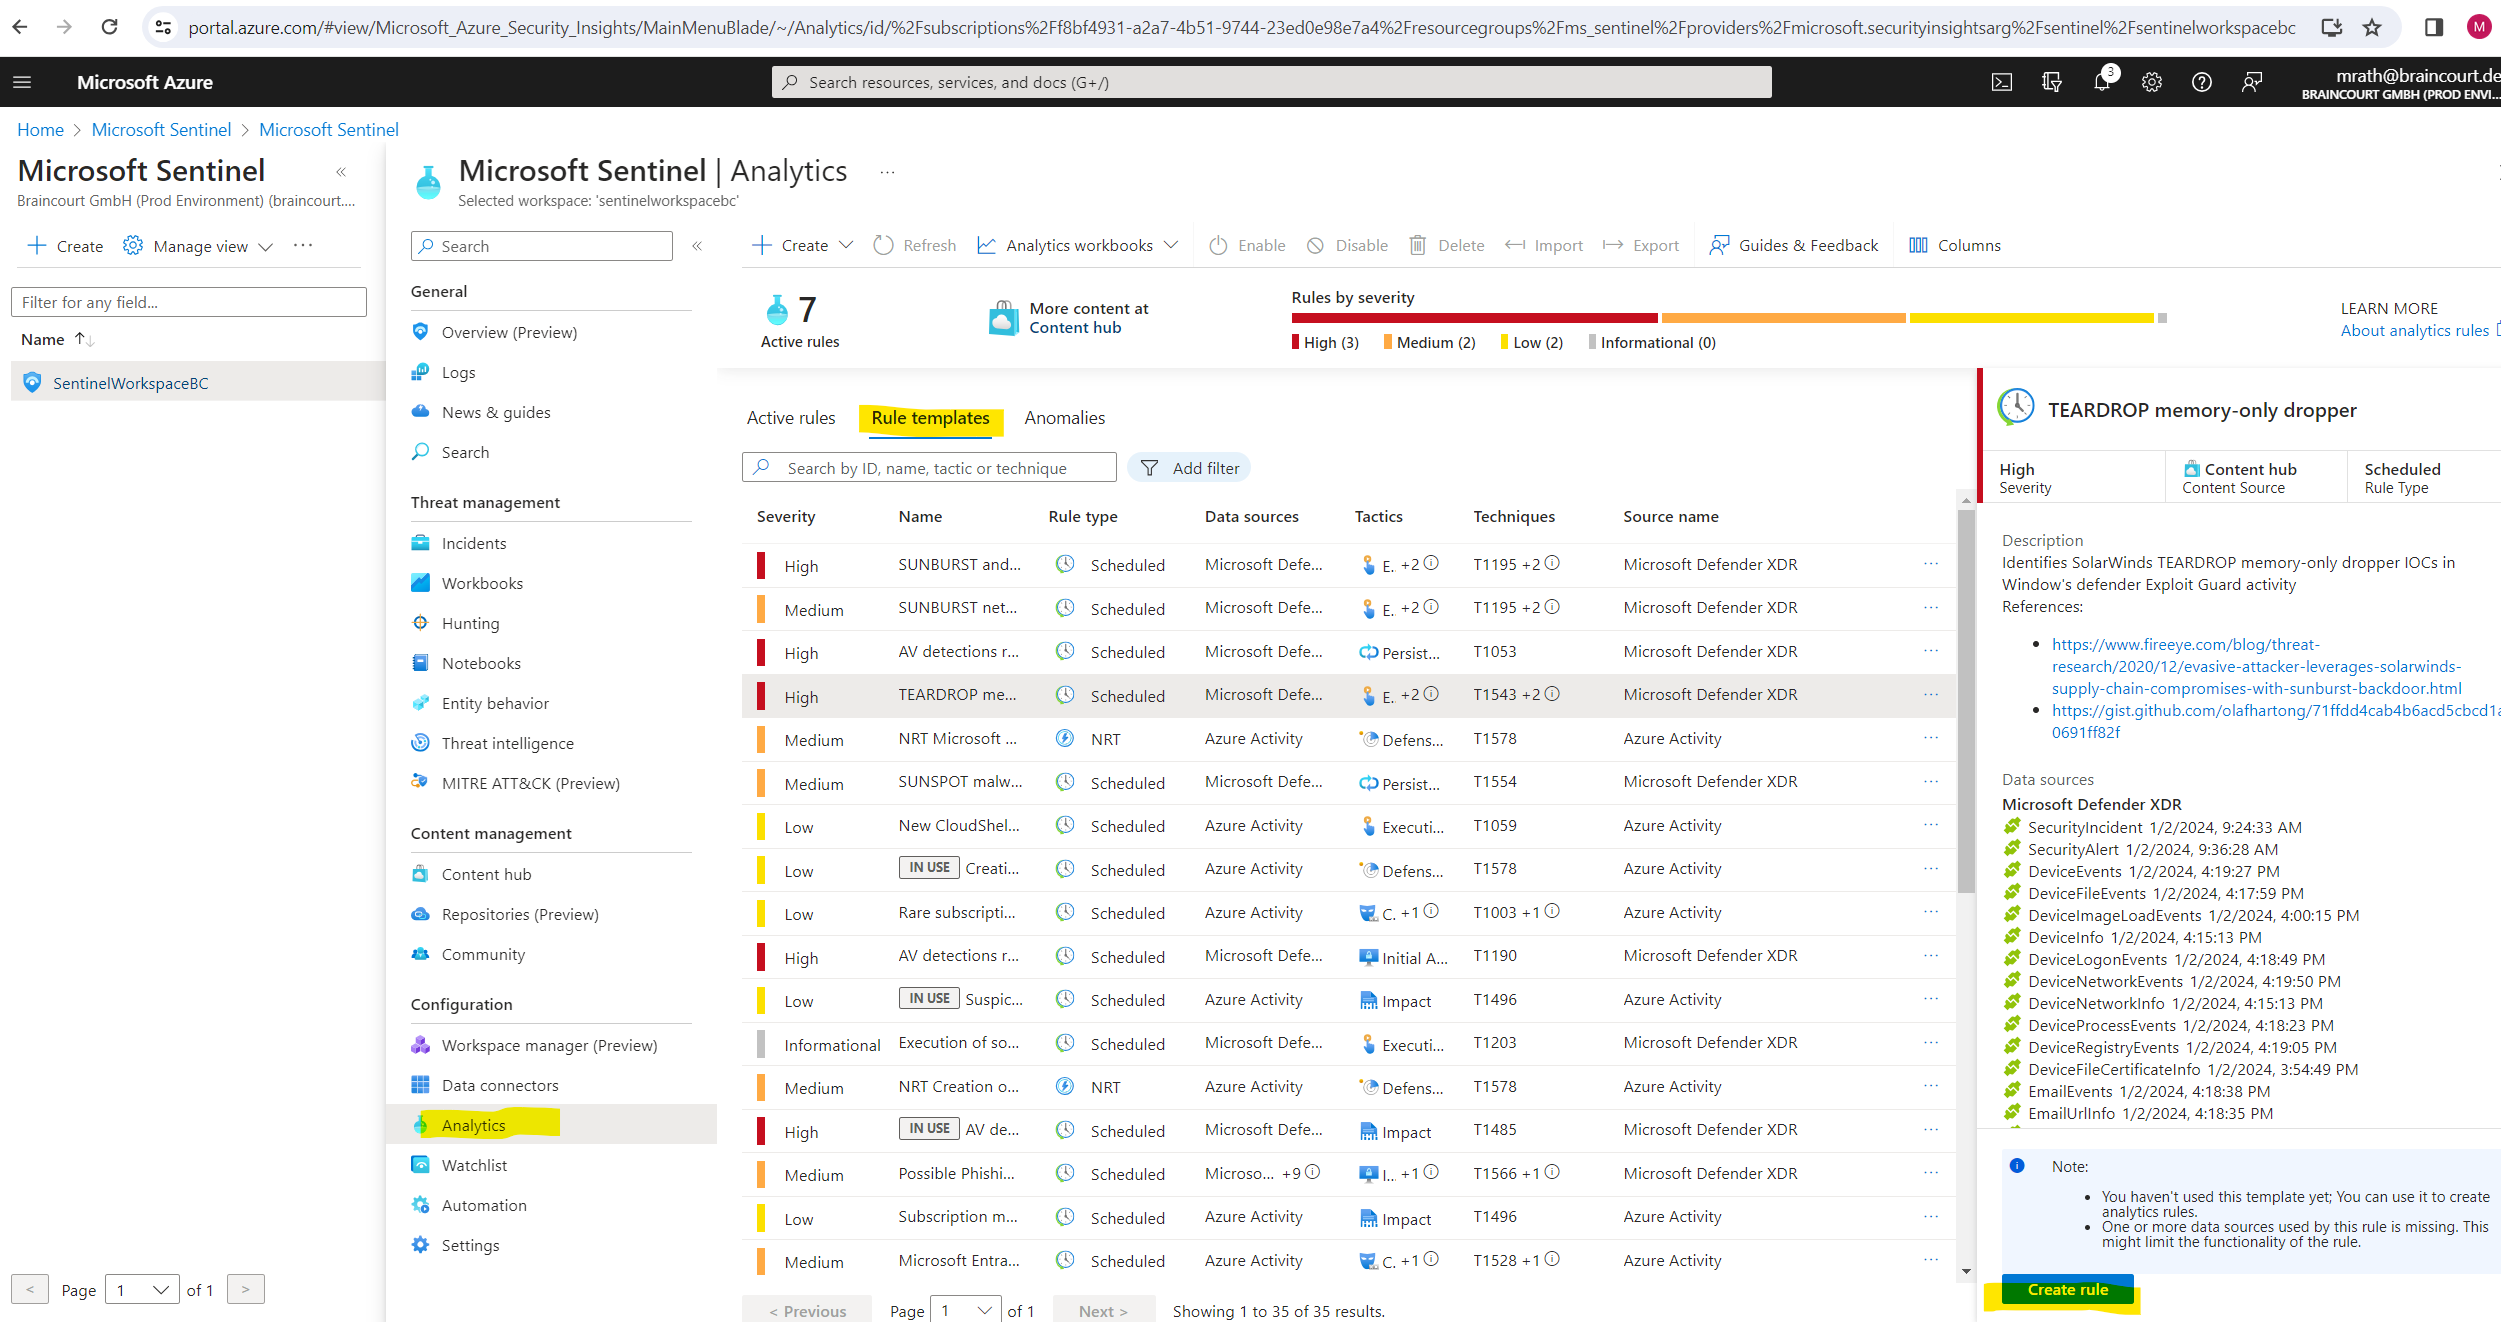
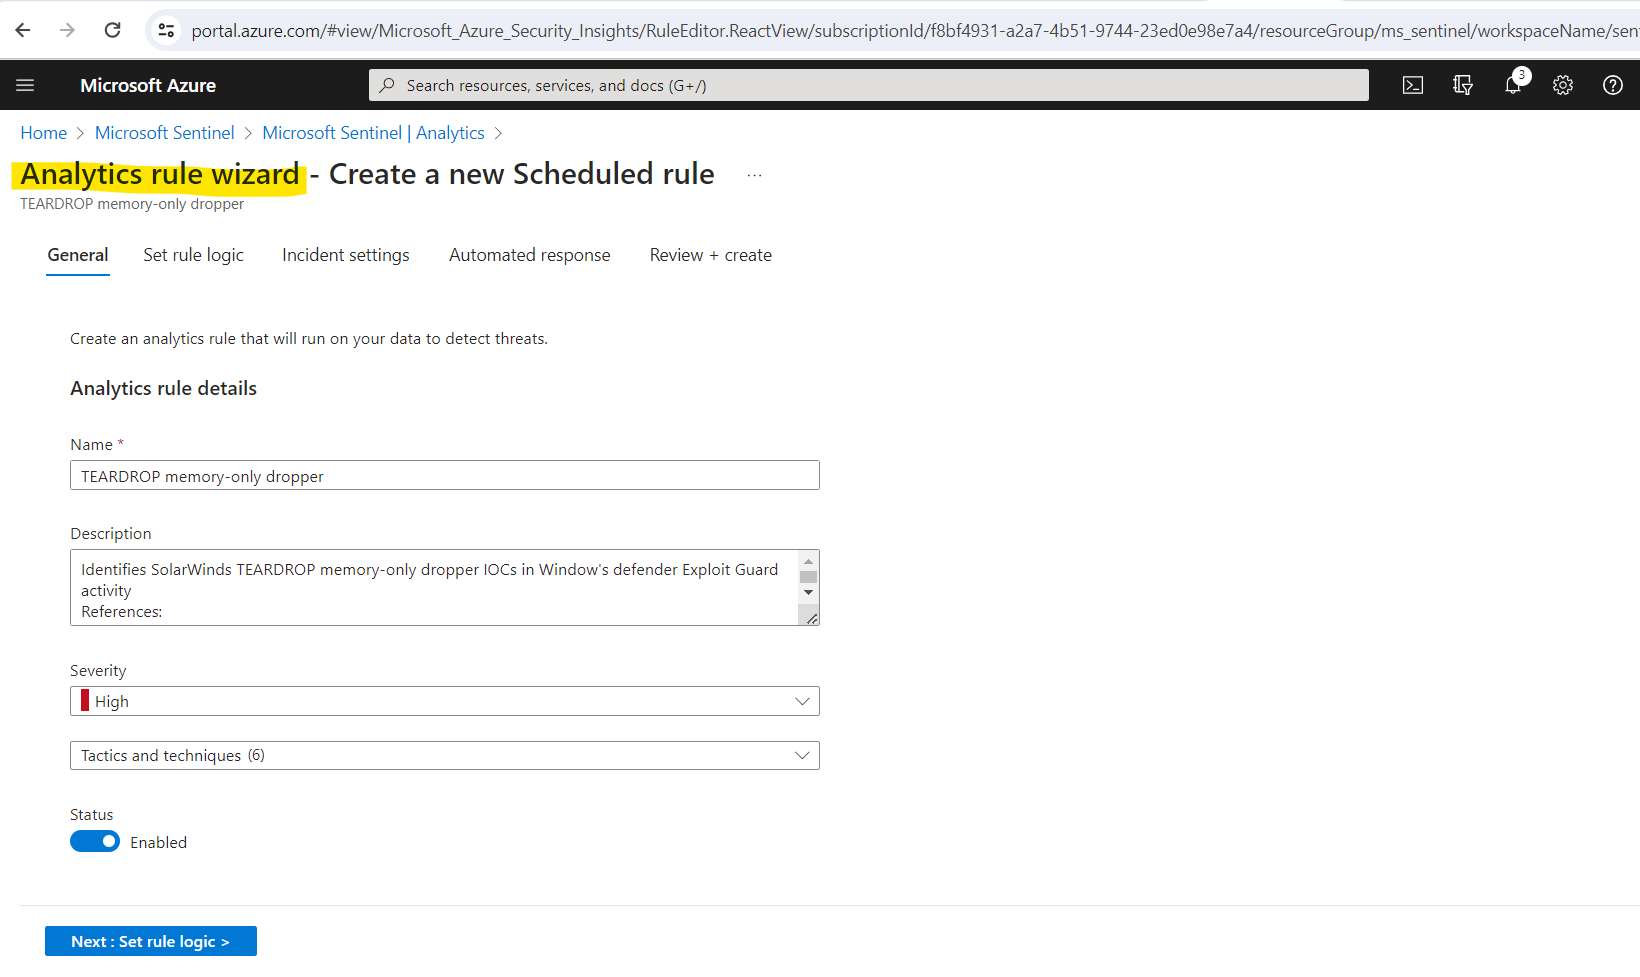
Selecting Create rule opens the rule creation wizard based on the selected template. All the details are autofilled, and with the Scheduled or Microsoft security templates, you can customize the logic and other rule settings to better suit your specific needs. You can repeat this process to create more rules based on the template. After following the steps in the rule creation wizard to the end, you finished creating a rule based on the template. The new rules appear in the Active rules tab.
Source: https://learn.microsoft.com/en-us/azure/sentinel/detect-threats-built-in
Azure Monitor vs. Microsoft Sentinel
Azure Monitor is primarily for monitoring the performance and health of Azure resources, while Microsoft Sentinel is designed for security operations, offering advanced tools for detecting and responding to security threats across a broader range of environments.
Organizations often use both services in combination to ensure comprehensive monitoring and security for their Azure-based infrastructure.
Links
What is Microsoft Sentinel?
https://learn.microsoft.com/en-us/azure/sentinel/overviewTutorial: Detect threats by using analytics rules in Microsoft Sentinel
https://learn.microsoft.com/en-us/azure/sentinel/tutorial-log4j-detectionMicrosoft Sentinel data connectors
https://learn.microsoft.com/en-us/azure/sentinel/connect-data-sourcesMicrosoft Defender XDR integration with Microsoft Sentinel
https://learn.microsoft.com/en-us/azure/sentinel/microsoft-365-defender-sentinel-integrationAzure Workbooks
https://learn.microsoft.com/en-us/azure/azure-monitor/visualize/workbooks-overviewVisualize and monitor your data by using workbooks in Microsoft Sentinel
https://learn.microsoft.com/en-us/azure/sentinel/monitor-your-dataBest practices for Microsoft Sentinel
https://learn.microsoft.com/en-us/azure/sentinel/best-practicesAzure Monitor documentation
https://learn.microsoft.com/en-us/azure/azure-monitor/Security Orchestration, Automation, and Response (SOAR) in Microsoft Sentinel
https://learn.microsoft.com/en-us/azure/sentinel/automationAutomate threat response in Microsoft Sentinel with automation rules
https://learn.microsoft.com/en-us/azure/sentinel/automate-incident-handling-with-automation-rulesAutomate threat response with playbooks in Microsoft Sentinel
https://learn.microsoft.com/en-us/azure/sentinel/automate-responses-with-playbooks