Mastering Azure Monitor (Log Analytics) and Azure Resource Graph
In this post, we will see how Azure Monitor’s Log Analytics tool can be used to query different signals, from telemetry logs to Azure Resource Graph (ARG) inventory data.
In Azure Monitor, a signal is simply a stream of data that can trigger insights or alerts, such as metrics, logs, activity events, or health information.
Azure Resource Graph (ARG) is Azure’s inventory database: it stores metadata about all your resources across subscriptions, such as type, location, tags, and configuration. It doesn’t hold performance metrics or telemetry logs, those live in Metrics and Log Analytics.
ARG is ideal for large-scale inventory, governance, and compliance queries.
We will see how to set up a Log Analytics workspace, connect our resources to it, and run powerful KQL queries across both log and ARG inventory data.
Finally, we will creating alerts based on these queries, so we can turn insights from Log Analytics and Azure Resource Graph (ARG) into actionable notifications.
About how to get notified about patch installation states (like e.g. Succeeded or Failed) per email by using Azure Monitor alerts, you can also read my following post.
Or about monitoring scheduled events to get notified per Email about upcoming maintenance events that could affect our virtual machines running in Azure and how to build some basic automation that can help with monitoring and analysis.
We will see here also how to use Azure Monitor.
Introduction
Azure Monitor is Microsoft’s central platform for collecting, analyzing, and acting on telemetry from our Azure resources, applications, and the underlying infrastructure.
It brings together performance data (metrics), operational and diagnostic data (logs in Log Analytics), platform events like Activity Logs, and service health information into one place.
With this data, you can build dashboards, run queries, set up alerts, and even trigger automated actions to keep your environment healthy and compliant.
In Azure Monitor, alerts can be created on top of several different data sources. The most common are Metrics and Logs.
Metrics are numeric performance values, like CPU percentage or disk IOPS (Input/Output Operations Per Second), collected at short intervals and stored in the Azure Monitor metrics database.
Logs are detailed event records stored in a Log Analytics workspace, where you can query them with Kusto Query Language (KQL).
Logs let you build powerful alert conditions for telemetry, audit events, or security signals.
It’s important to note that Azure Monitor is the overarching service, and Log Analytics is just one of its components.
Azure Monitor also includes the metrics platform, Application Insights, Activity Logs, Resource Health, Service Health, and the alerts framework itself.
With the integration of Azure Resource Graph (ARG) into Log Analytics (shown below), you can even trigger alerts based on inventory data, for example, firing an alert if the number of virtual machines in a subscription falls below a threshold.
Azure Monitor is the platform and Log Analytics is the log engine inside it.
Where logs live native if not sent to a Log Analytics Workspace
Activity Logs
Activity Logs record control-plane operations in Azure, basically “who did what, when, and where” at the management layer. Think of them as an audit trail of operations on Azure resources.
Activity Logs are always collected at the subscription level and stored automatically by Azure in the Activity Log store.
They are retained there for 90 days and can be accessed in the Azure portal under Monitor → Activity Log, or through CLI, PowerShell, or REST. If you need longer retention or richer queries, you can export them to a workspace, an Event Hub, or a Storage account.
Resource diagnostic logs
Resource diagnostic logs, such as Key Vault audit logs, NSG flow logs, or Storage account logs, are not retained anywhere by default. They only persist if you configure a destination, which can be a Log Analytics workspace, a Storage account, or an Event Hub. Without that configuration, the logs effectively vanish after the service has emitted them.
Metrics
Metrics are numeric performance values, like CPU percentage or disk IOPS (Input/Output Operations Per Second), collected at short intervals.
Metrics are handled separately. They are stored in the Azure Monitor metrics database, which is optimized for time-series data and retains values for 93 days by default. Metrics only flow into a Log Analytics workspace if you explicitly configure export.
Service Health and Resource Health events
Finally, Service Health and Resource Health events are captured by Azure’s own health monitoring system. These can always be viewed in the portal, but they are not placed in Log Analytics unless you set up a diagnostic setting to route them there.
Azure Monitor
Azure Monitor is a comprehensive monitoring solution for collecting, analyzing, and responding to monitoring data from your cloud and on-premises environments.
You can use Azure Monitor to maximize the availability and performance of your applications and services. It helps you understand how your applications are performing and allows you to manually and programmatically respond to system events.
Azure Monitor collects and aggregates the data from every layer and component of your system across multiple Azure and non-Azure subscriptions and tenants.
It stores it in a common data platform for consumption by a common set of tools that can correlate, analyze, visualize, and/or respond to the data. You can also integrate other Microsoft and non-Microsoft tools.
Azure Monitor can monitor these types of resources in Azure, other clouds, or on-premises:
- Applications
- Virtual machines
- Guest operating systems
- Containers including Prometheus metrics
- Databases
- Security events in combination with Azure Sentinel
- Networking events and health in combination with Network Watcher
- Custom sources that use the APIs to get data into Azure Monitor
Azure Monitor stores data in data stores for each of the three pillars of observability, plus an additional one:
- metrics
- logs
- distributed traces
- changes
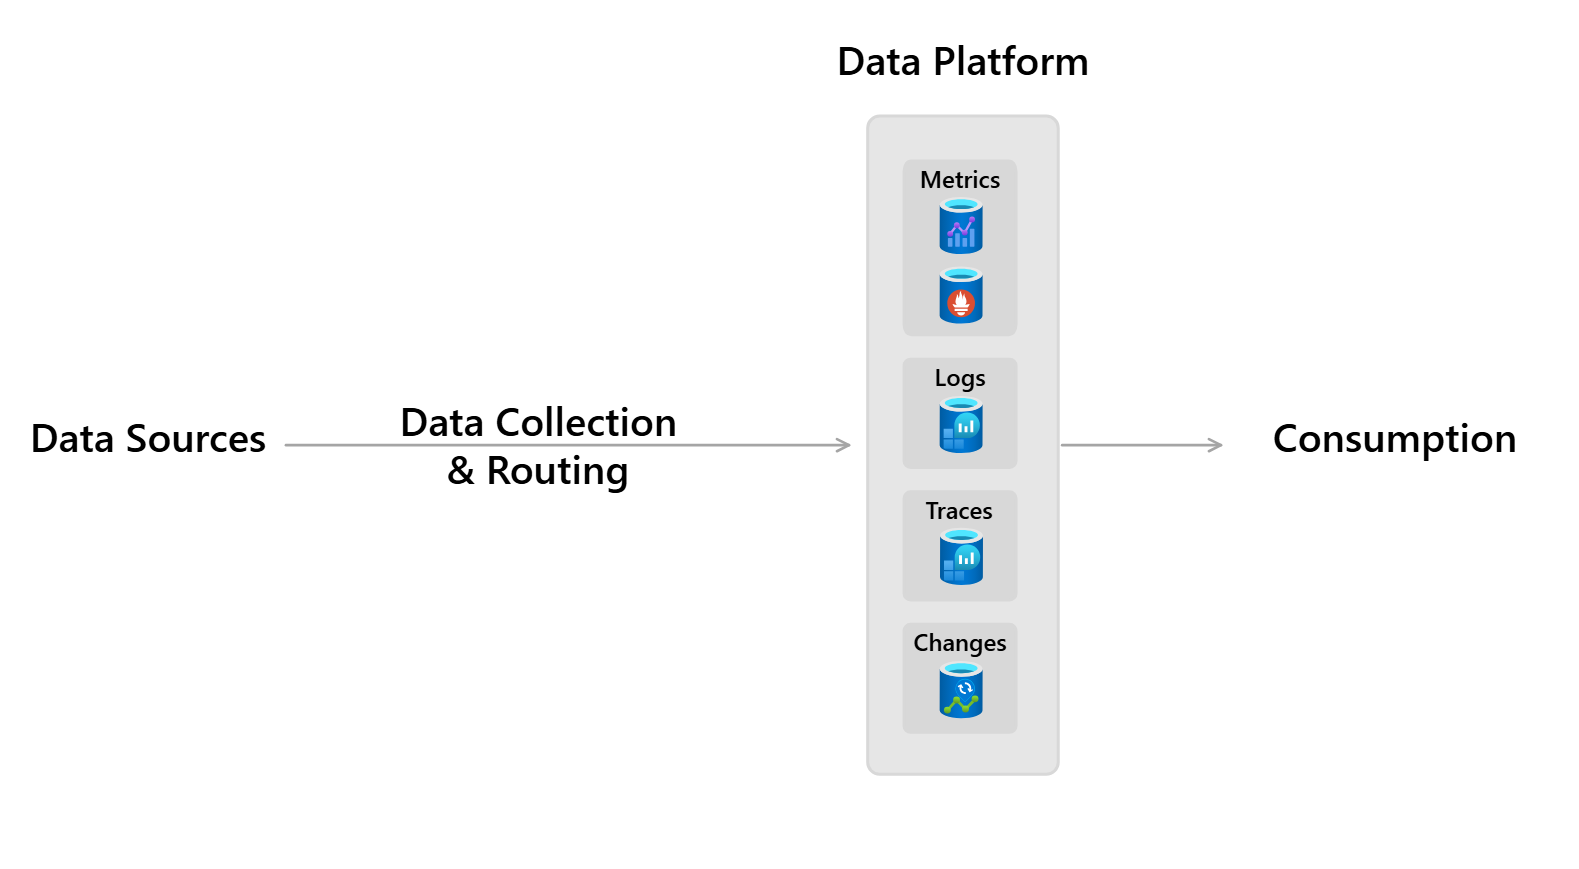
Source: https://learn.microsoft.com/en-us/azure/azure-monitor/fundamentals/overview#data-platform
Each store is optimized for specific types of data and monitoring scenarios.
Azure Monitoring Logs are recorded system events. Logs can contain different types of data, be structured or free-form text, and they contain a timestamp. Azure Monitor stores structured and unstructured log data of all types in Azure Monitor Logs.
You can route data to Log Analytics workspaces for querying and analysis.
More about these stores you will find here https://learn.microsoft.com/en-us/azure/azure-monitor/fundamentals/overview#data-platform.
Log Analytics workspace
A Log Analytics workspace is a data store into which you can collect any type of log data from all of your Azure and non-Azure resources and applications.
Workspace configuration options let you manage all of your log data in one workspace to meet the operations, analysis, and auditing needs of different personas in your organization through:
- Azure Monitor features, such as built-in insights experiences, alerts, and automatic actions
- Other Azure services, such as Microsoft Sentinel, Microsoft Defender for Cloud, and Logic Apps
- Microsoft tools, such as Power BI and Excel
- Integration with custom and third-party applications
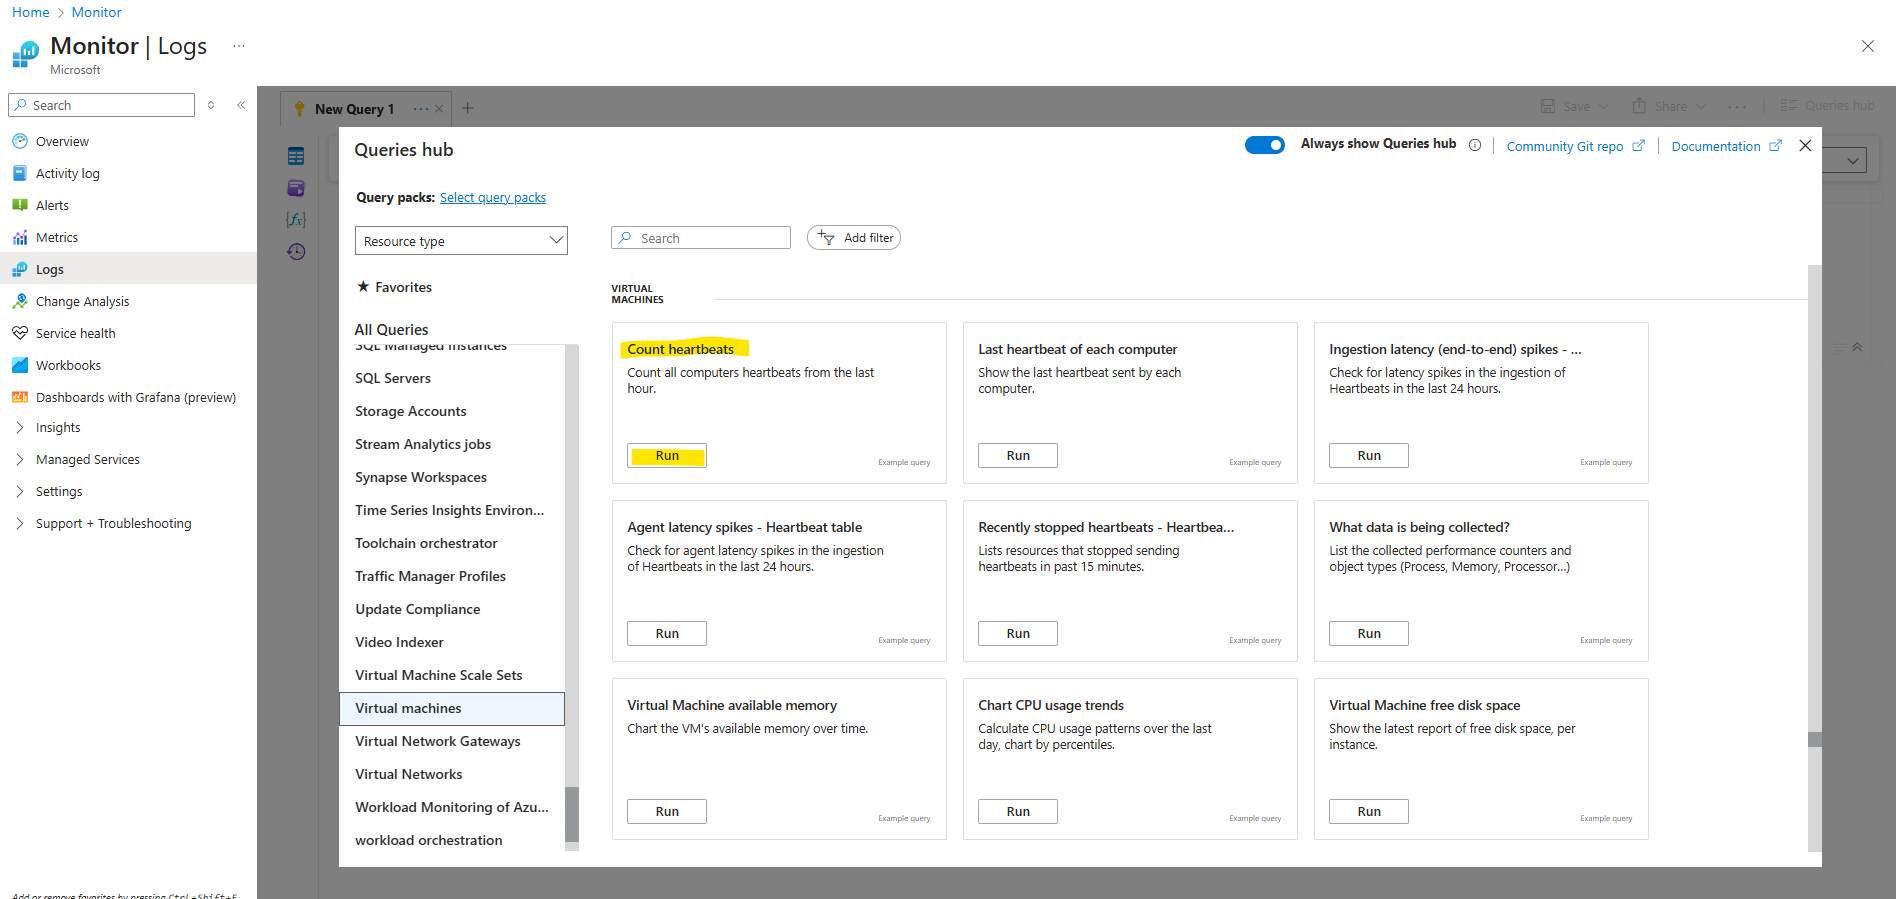
Log Analytics tools
Although Azure Monitor → Logs lets you scope to a subscription, tables like Heartbeat don’t live at subscription level, they only exist inside Log Analytics workspaces.
So if you want those queries to work, always scope to a workspace, because that’s where the data actually lives.”
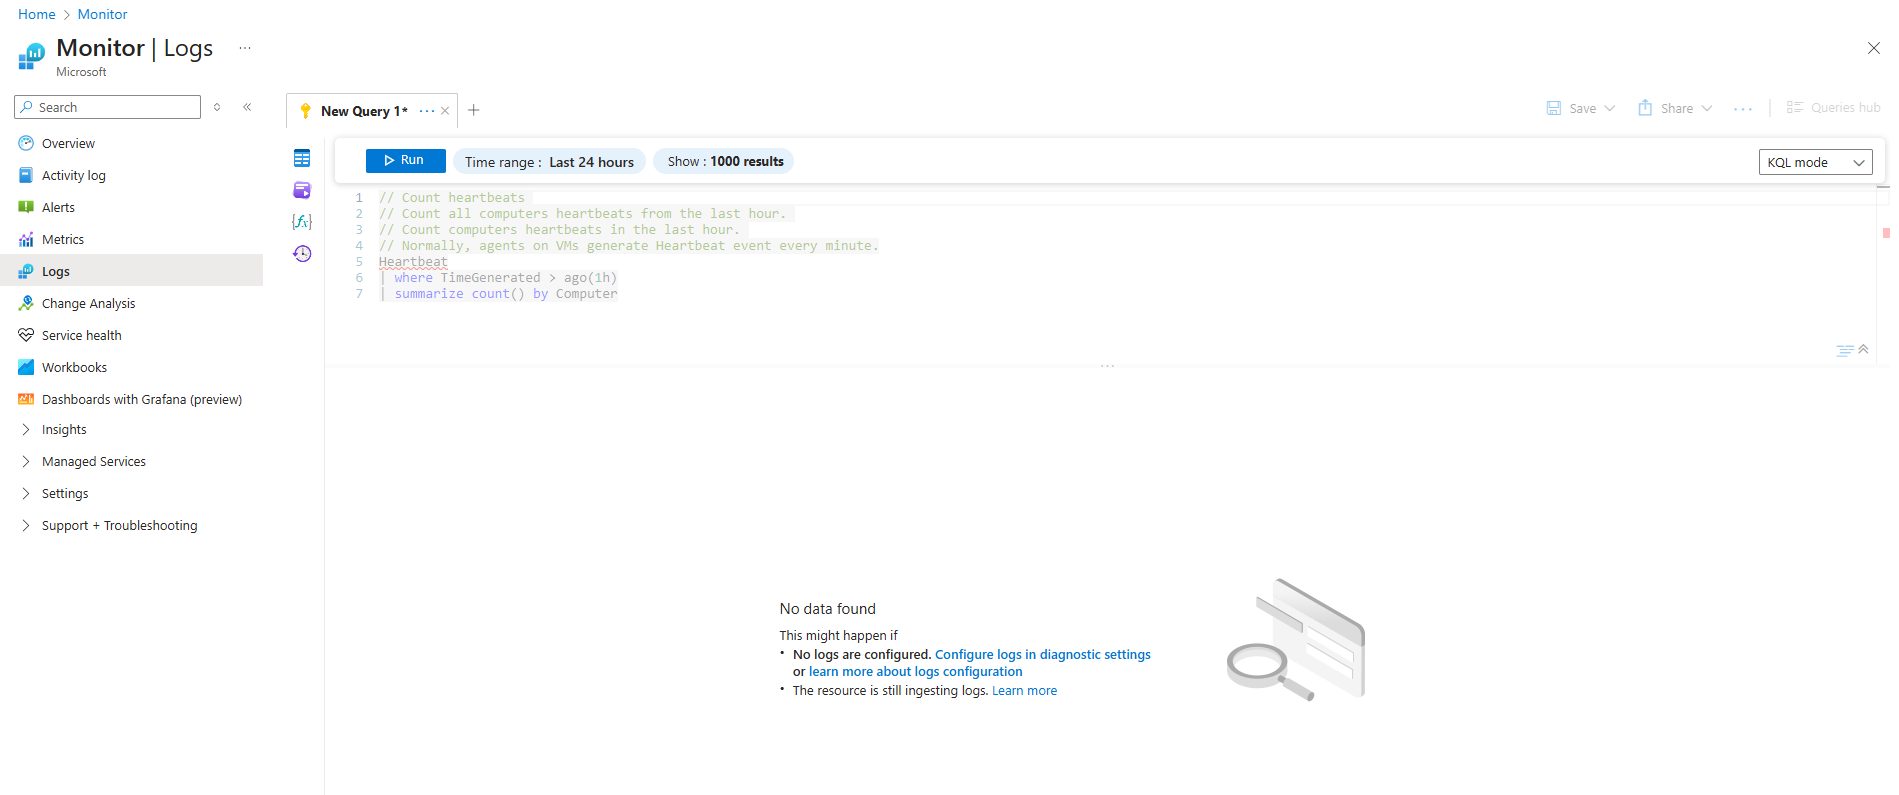
So because the virtual machines so far are not connected to a log analytics works space, the query won’t work.
For the scope my subscription with running virtual machines is selected but nevertheless no data found and also the Heartbeat table is underlined red as parse error.
Each Log Analytics workspace has many tables (like a database). Heartbeat is one of the default tables created when you connect a VM with the Azure Monitor Agent.
// Count heartbeats
// Count all computers heartbeats from the last hour.
// Count computers heartbeats in the last hour.
// Normally, agents on VMs generate Heartbeat event every minute.
Heartbeat
| where TimeGenerated > ago(1h)
| summarize count() by Computer
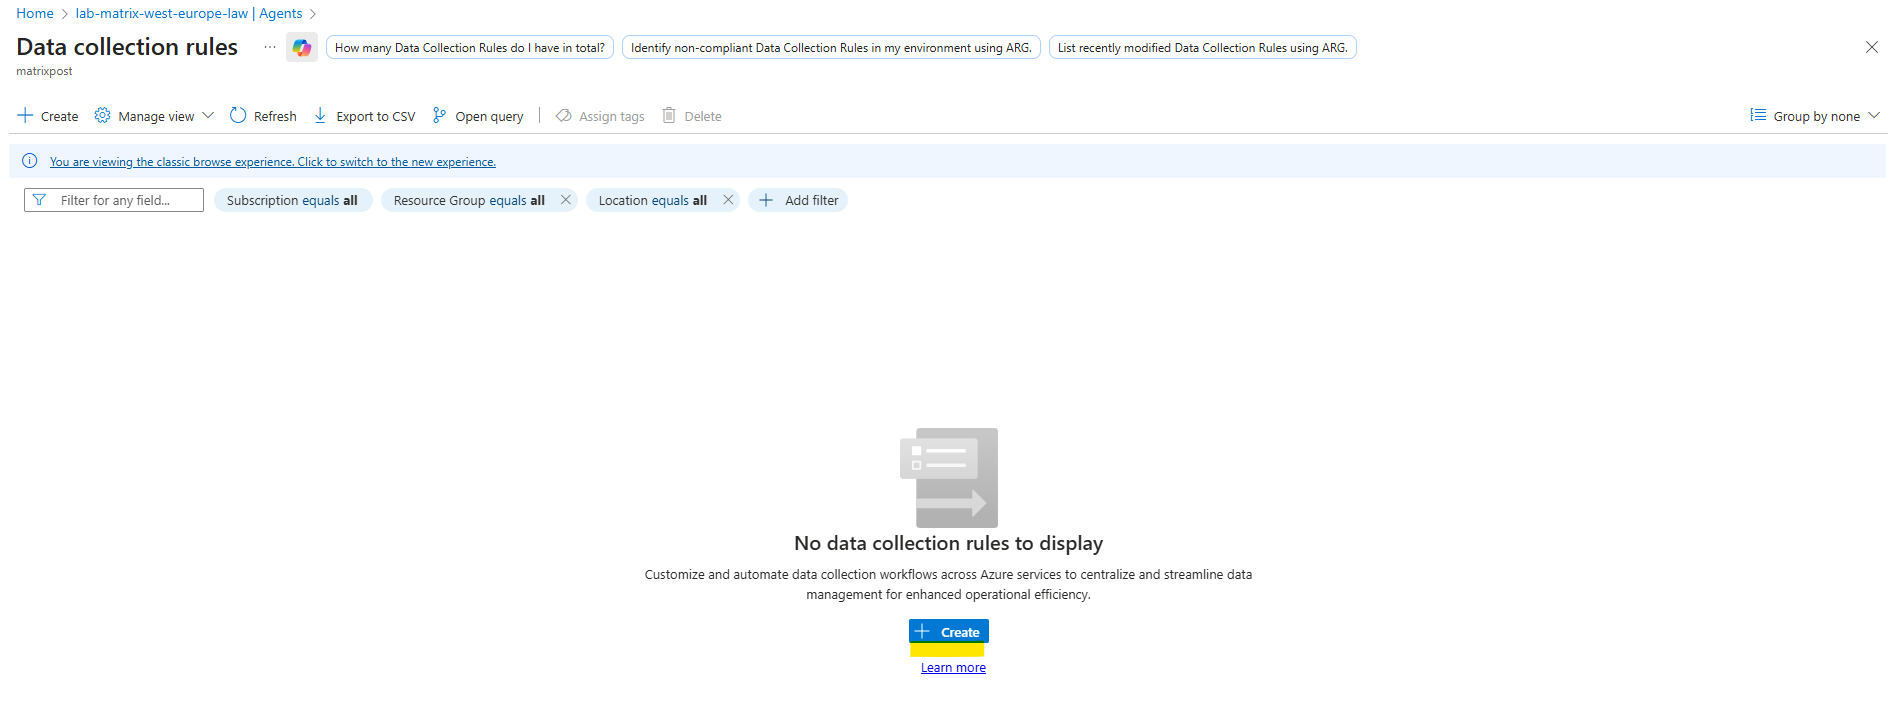
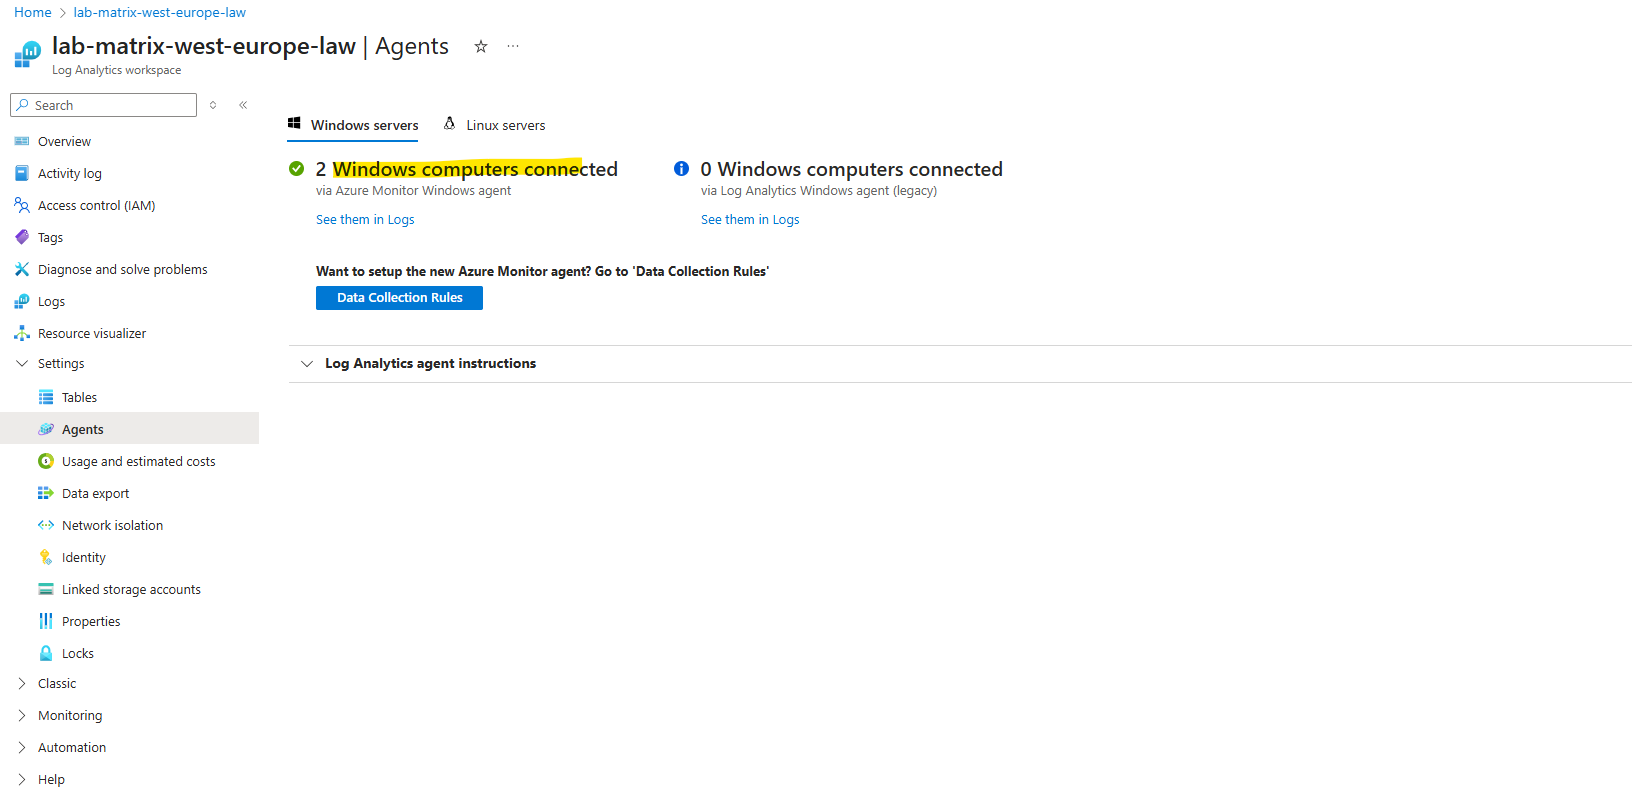
So to makes these queries work, we first need to connect our virtual machines to a log analytics workspace.
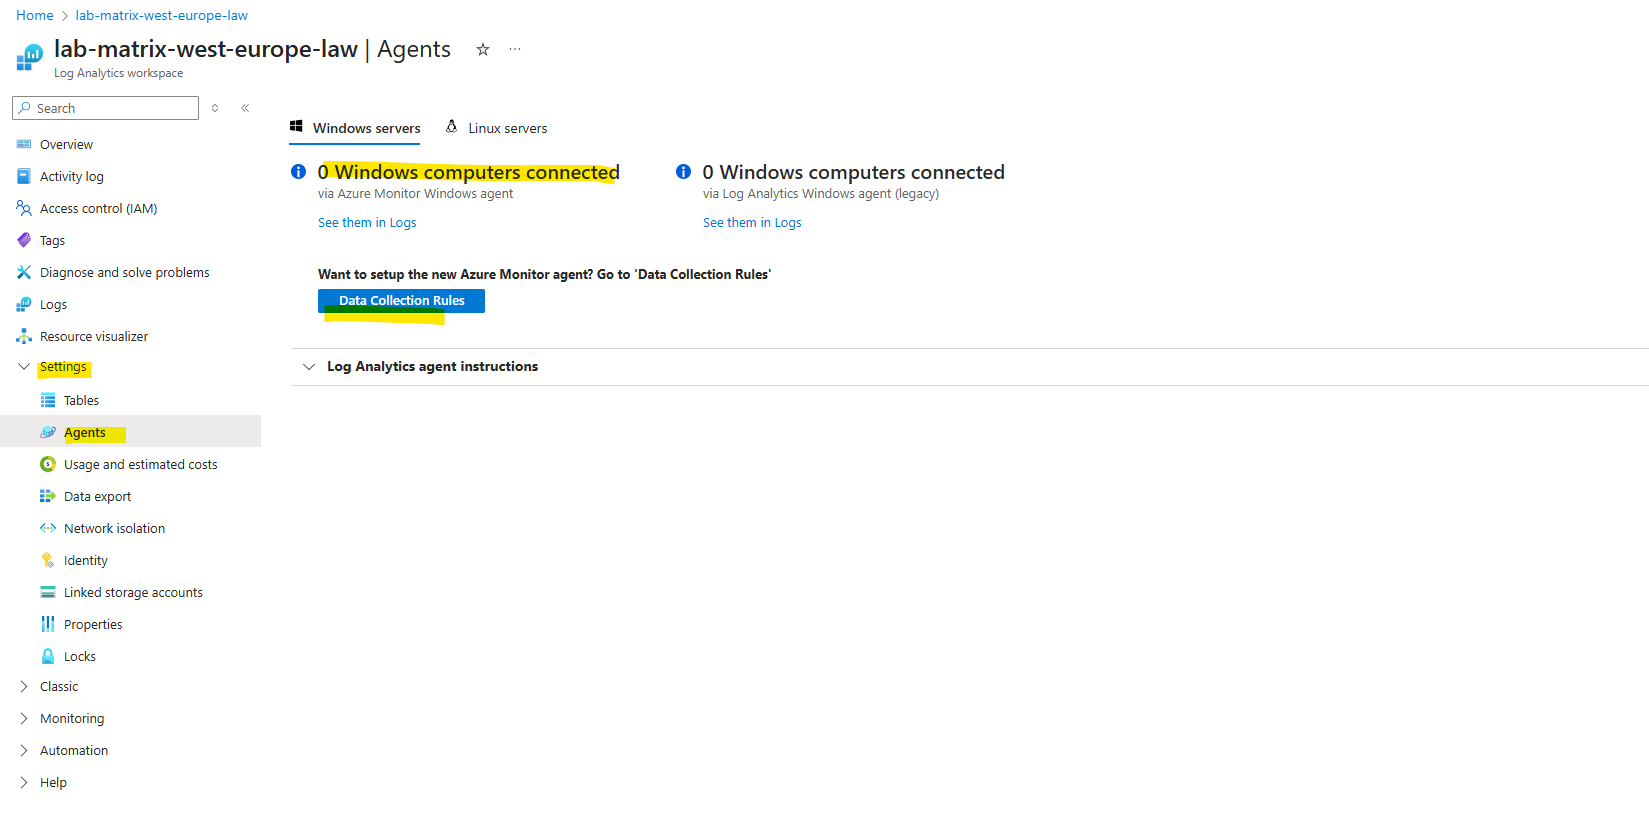
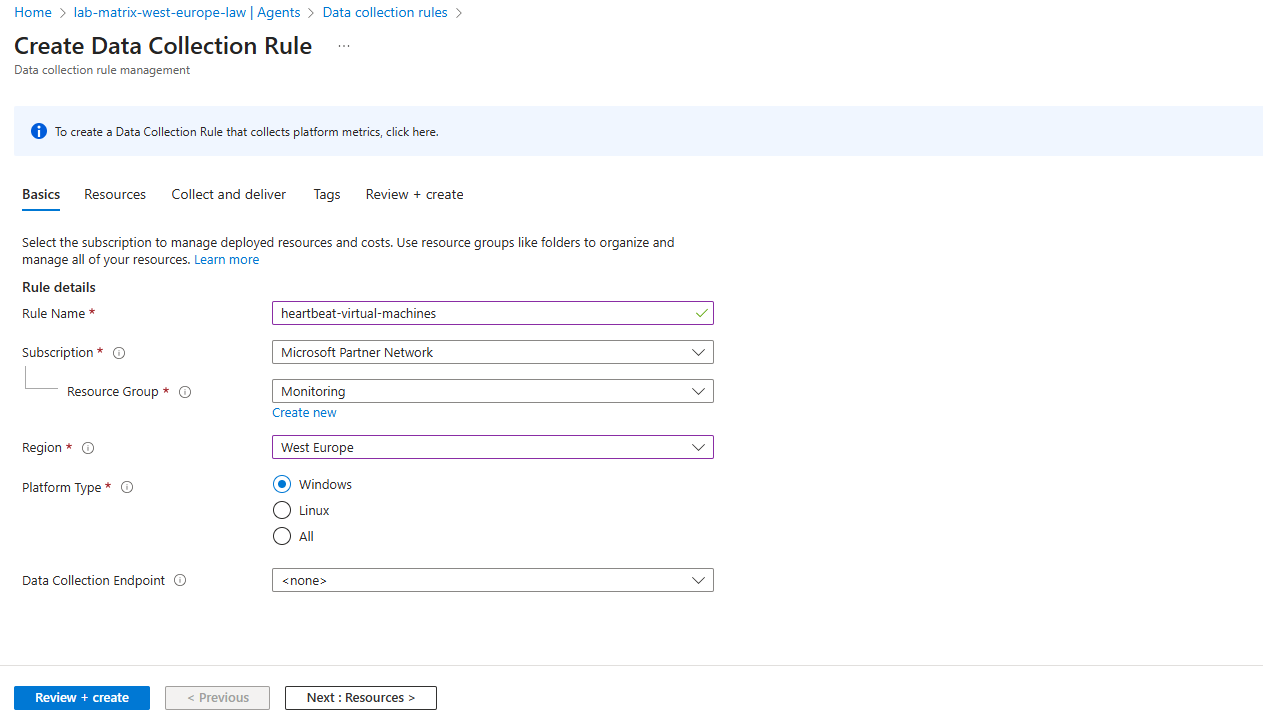
Click on + Create to create a new data collection rule.
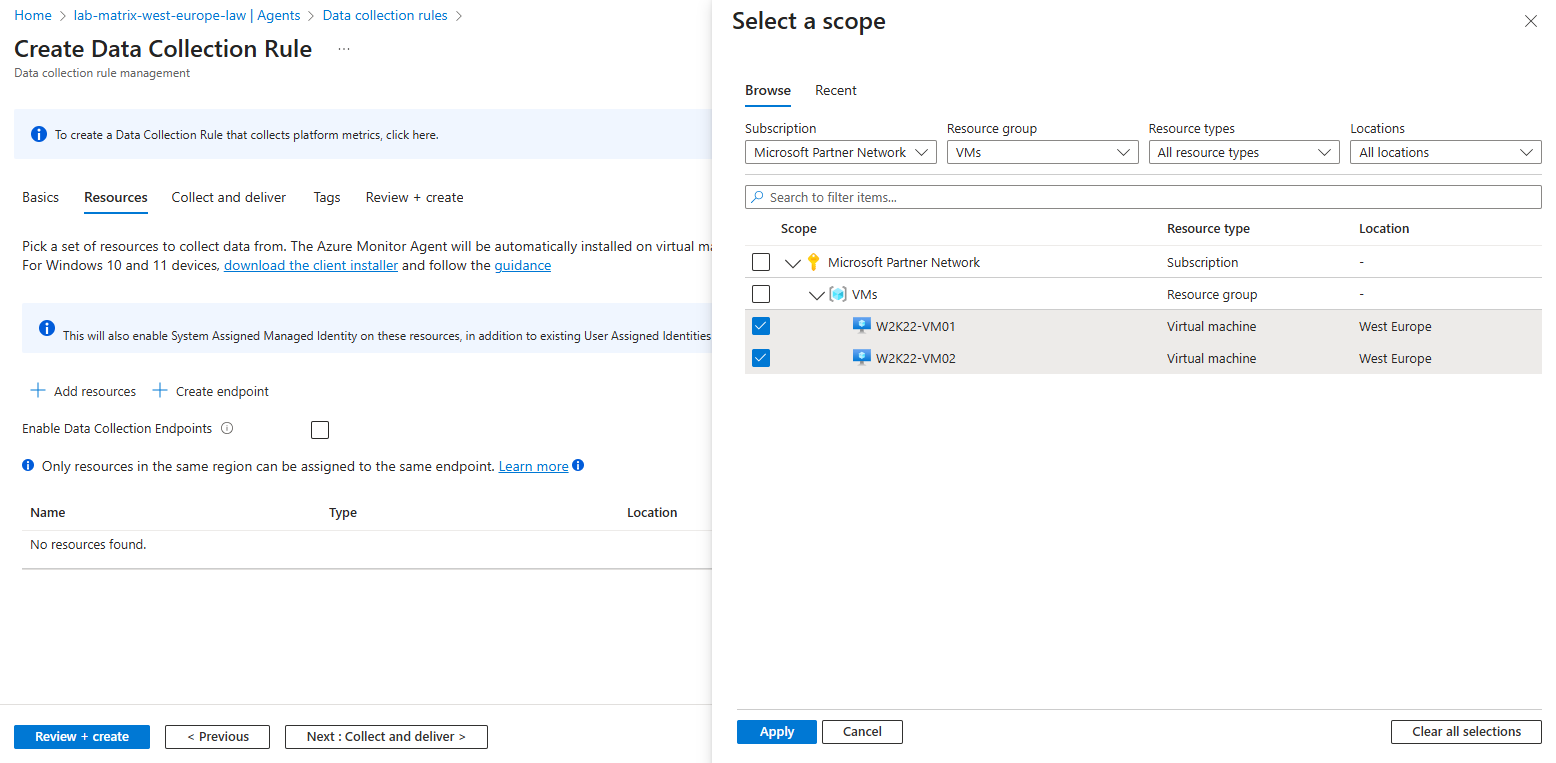
Select the scope which should send its data to our new workspace. I will select both virtual machines they should send its data.
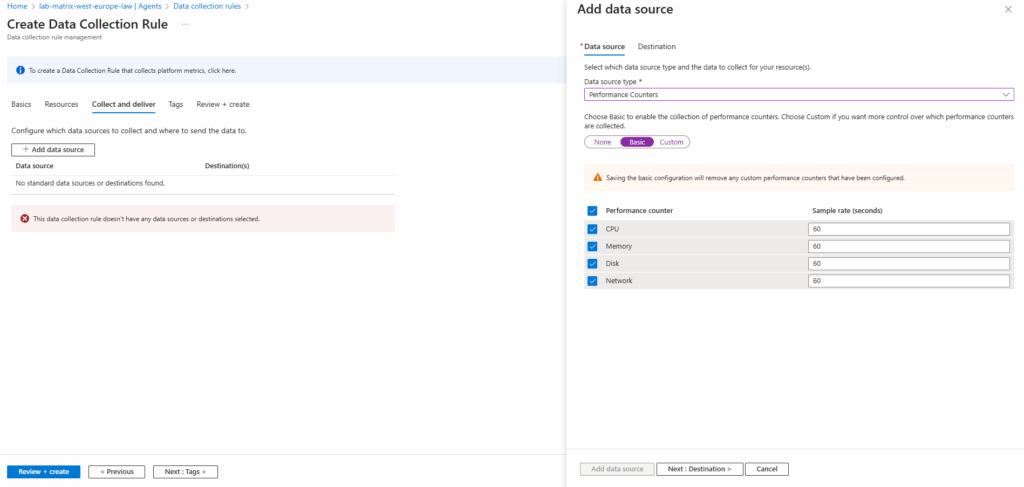
To finally gather logs for virtual machines heartbeats we need to add performance counters as data source. To add them click on Add data source.
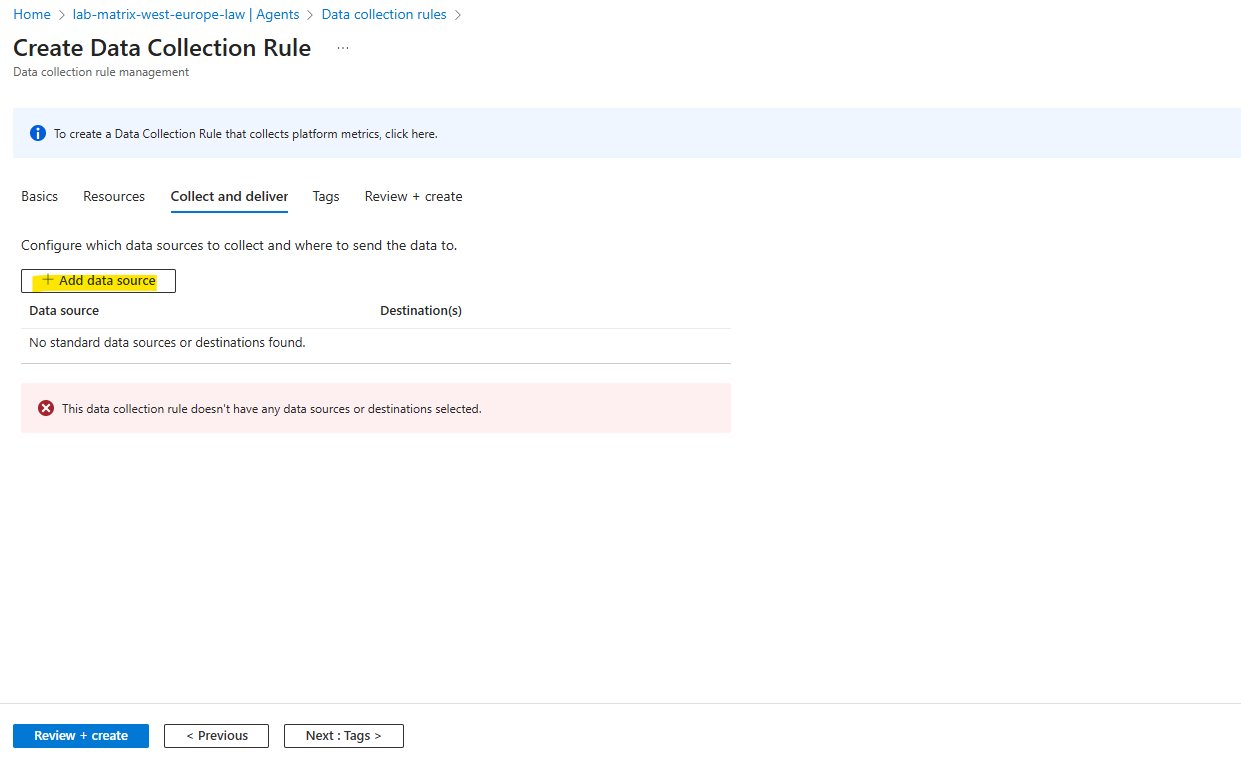
Select for the data source type Performance Counters and select which you want to include.
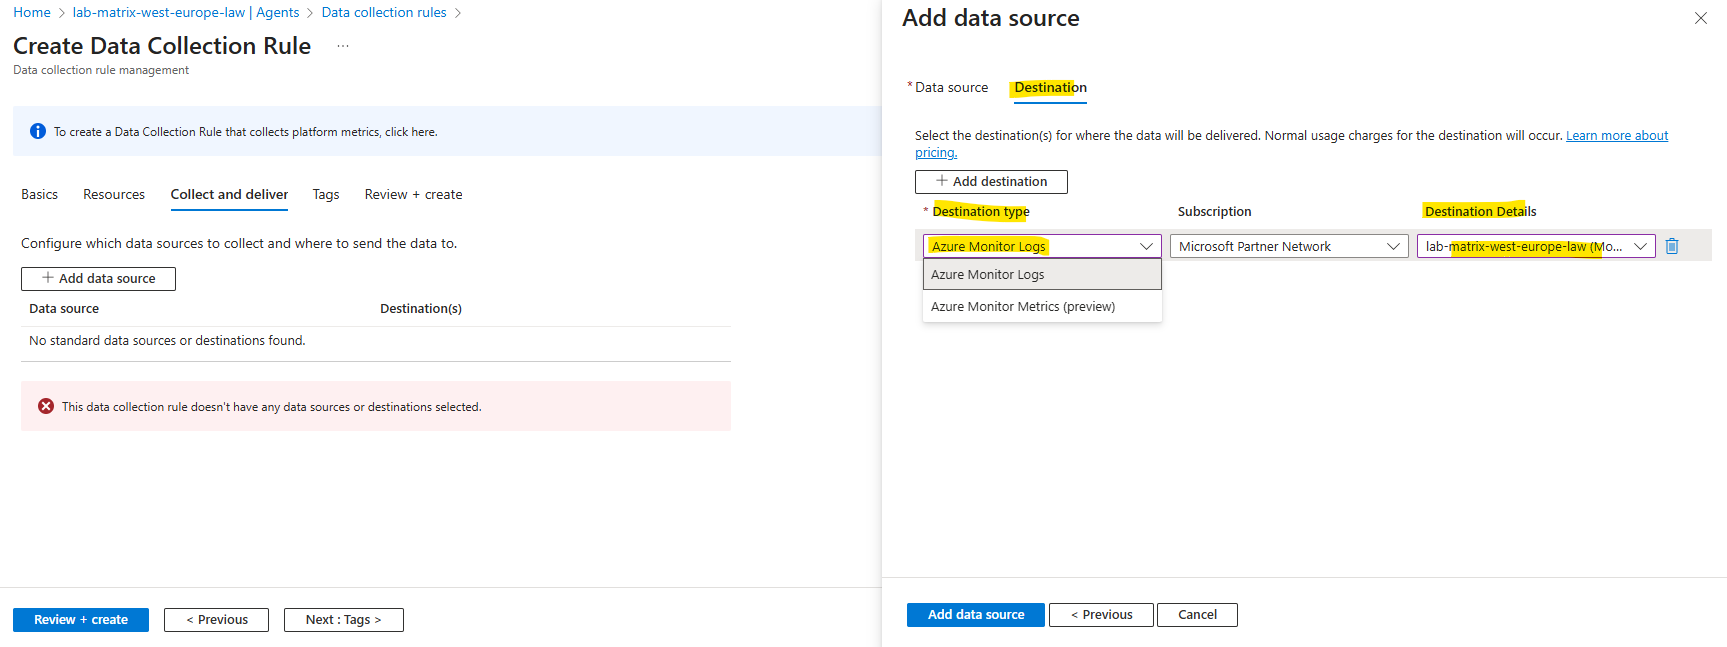
For the destination details we need to select our log analytics workspace.
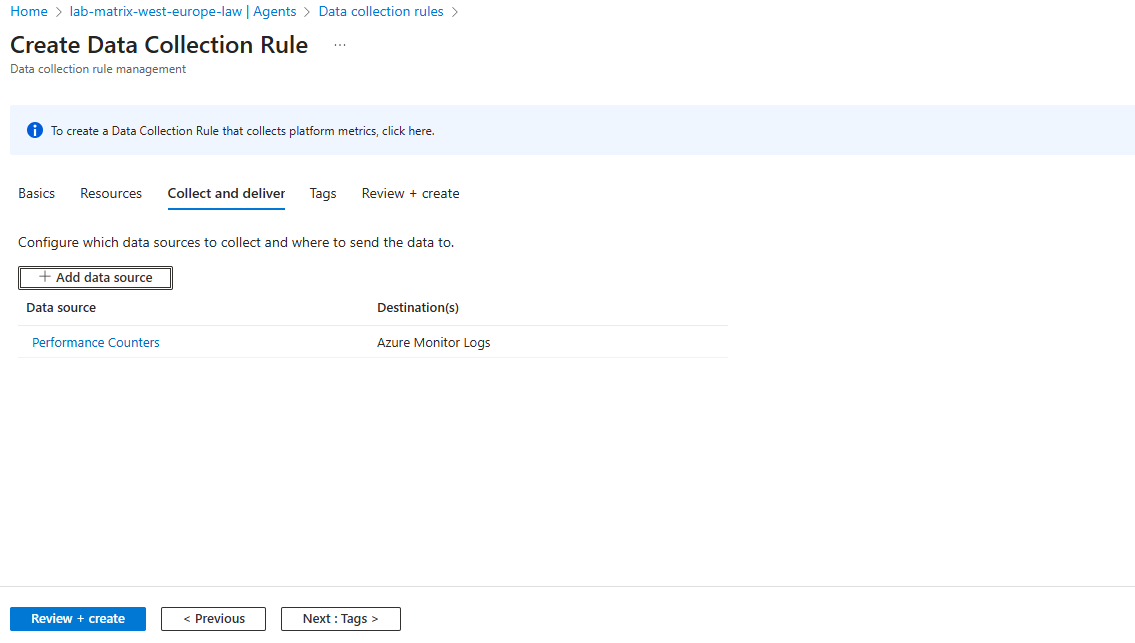
Back on the create data collection rule blade click on Next.
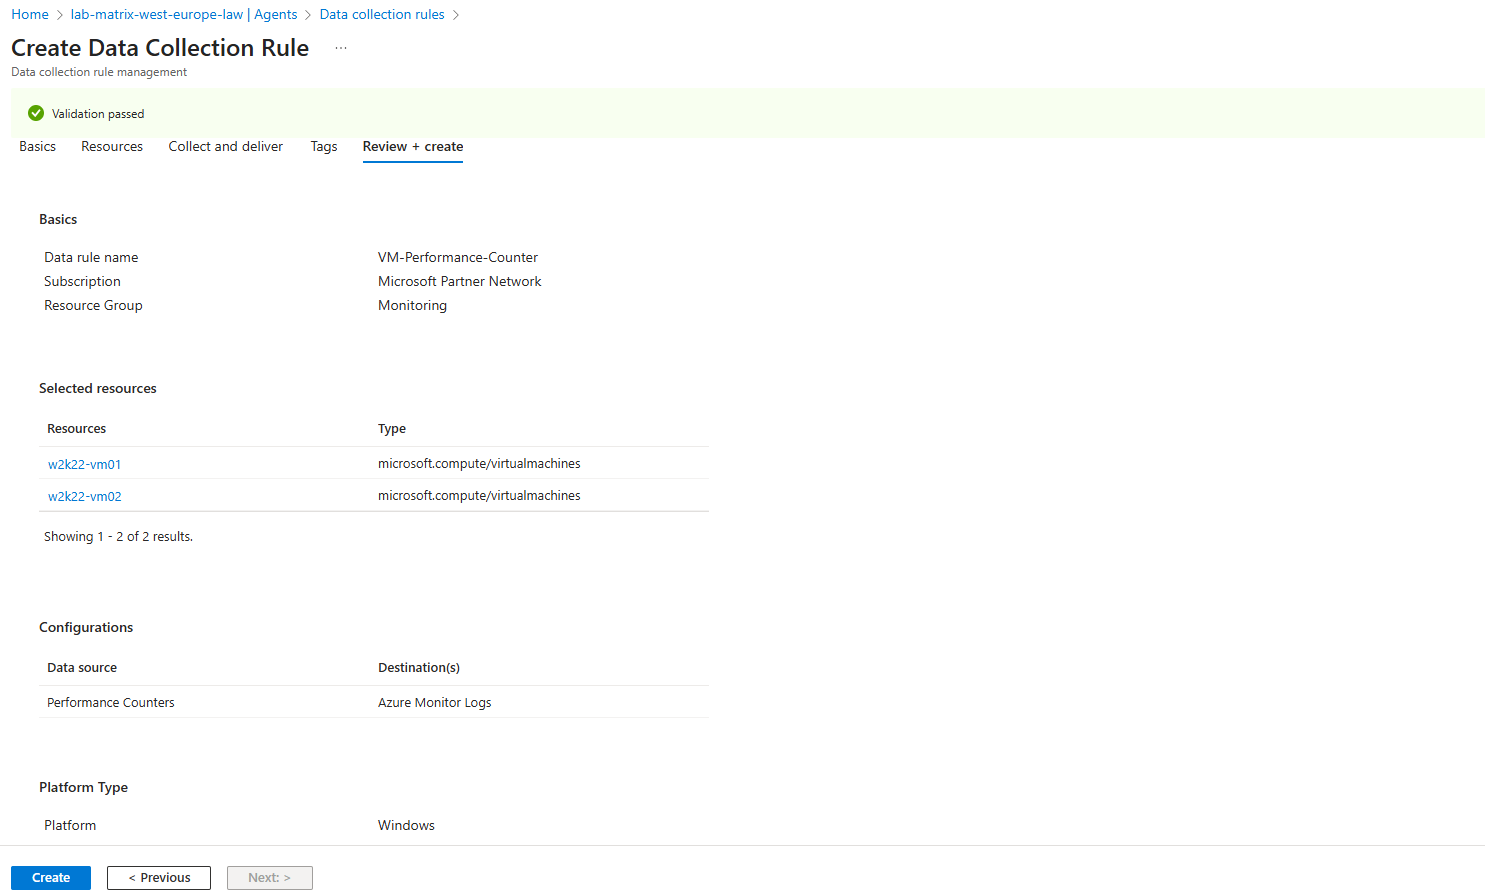
Finally we can click on Create.
It can take up to 10 minutes till our virtual machines are finally connected with the log analytics workspace.
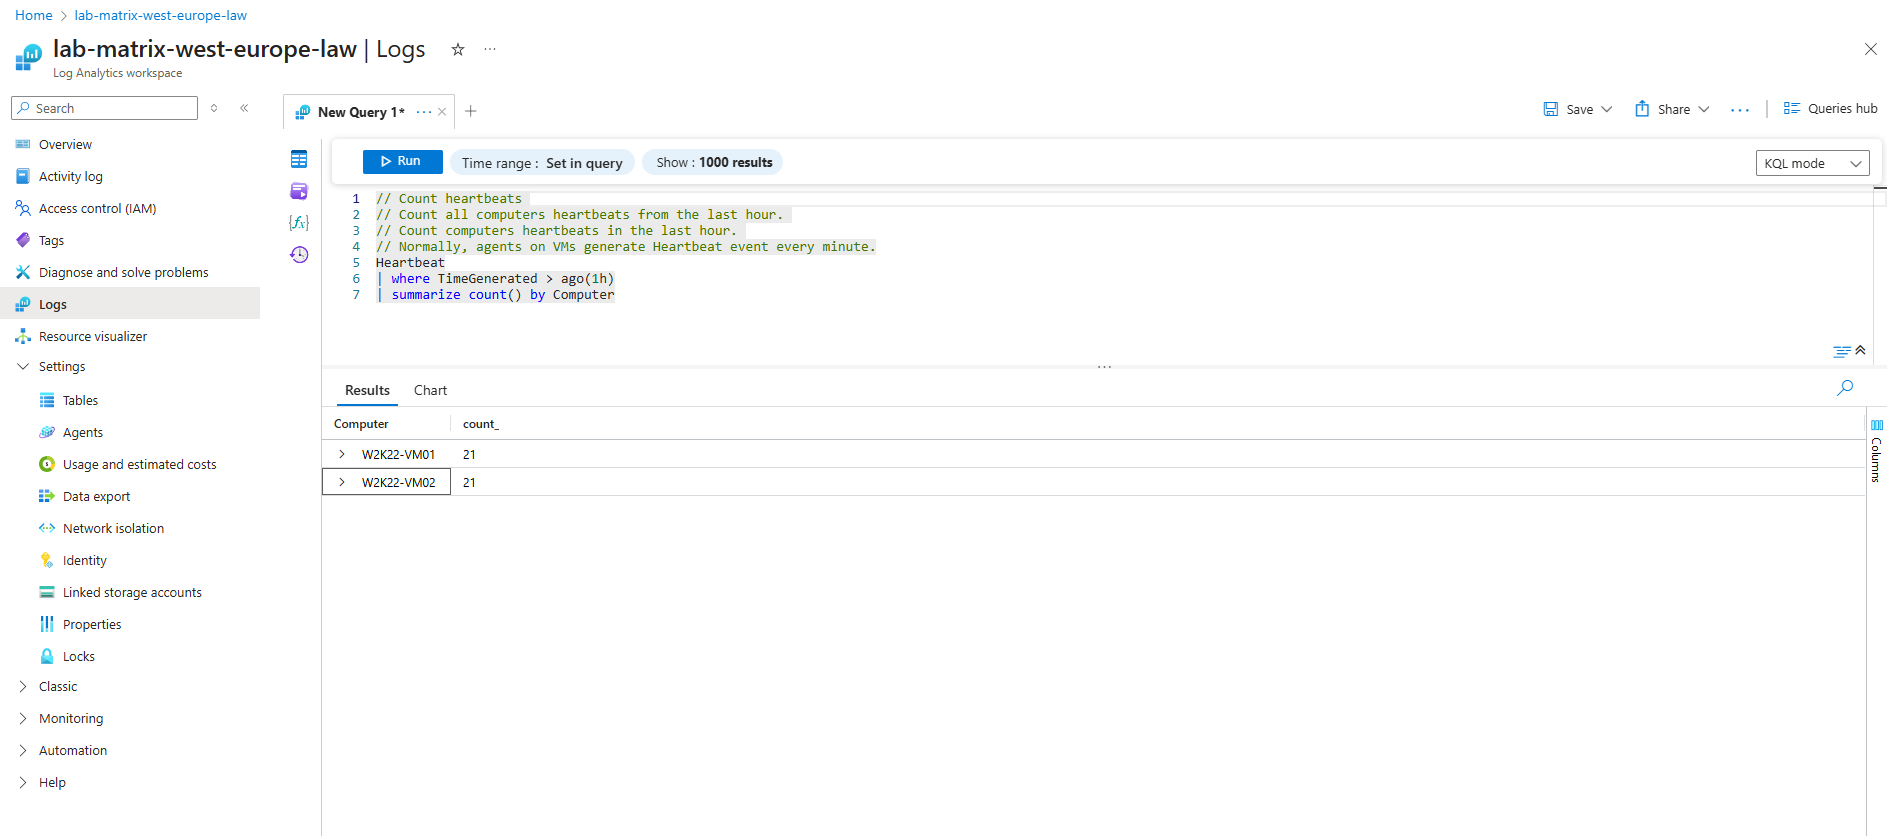
From now on the query is working and will return the count of the heartbeats. Below by using the Logs utility running form inside the log analytics workspace.
// Count heartbeats
// Count all computers heartbeats from the last hour.
// Count computers heartbeats in the last hour.
// Normally, agents on VMs generate Heartbeat event every minute.
Heartbeat
| where TimeGenerated > ago(1h)
| summarize count() by Computer
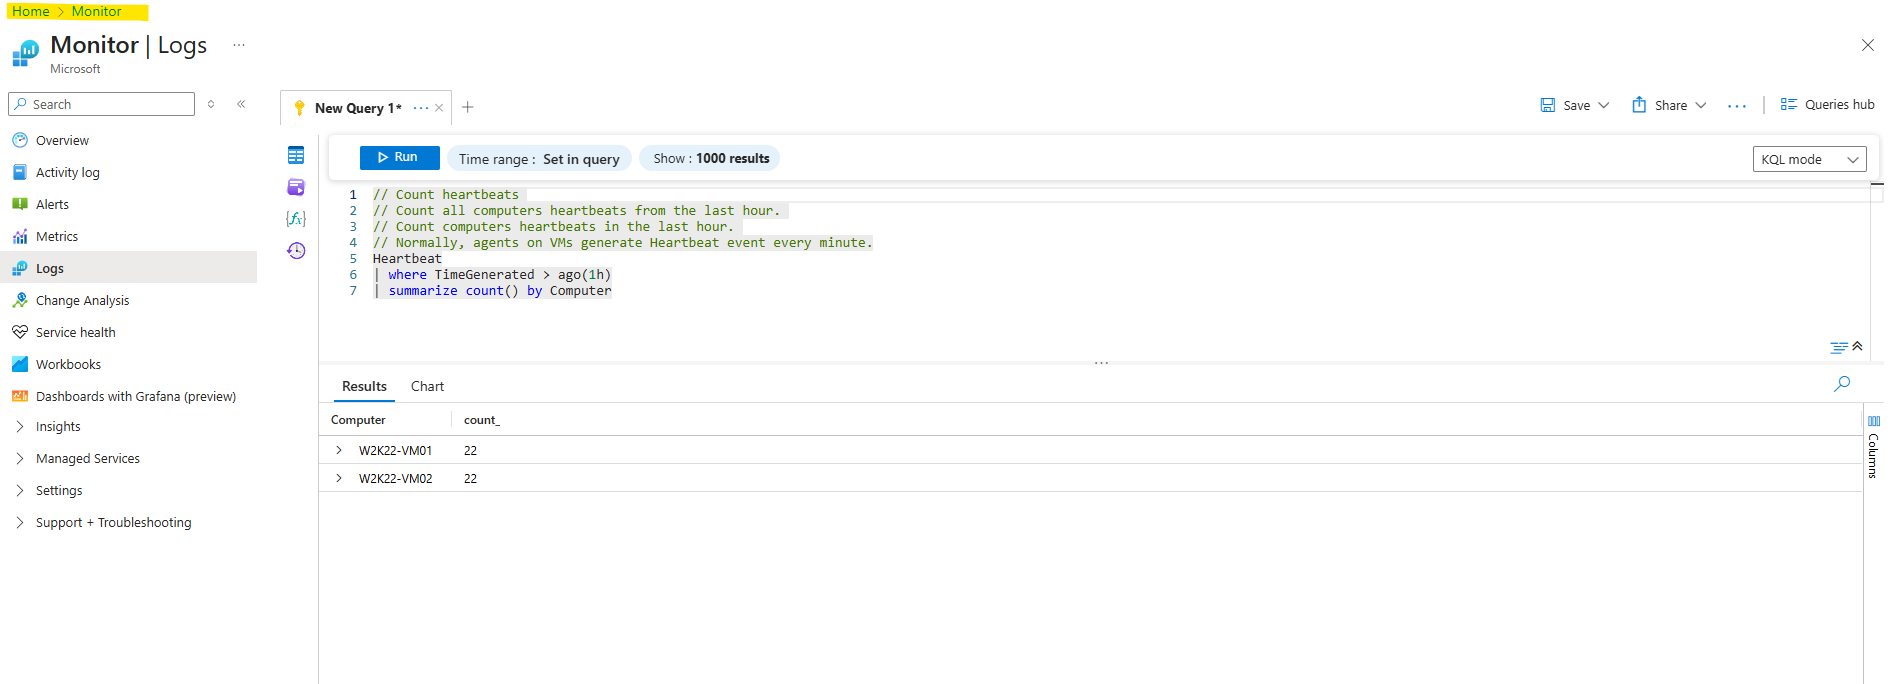
Or by running the Logs utility from Azure Monitor.
The Logs Analytics tool finally is always the same, but the set of data evaluated by the query depends on the scope that you selected.
When you start the Logs Analytics tool directly from your log analytics workspace as shown above, the scope is set by default to this workspace where the collected data lives.
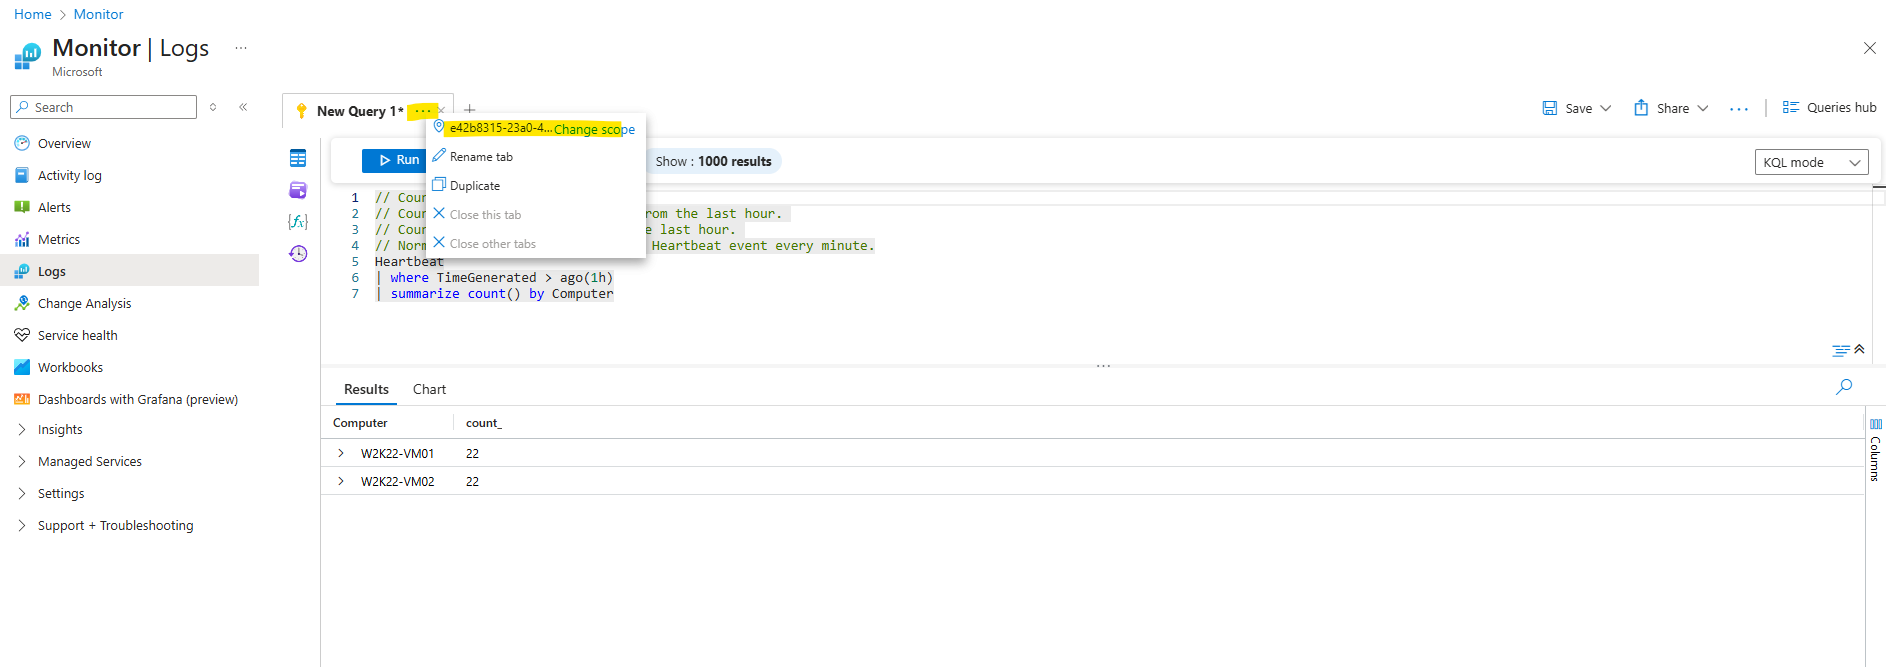
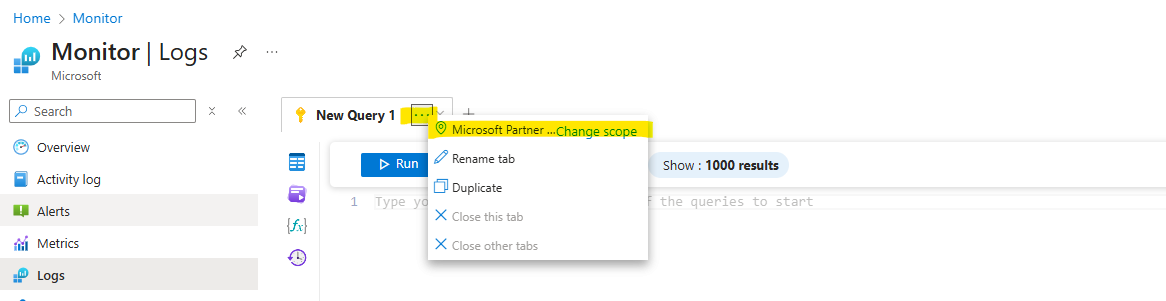
When you start the tool from Azure Monitor like below, you need to make sure to also select for the scope your log analytics workspace where the collected data lives.
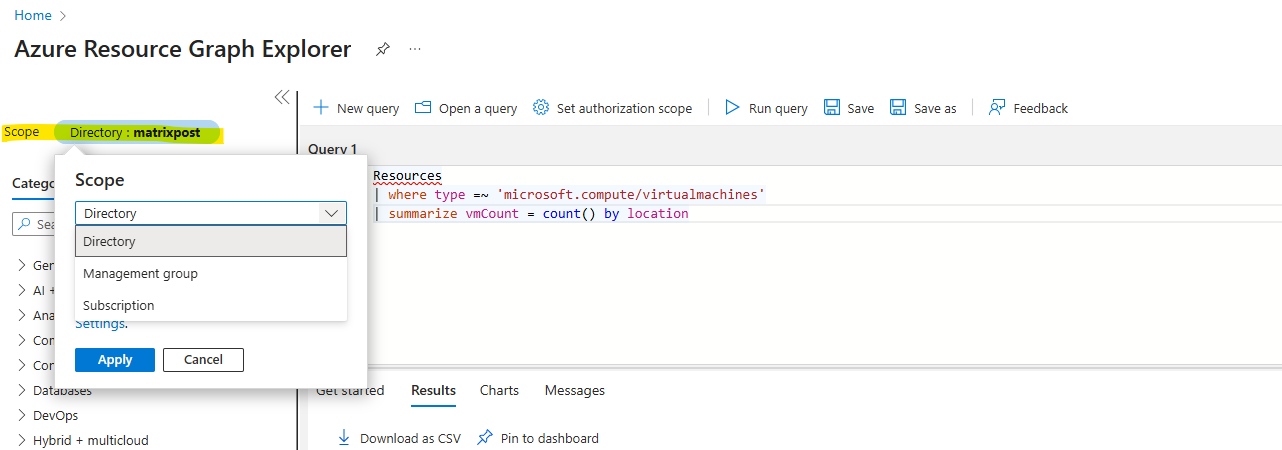
To change the scope, just click on the three dots.
Query the Azure Resource Graph directly from Azure Monitor
Since around September 2023 Azure offers public preview support (as of today still in preview) for also querying ARG from Log Analytics by using the arg(“”) call operator.
Given that we can now combine Azure Resource Graph tables and Log Analytics data to set up alerts they will be raised for metrics or logs coming from both sources.
A Quickstart sample is shown in the following article by Microsoft https://learn.microsoft.com/en-us/azure/governance/resource-graph/alerts-query-quickstart?tabs=azure-resource-graph.
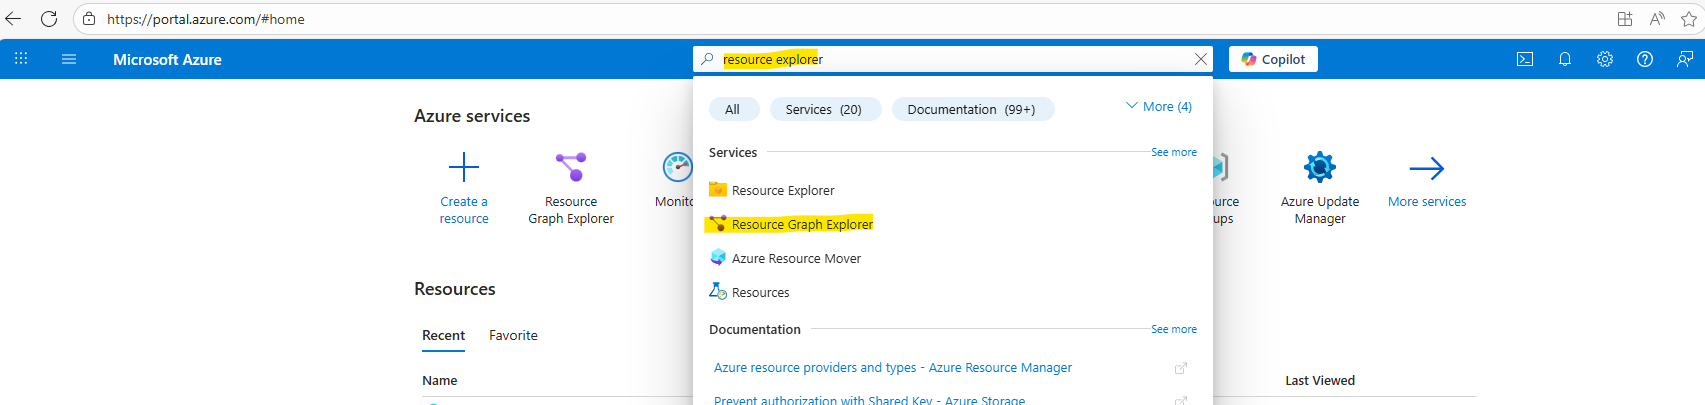
Below for example I will first natively query the Azure Resource Graph for the count of all virtual machines in my tenant by using the Azure Resource Graph Explorer.
Azure Resource Graph supports the following resource types listed in the article below of Azure Resource Manager. Each resource type is part of a table in Resource Graph.
Azure Resource Graph table and resource type reference
https://learn.microsoft.com/en-us/azure/governance/resource-graph/reference/supported-tables-resources
To get the count for all virtual machines running in our tenant, we can use the following query and ARG resources table.
Resources
| where type =~ 'microsoft.compute/virtualmachines'
| summarize vmCount = count() by location
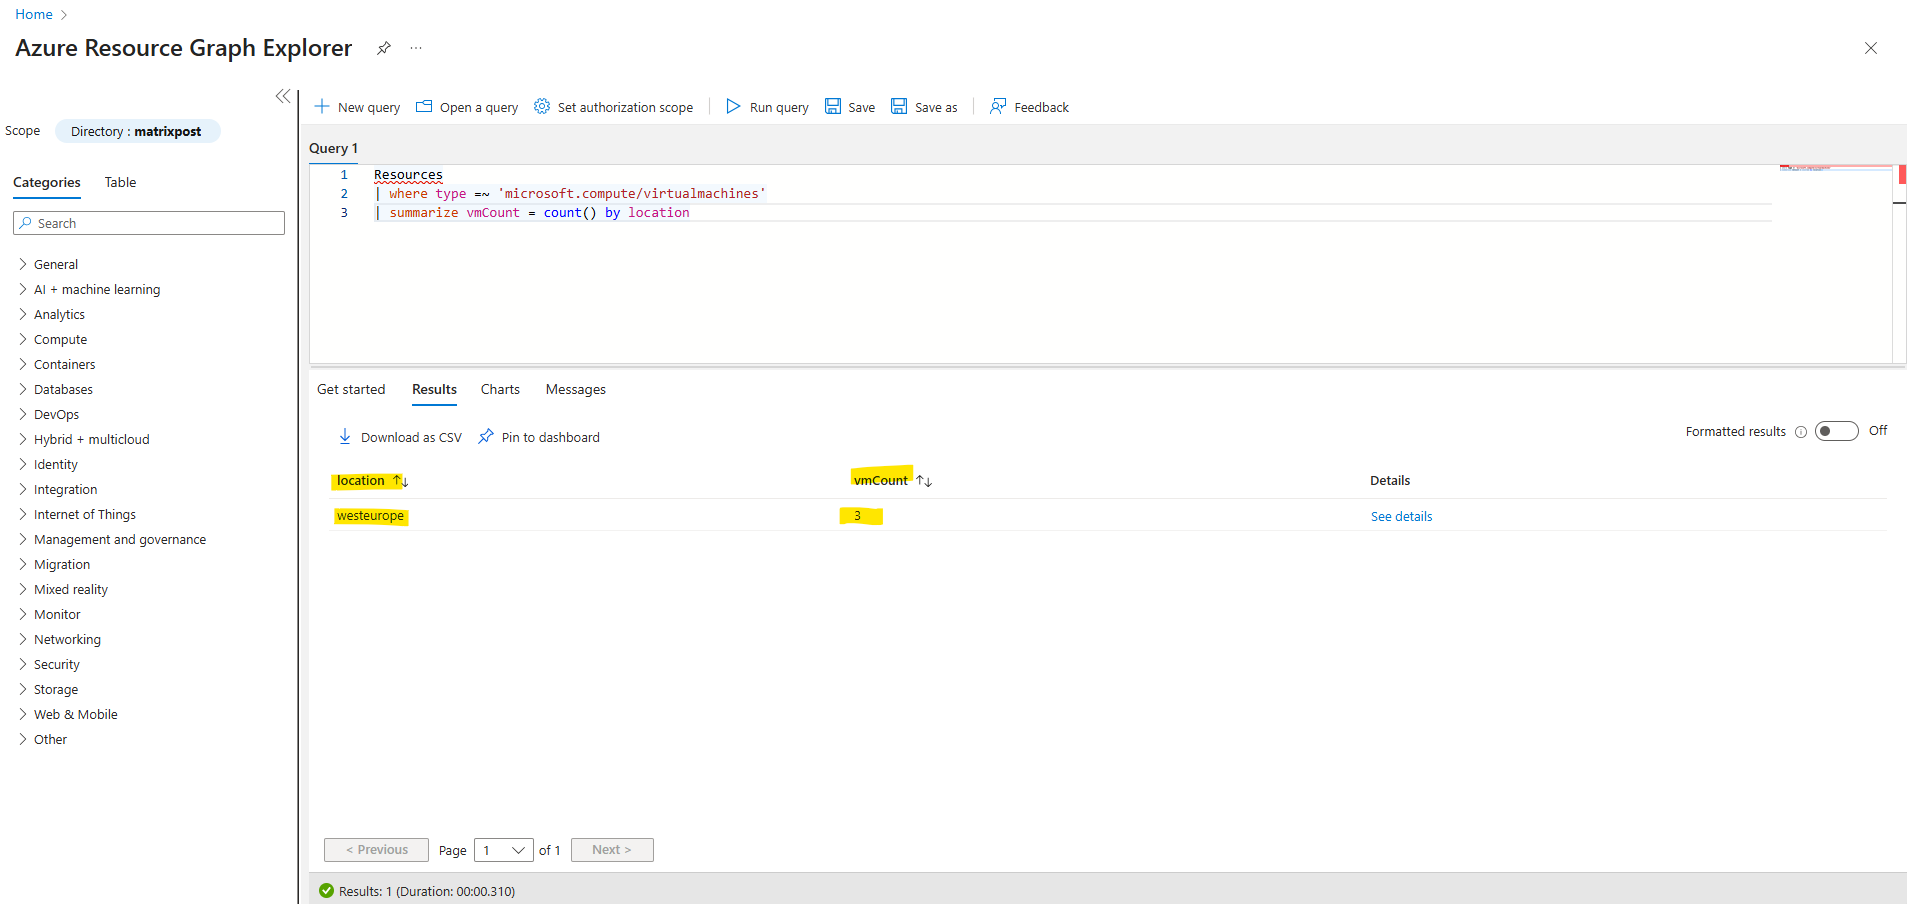
For the scope the whole tenant (Entra ID directory) is selected by default.
The same we can now also query directly from Log Analytics (Azure Monitor) by using the arg(“”) call operator as mentioned in front of the resources table of Azure Resource Graph.
Regarding the red underlines shown up in the editor, In ARG, the Resources table has a type column (full resource type, like microsoft.compute/virtualmachines).
When you run the same query via Logs (arg(“”).Resources), the editor doesn’t know about the schema of Resources from ARG.
At execution time, the query still gets sent to ARG, which does know what
typeis → that’s why it still works and returns results.
arg("").Resources
| where type =~ 'microsoft.compute/virtualmachines'
| summarize vmCount = count() by location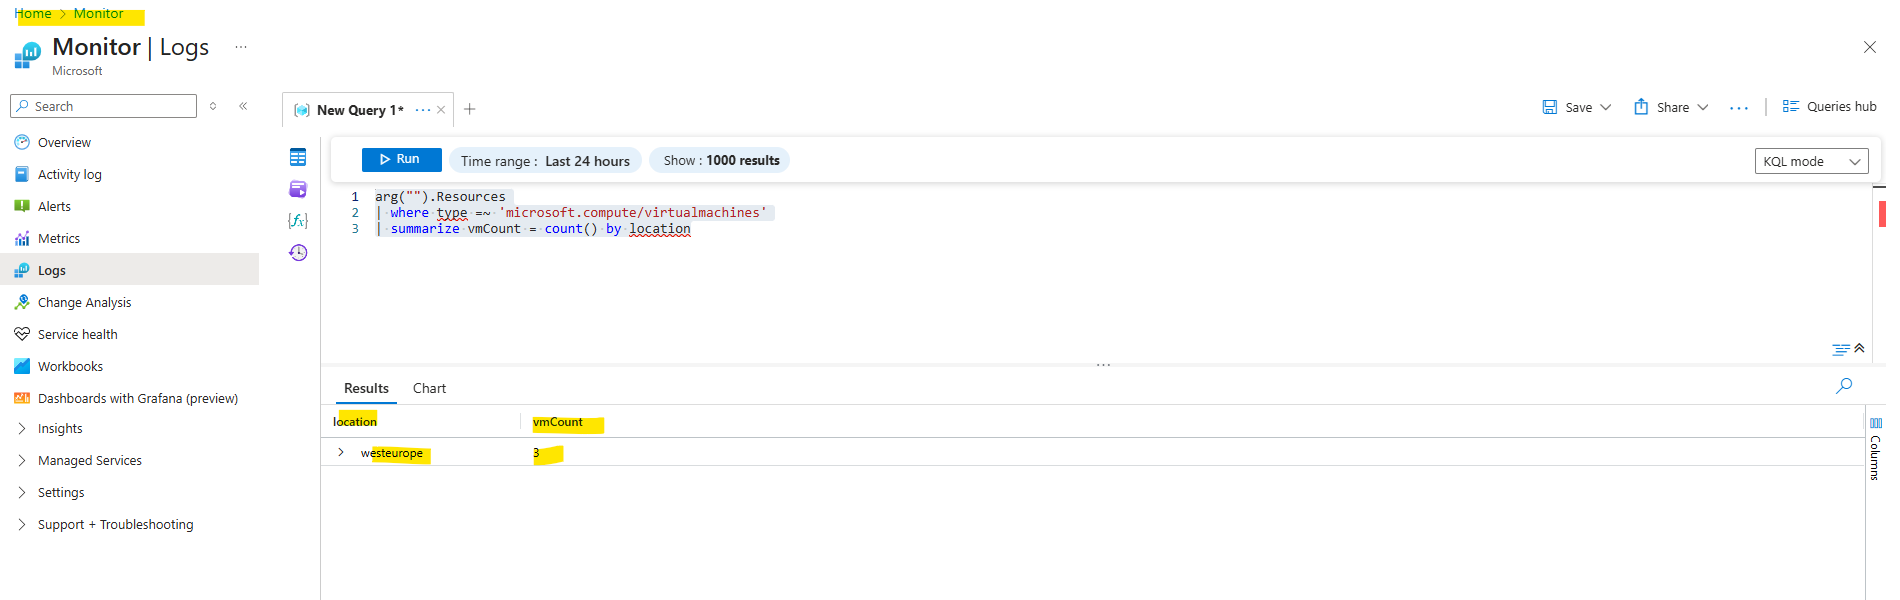
The arg(”) operator in Azure Monitor Logs lets us query Azure Resource Graph (ARG) tables directly from the Log Analytics query editor as already mentioned.
However, we still need a Log Analytics workspace to use the Azure Monitor Logs query editor, even if our main goal is to just query ARG tables.
The workspace acts as the context for the query editor, even if the data source is just ARG.
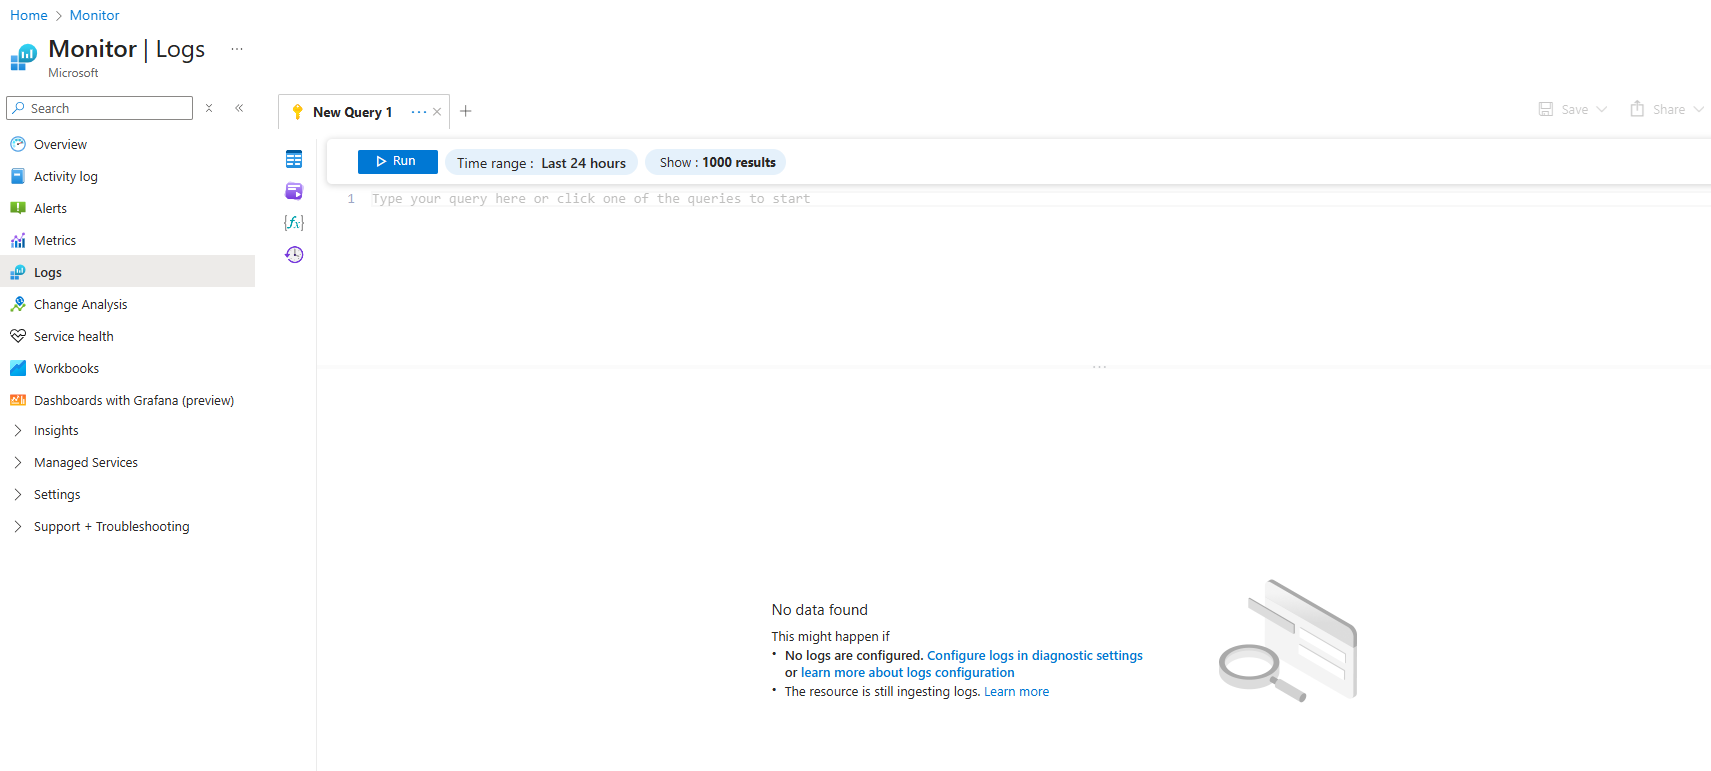
In case we doesn’t have a log analytics workspace selected for the scope, the editor below doesn’t accept any input and is greyed out.
Below we can see the editor is greyed out and will not accept any input.
Below I will now change the scope for the Logs tool to my log analytics workspace.
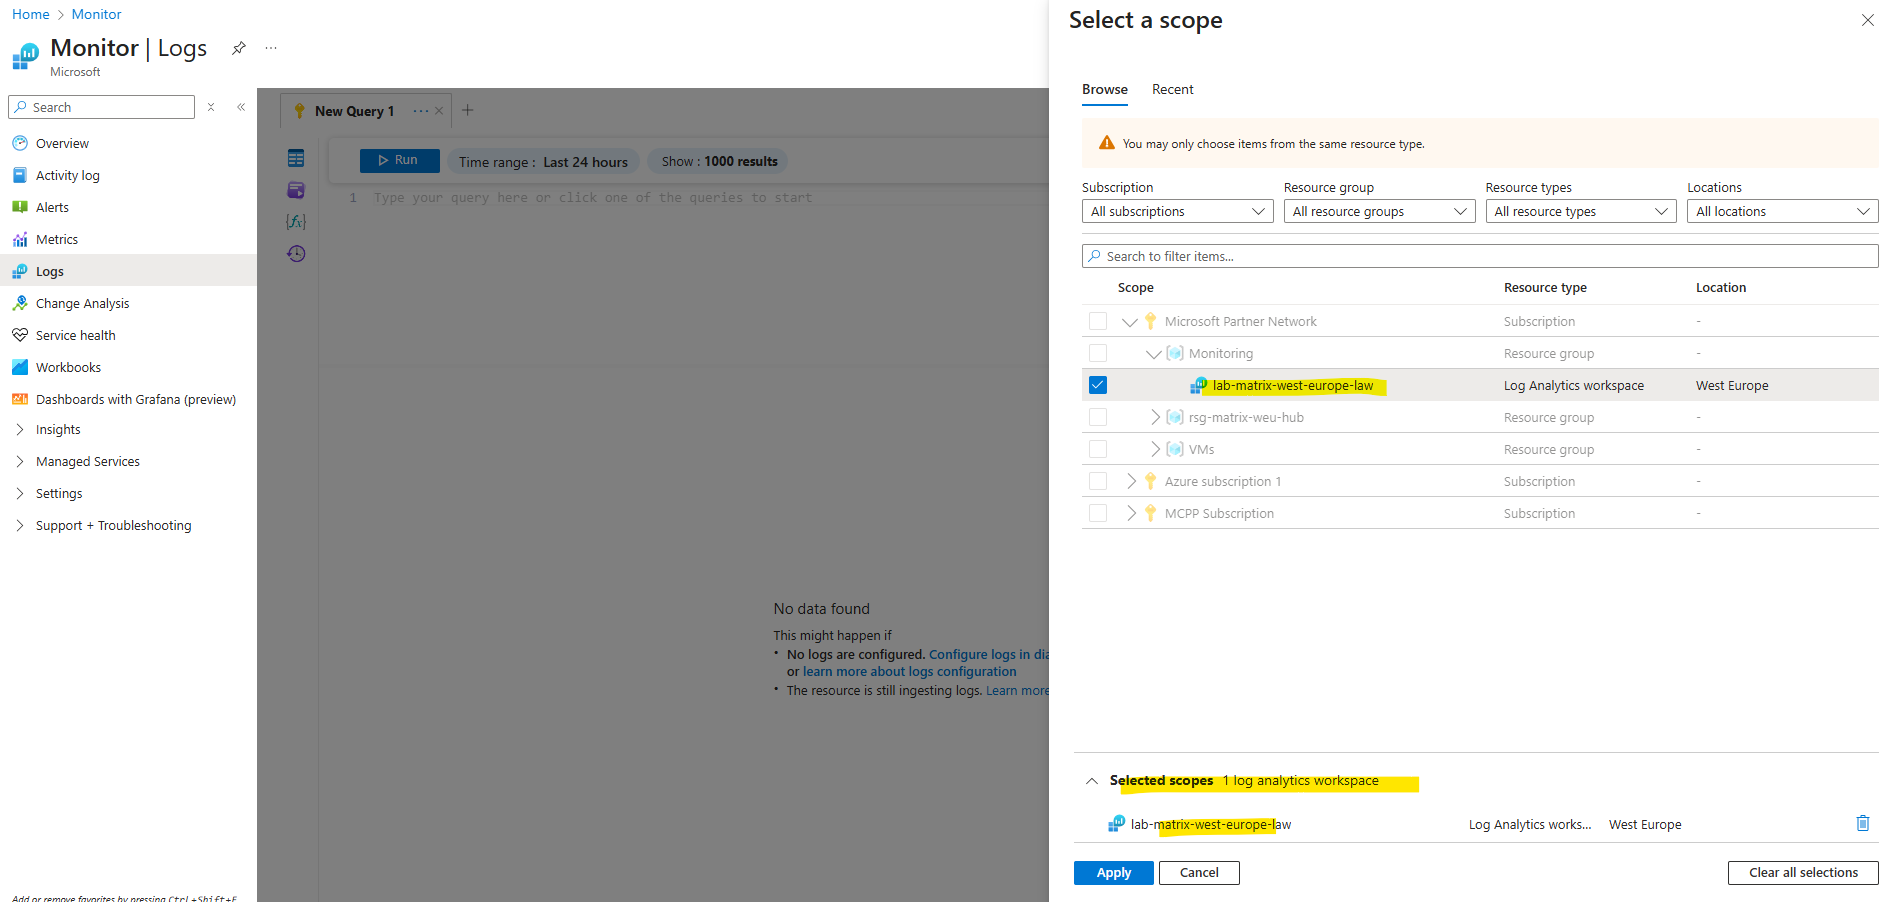
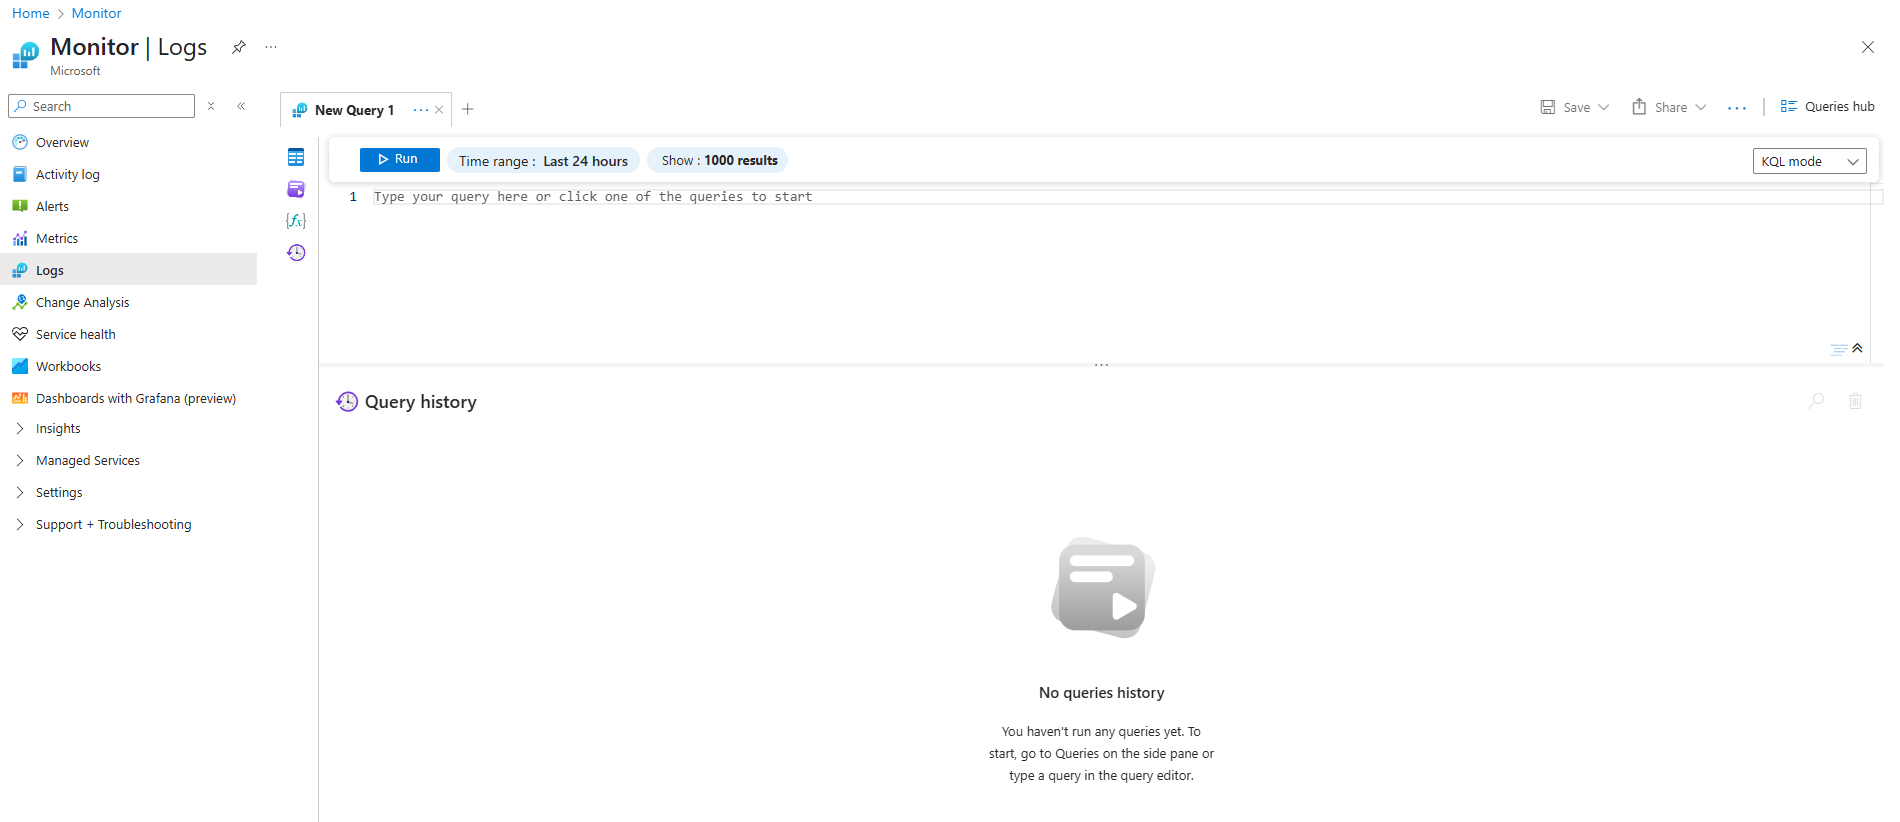
We can already see that the message with “Type your query here …. ” is not greyed out anymore and we can enter or paste our ARG query into.
So in case we haven’t created so far a log analytics workspace, we first need to create one like shown next.
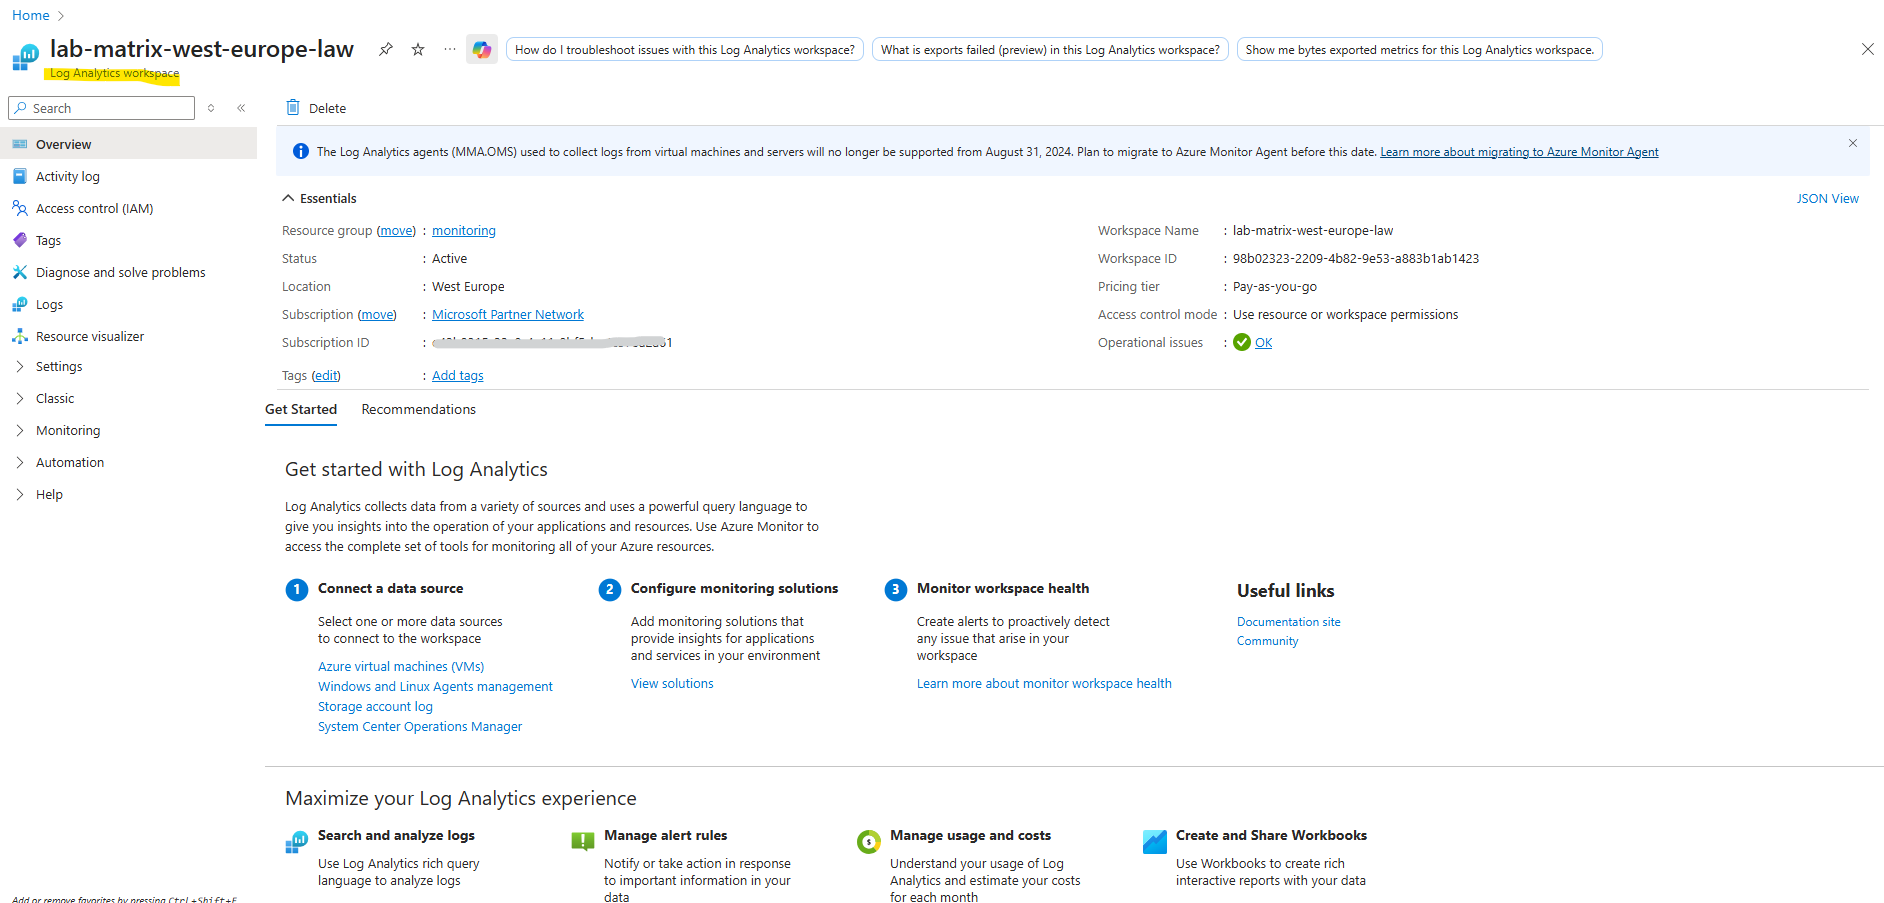
Create a Log Analytics workspace
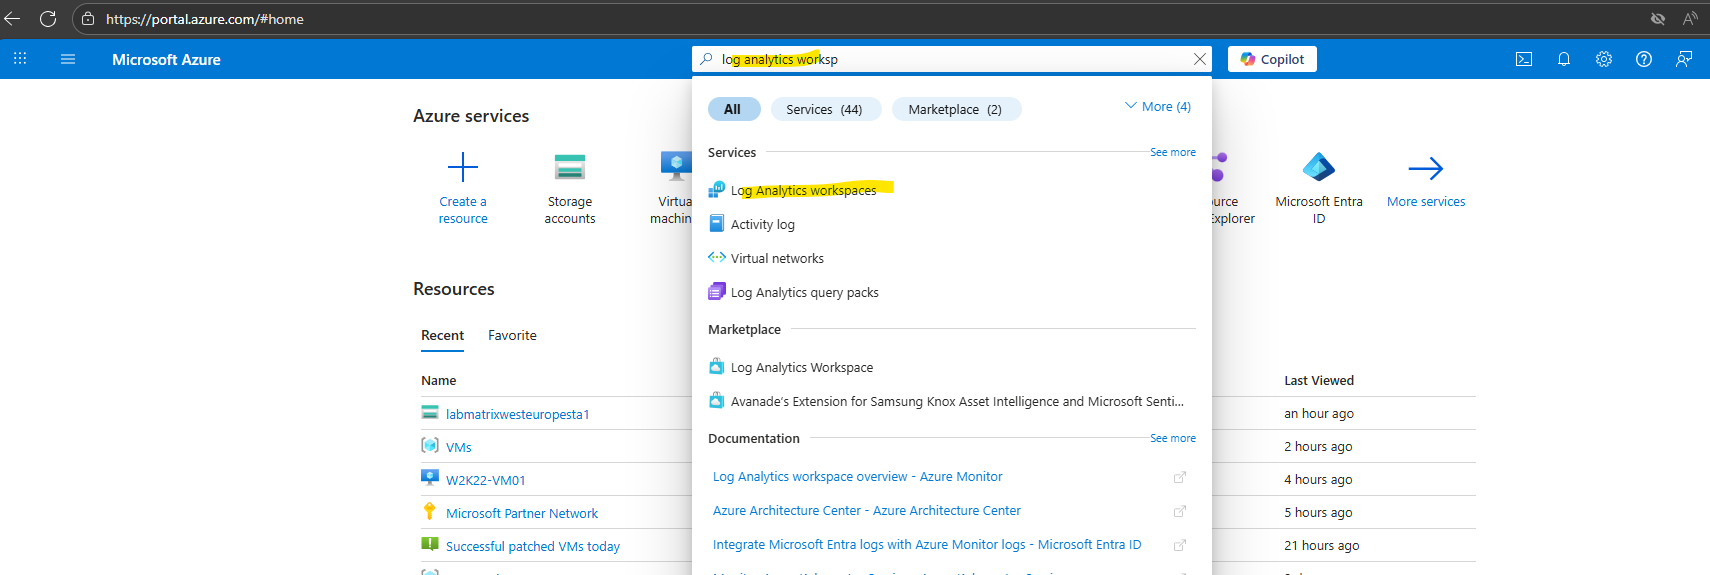
Search for log analytics work … and click on Log Analytics workspaces.
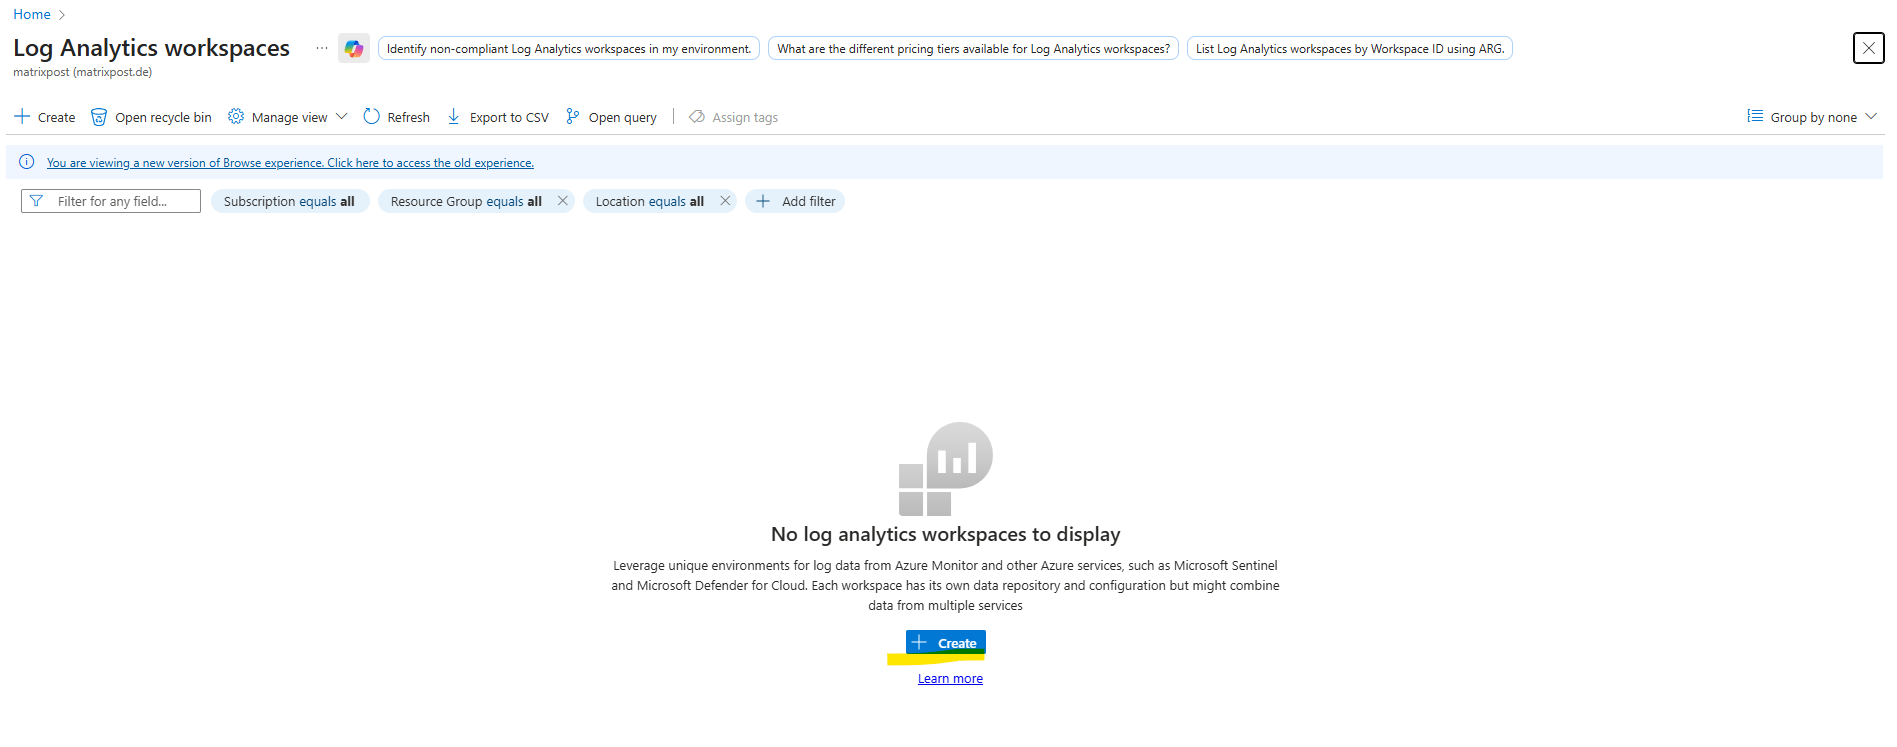
Click on + Create.
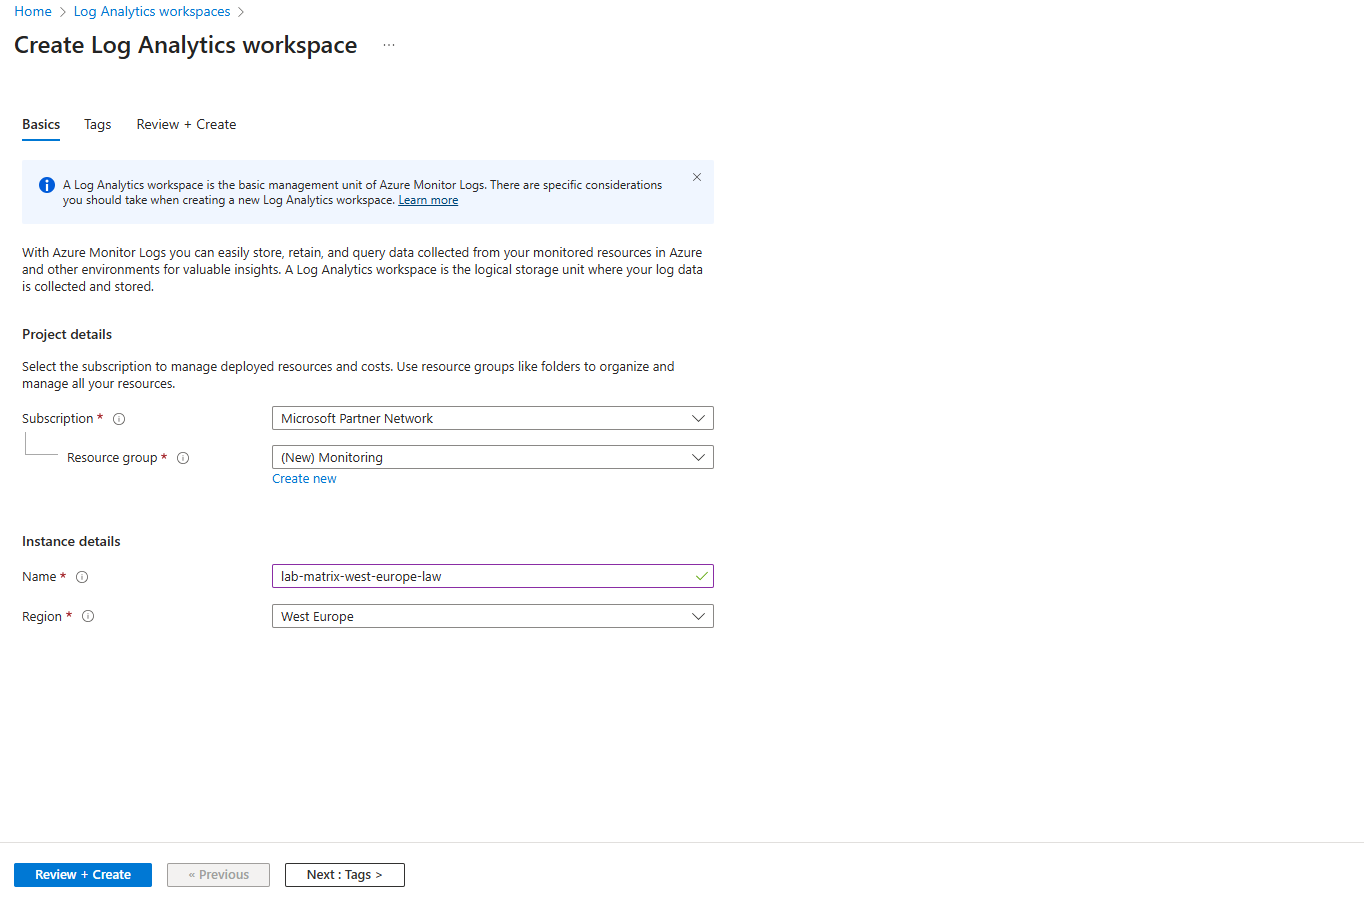
Select a resource group and name for.
Click on Create.
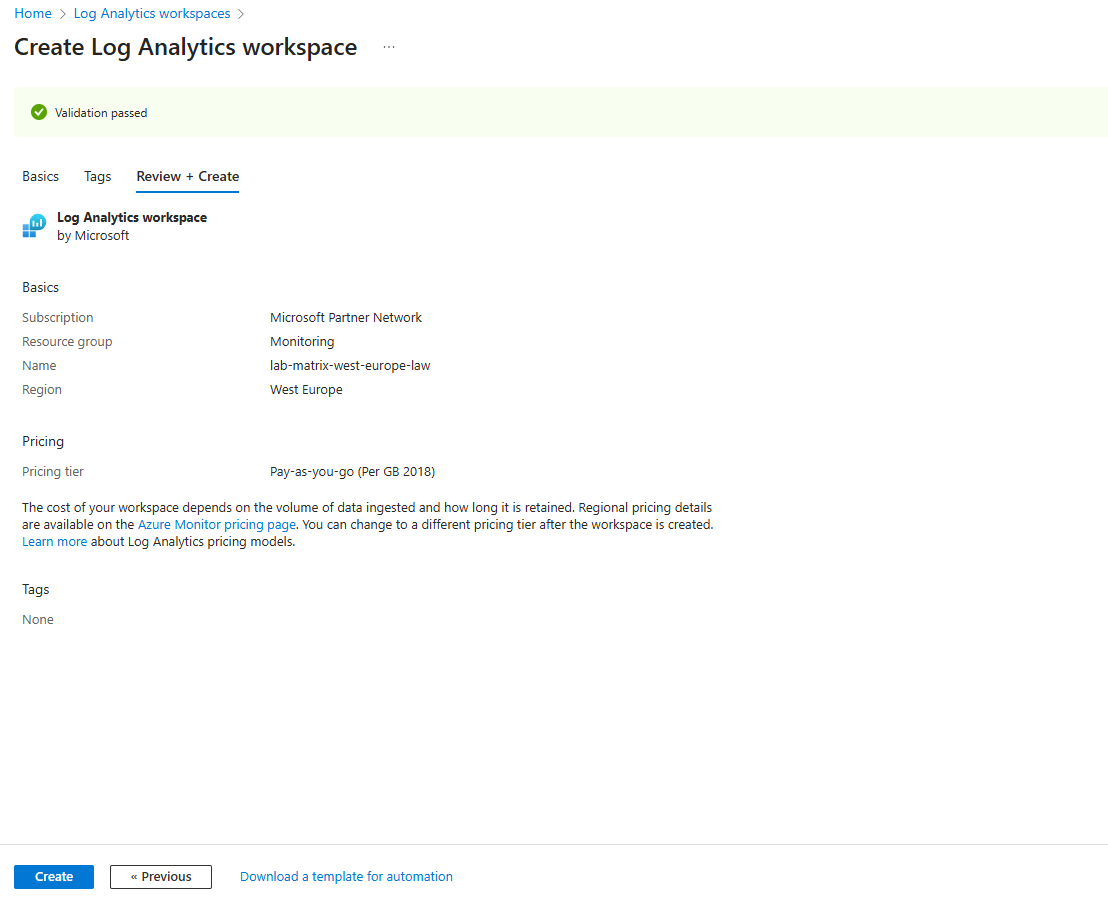
Finally our new log analytics workspace is created.
From the Log Analytics workspace, create an Azure Resource Graph query to get a count of your Azure resources.
The arg(”) operator in Azure Monitor Logs lets us query Azure Resource Graph (ARG) tables directly from the Log Analytics query editor as already mentioned.
However, we still need a Log Analytics workspace to use the Azure Monitor Logs query editor, even if our main goal is to just query ARG tables.
The workspace acts as the context for the query editor, even if the data source is just ARG.
This example uses the Azure Resource Graph Resources table.
Select Logs from the left side of the Log Analytics workspace page. Close the Queries window if displayed.
Use the following code in the New Query:
Table names in Log Analytics need to be camel case with the first letter of each word capitalized, like Resources or ResourceContainers. You can also use lowercase like resources or resourcecontainers.
arg("").Resources
| count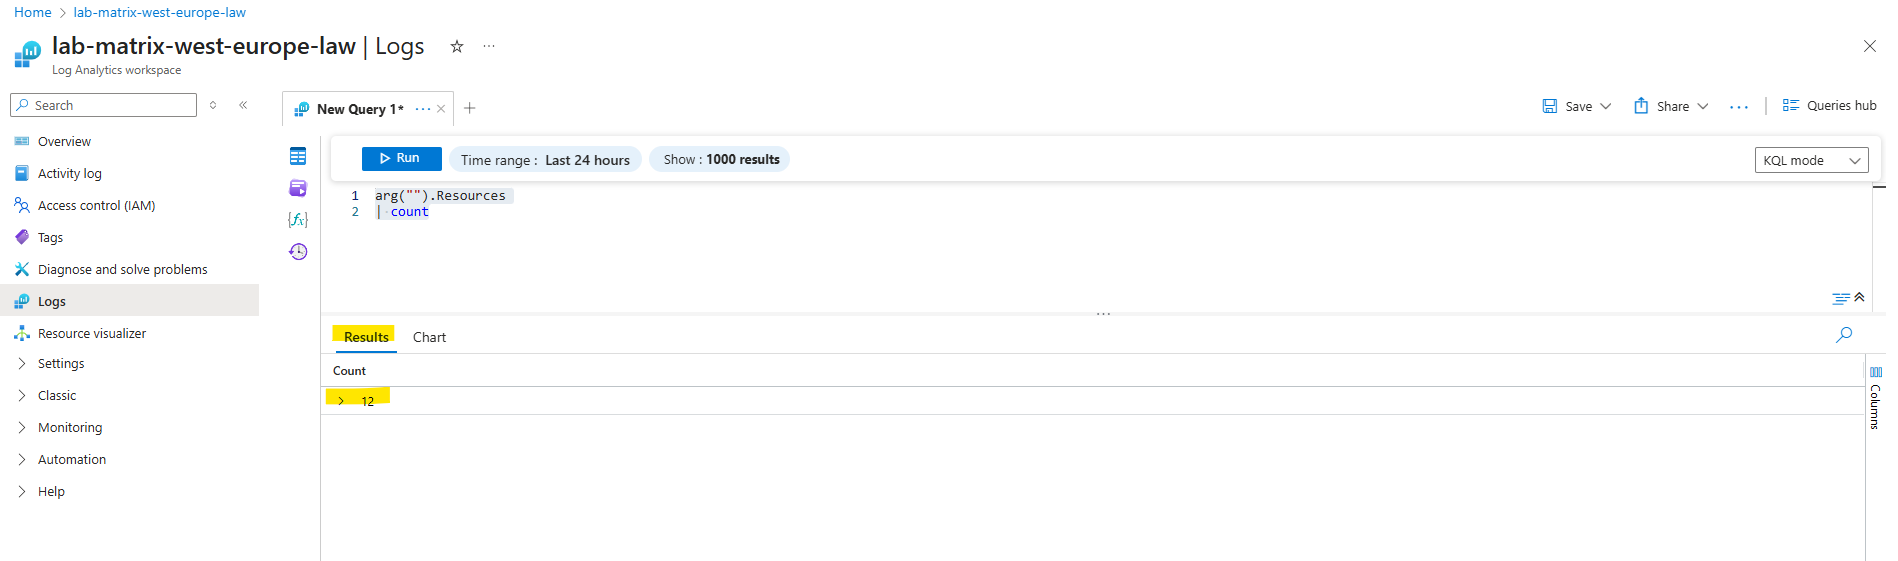
We can now also create a new alert rule which is using this query shown next.
The Results displays the Count of resources in our Azure subscription. Make a note of that number because you need it for the alert rule’s condition.
!! Note !!
Further keep in mind that our result here will return only exact 1 row which includes the count column and value how many resources exists in our Azure subscription.This is crucial when selecting next the desired Measure option for our alert rule.
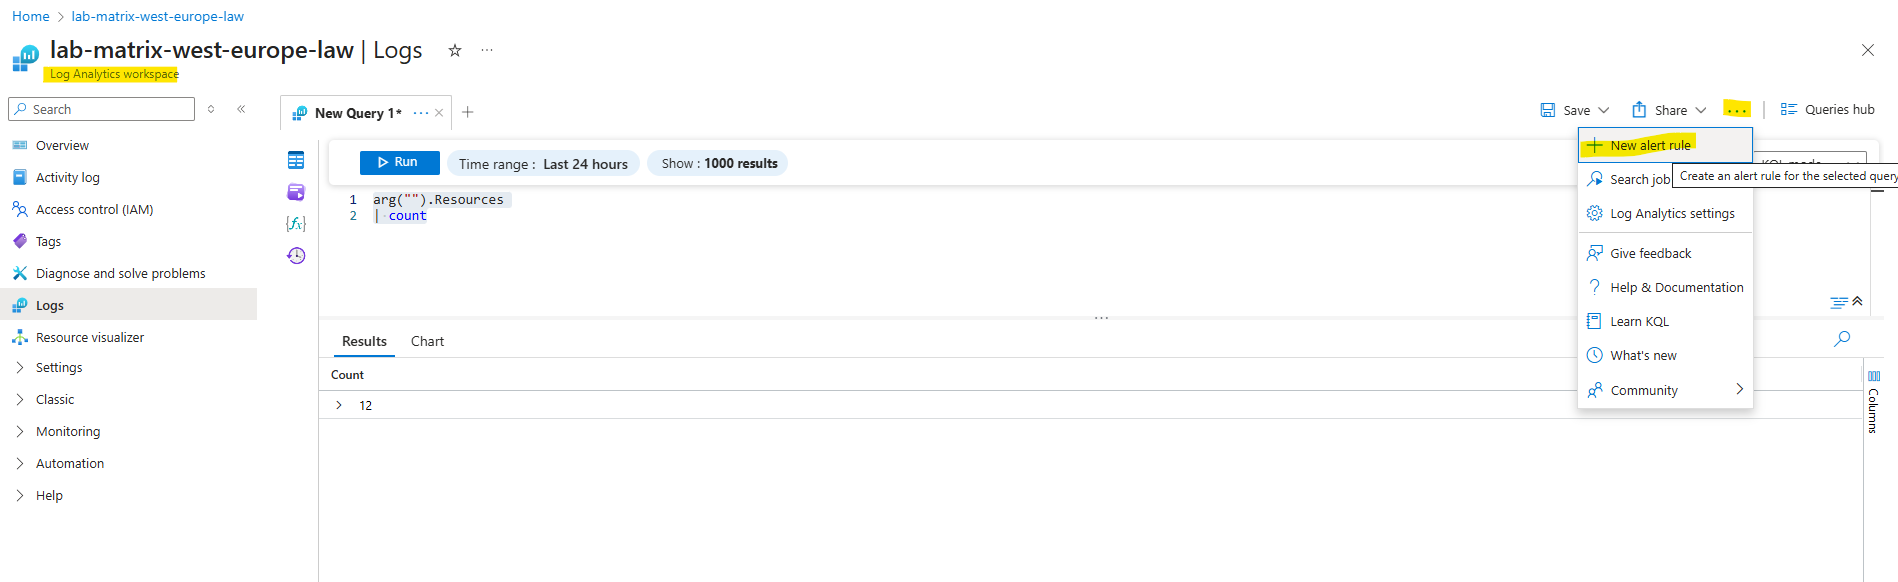
Create an Alert Rule
From the query above select + New alert rule to create a new alert which is using this query to evaluate.
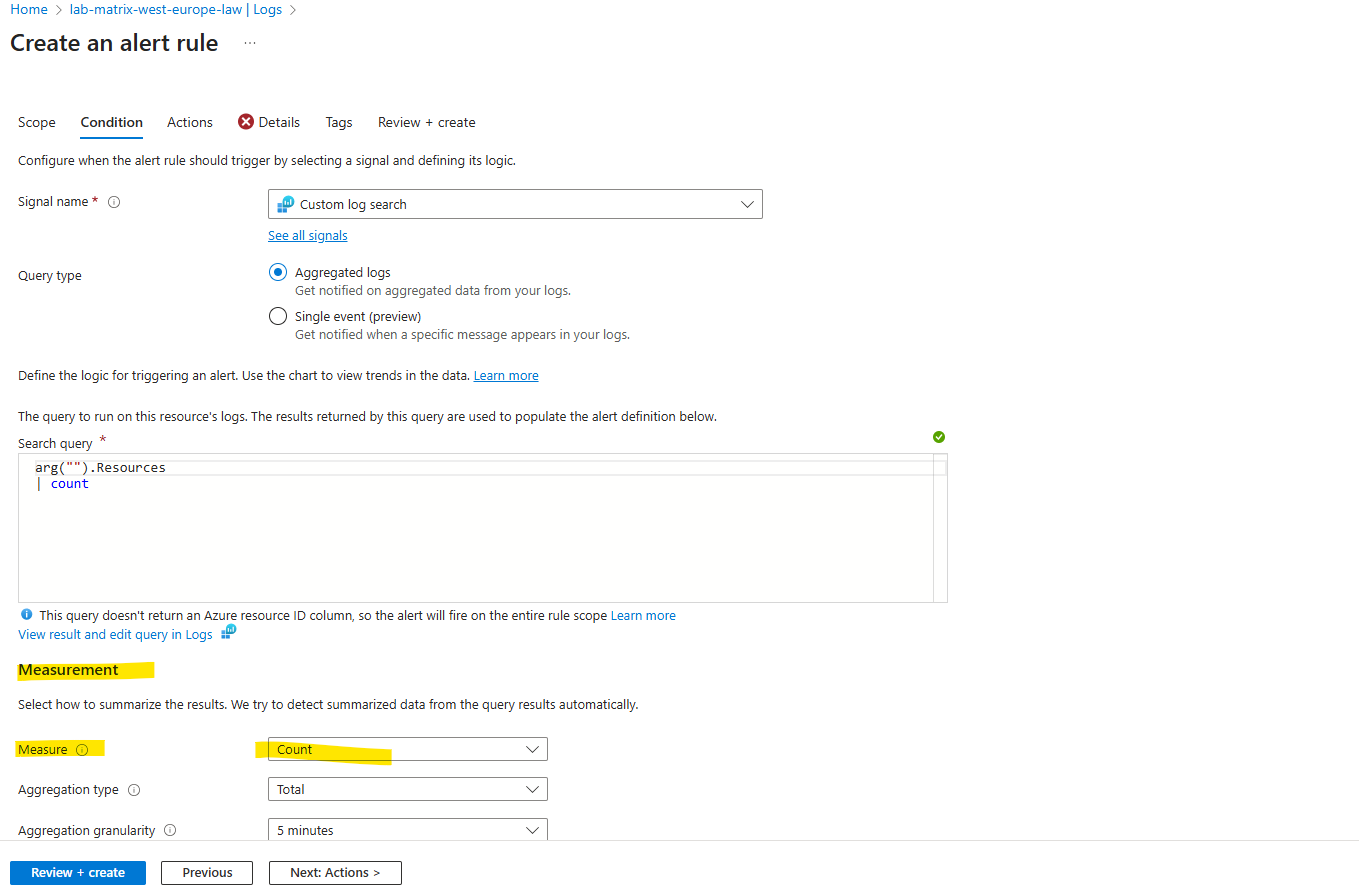
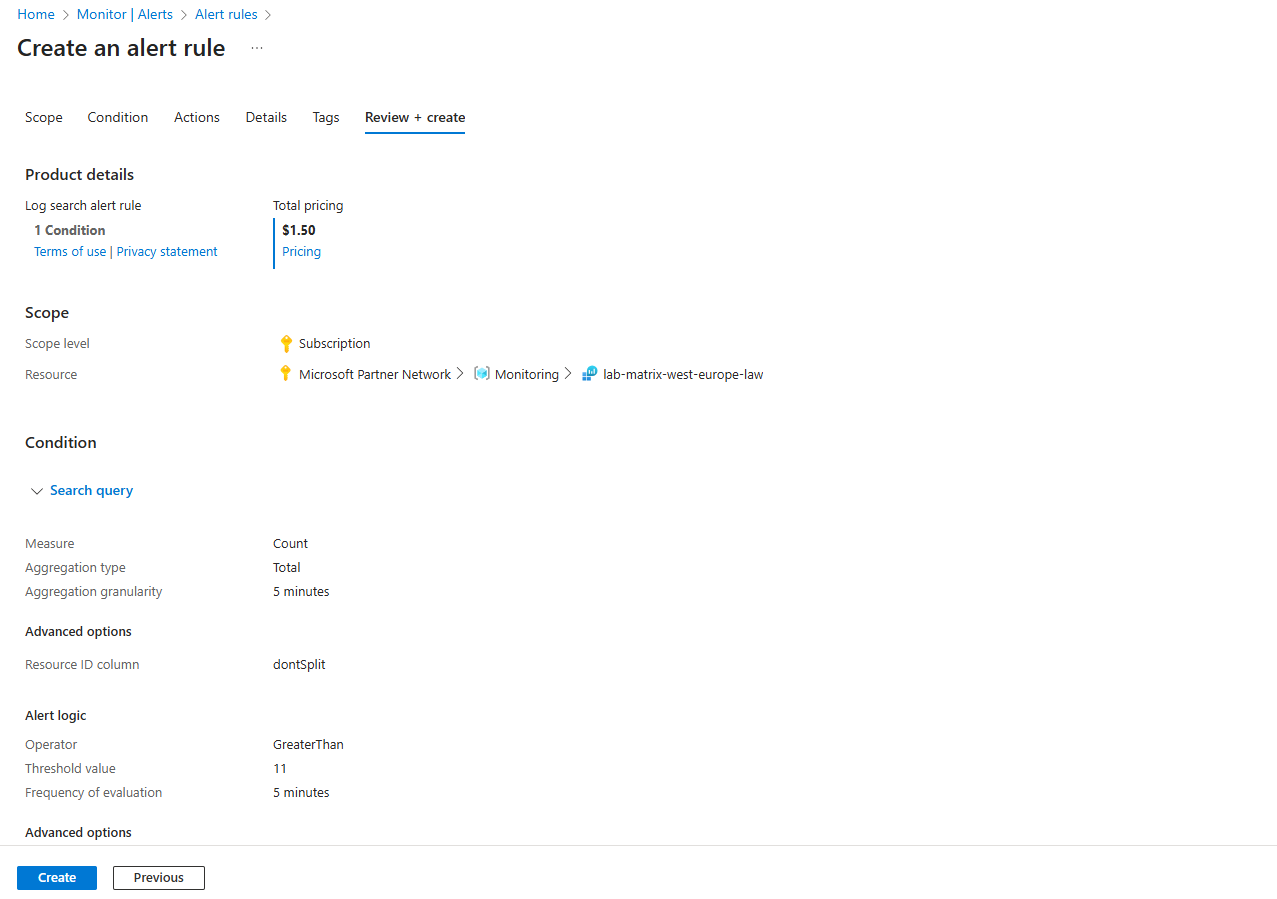
Create an alert rule has several tabs that need to be updated to create the alert.
The query from our Log Analytics workspace is copied to the alert rule.
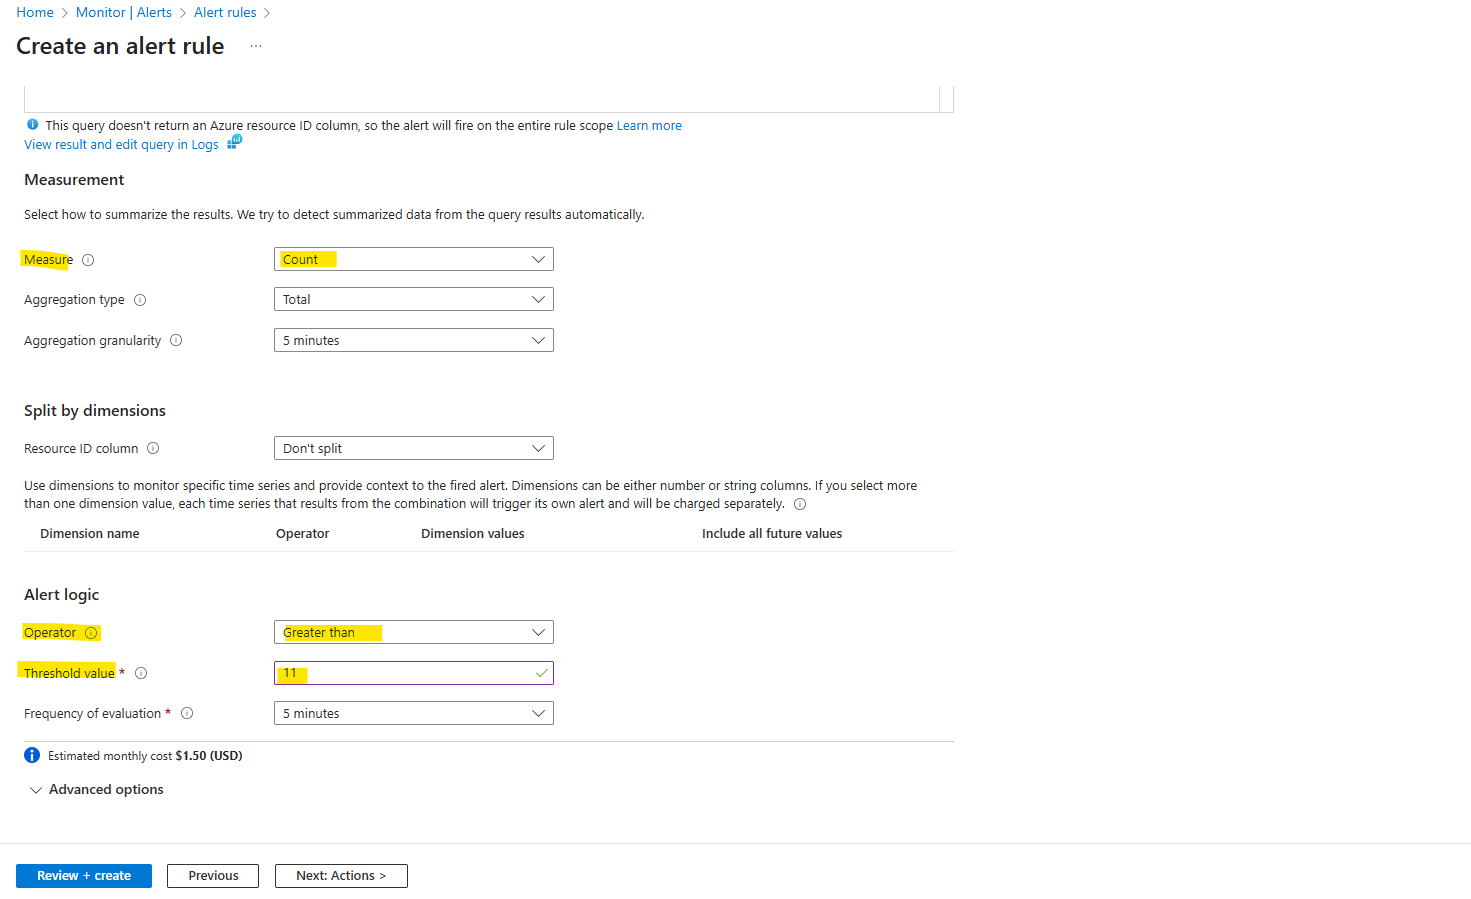
For the Measure option below verify it is set to Count, otherwise our threshold value we set below will never exceed and our alert rule will never fired off.
Count -> Takes the value inside the numeric column(s) in our query result and evaluates them.
Table rows -> Looks only at the number of rows returned by our query, not at the values inside like for Count. Usually Table rows as the measure → only makes sense if the query actually returns multiple rows.
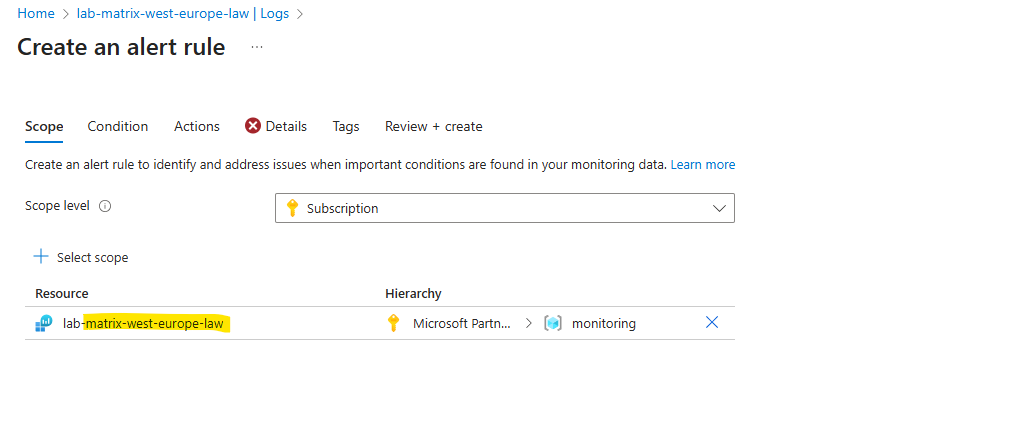
Verify that the scope defaults to your Log Analytics workspace, in my case named lab-matrix-west-europe-law.
The scope you define in an Azure Monitor alert rule controls where the rule looks for signals (metrics, logs, activity logs, etc.).
On the condition tab select for Measure here Table rows and for the Threshold value use a number that’s less that the number returned from the resources count. Click on Next actions.
Regarding Measure below, this is where we have to map our query result (Kusto/ARG) into something the alert rule engine can evaluate.
Count -> Takes the value inside the numeric column(s) in our query result and evaluates them.
Table rows -> Looks only at the number of rows returned by our query, not at the values inside like for Count. Usually Table rows as the measure → only makes sense if the query actually returns multiple rows.
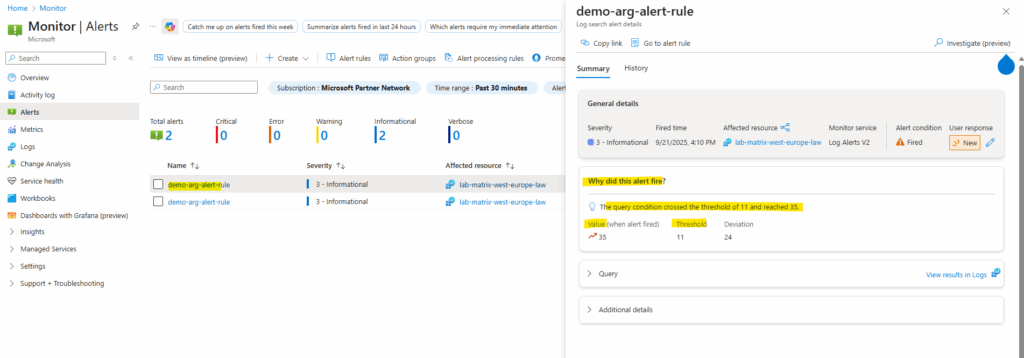
In my case the resource count was 12 and I will use for the threshold value here 11. This value triggers the alert to fire when it evaluates our resources because our number of resources is greater than the threshold value.
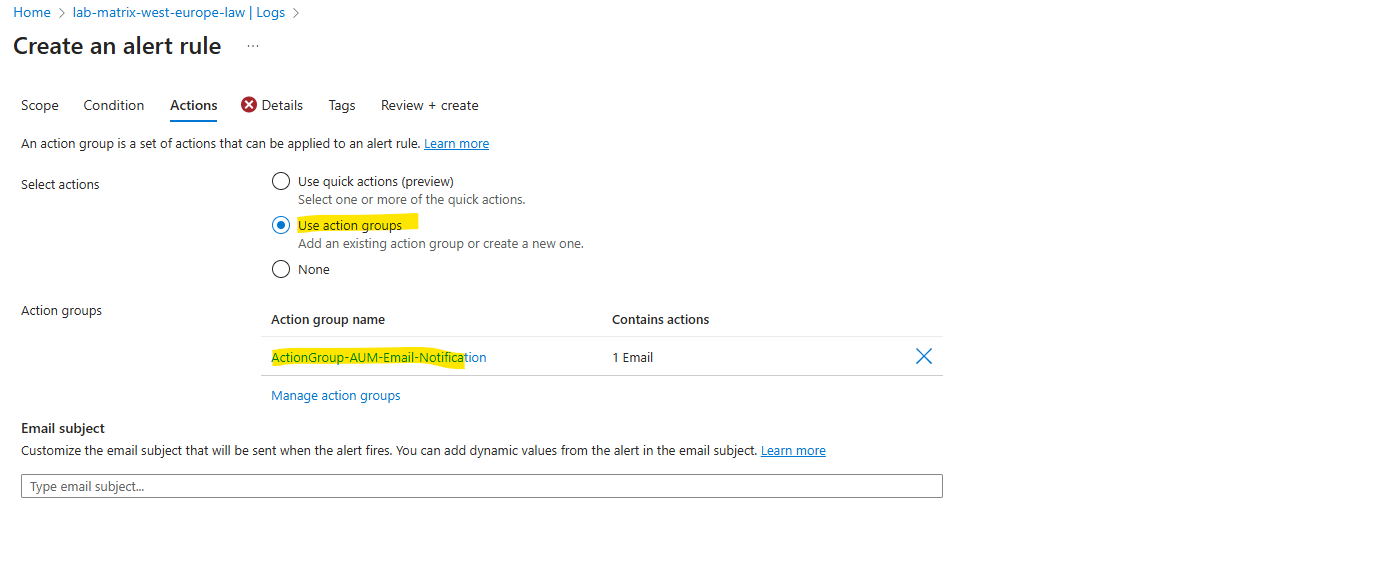
On the Actions tab either select an existing action group or create a new one by clicking on the link Manage action groups.
When Azure Monitor data indicates a potential issue in your infrastructure or application, it triggers an alert. To ensure timely response, you can attach action groups to these alerts, which are collections of notification preferences and automated actions.
Action groups define who gets notified and what actions are taken when an alert fires.
In my case the already existing action group named ActionGroup-AUM-Email-Notfication shown below will finally send an email to my personal email address. I was using this for my post about the Azure Manager shown in Part 4. Here we will see how to get notified about patch installation states (like e.g. Succeeded or Failed) per email by using Azure Monitor alerts.
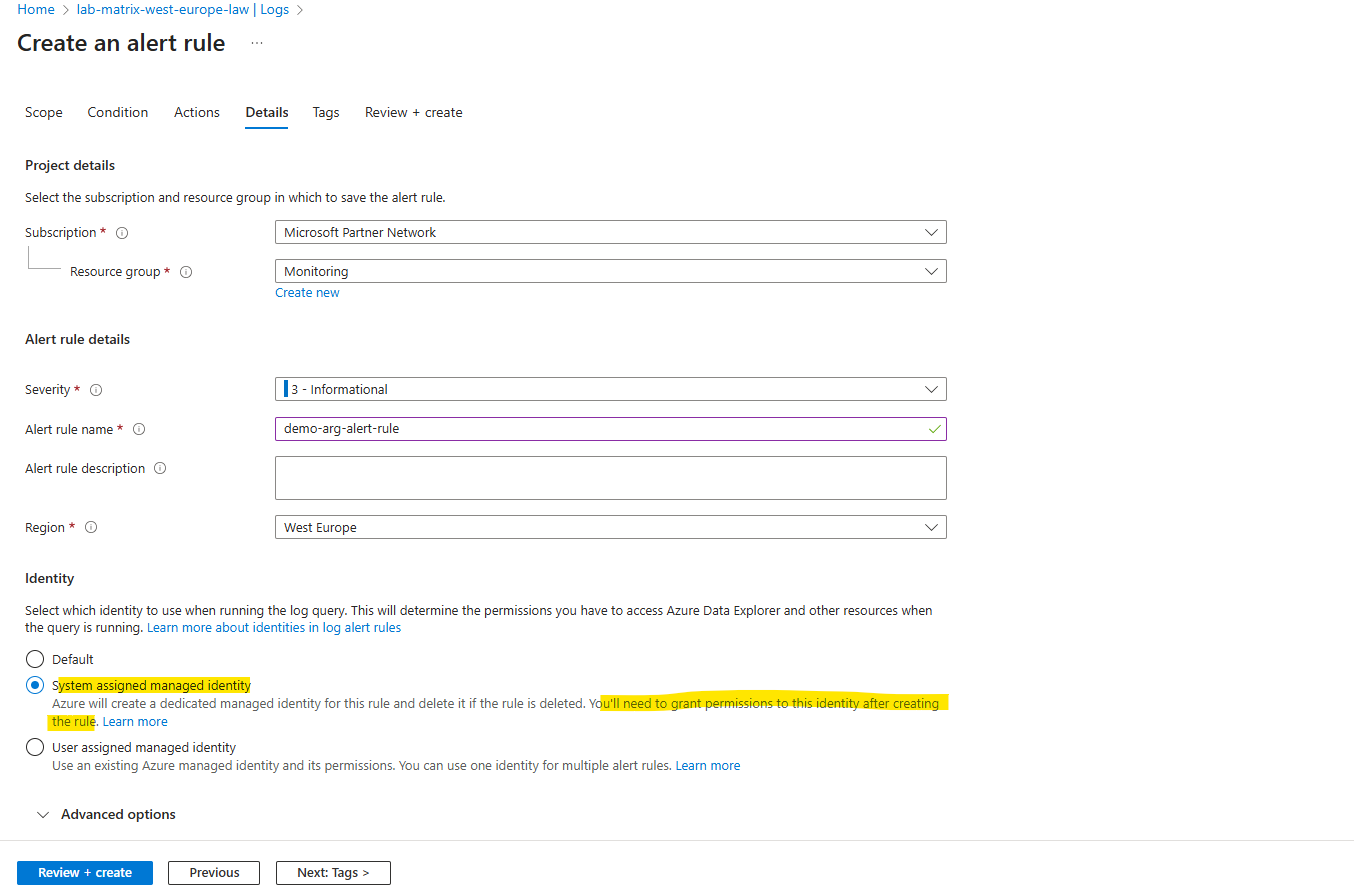
On the Details tab we need to select an identity, I will select here the system-assigned managed identity. We also need to grant permissions to this identity after creating the rule so that it has permissions fire alerts that send email notifications.
Some Azure Monitor alert rules don’t need an identity because the platform already has access to built-in signals like metrics and activity logs. But when an alert queries customer-owned data sources such as a Log Analytics workspace or Azure Resource Graph, Azure Monitor creates a system-assigned managed identity that must be granted the right RBAC role to read that data. This ensures alerts can run securely without over-privileged access.
Our alert here needs to access the Azure Resource Graph and therefore needs at least read permissions.
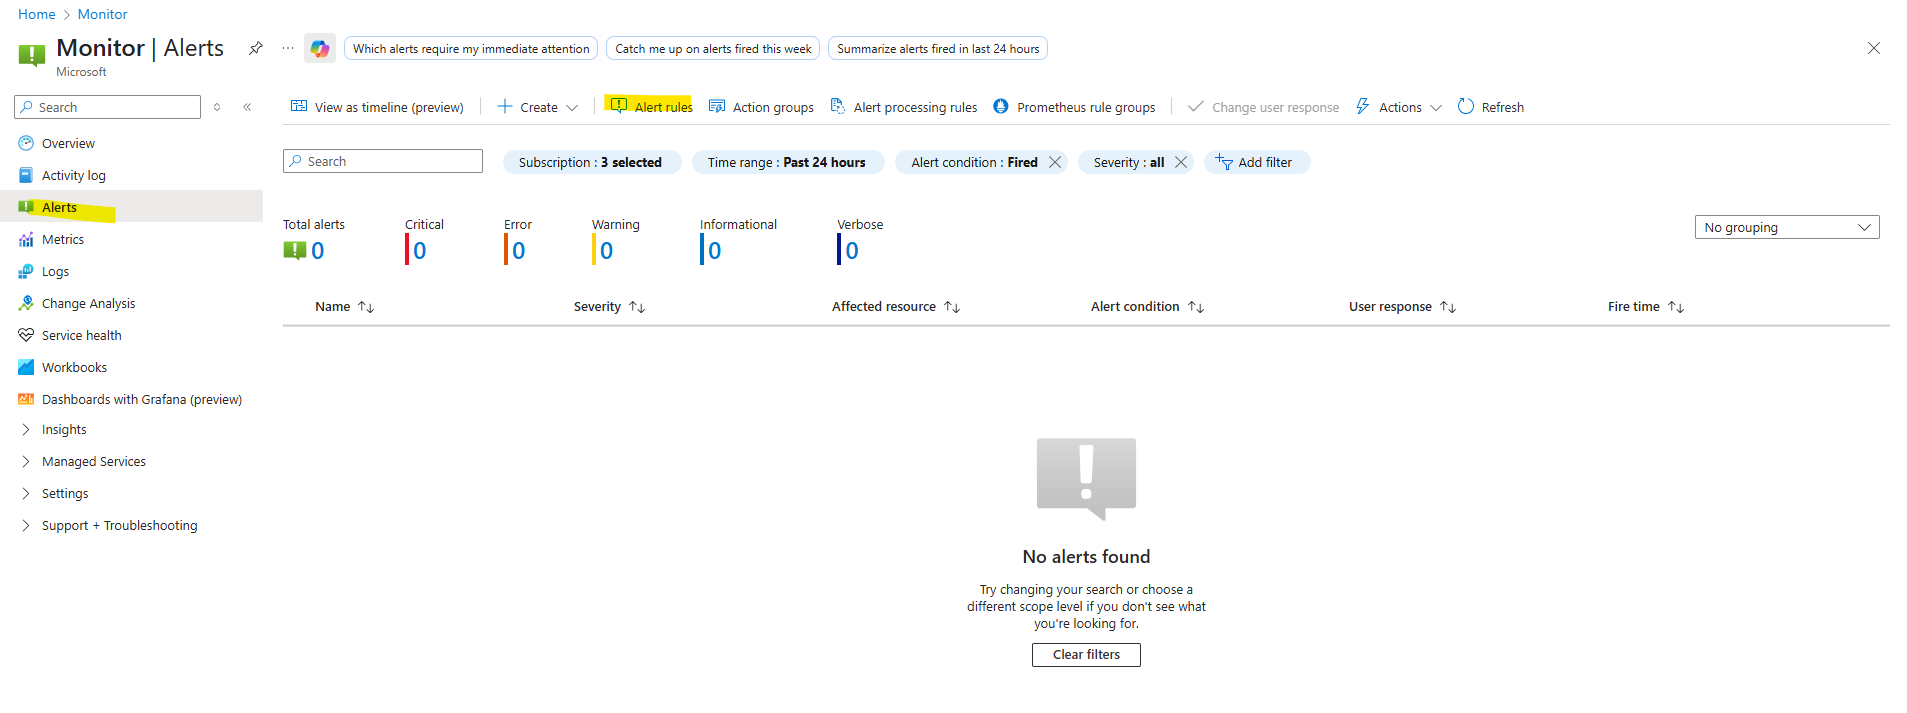
The created alert rule we will find under Azure Monitor -> Alerts -> Alert rules.
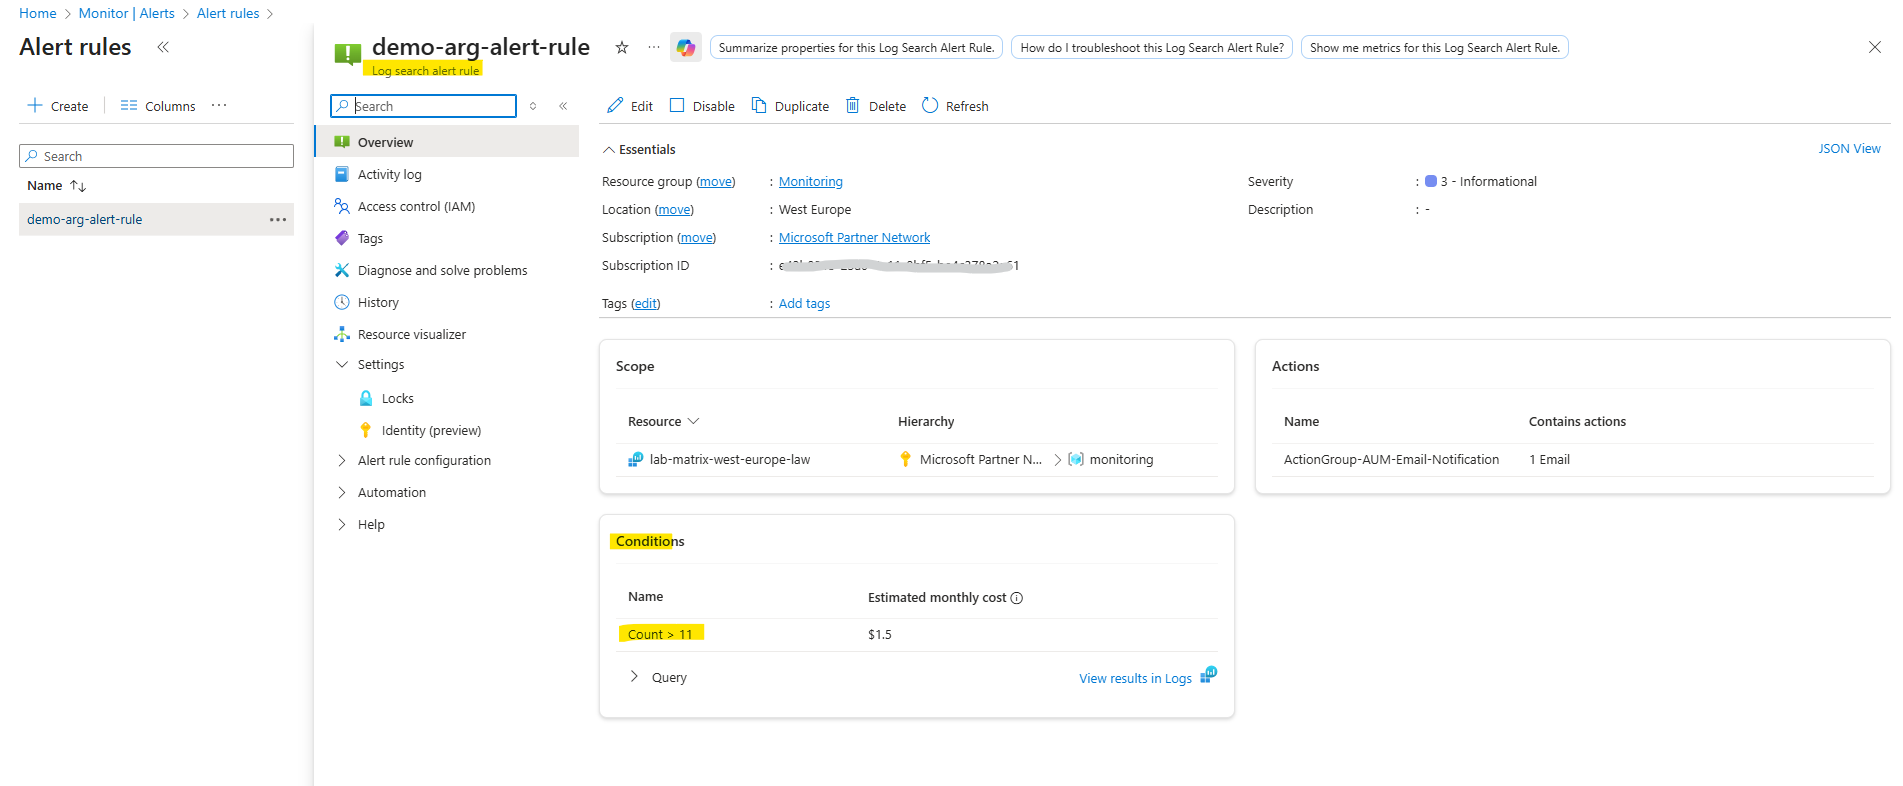
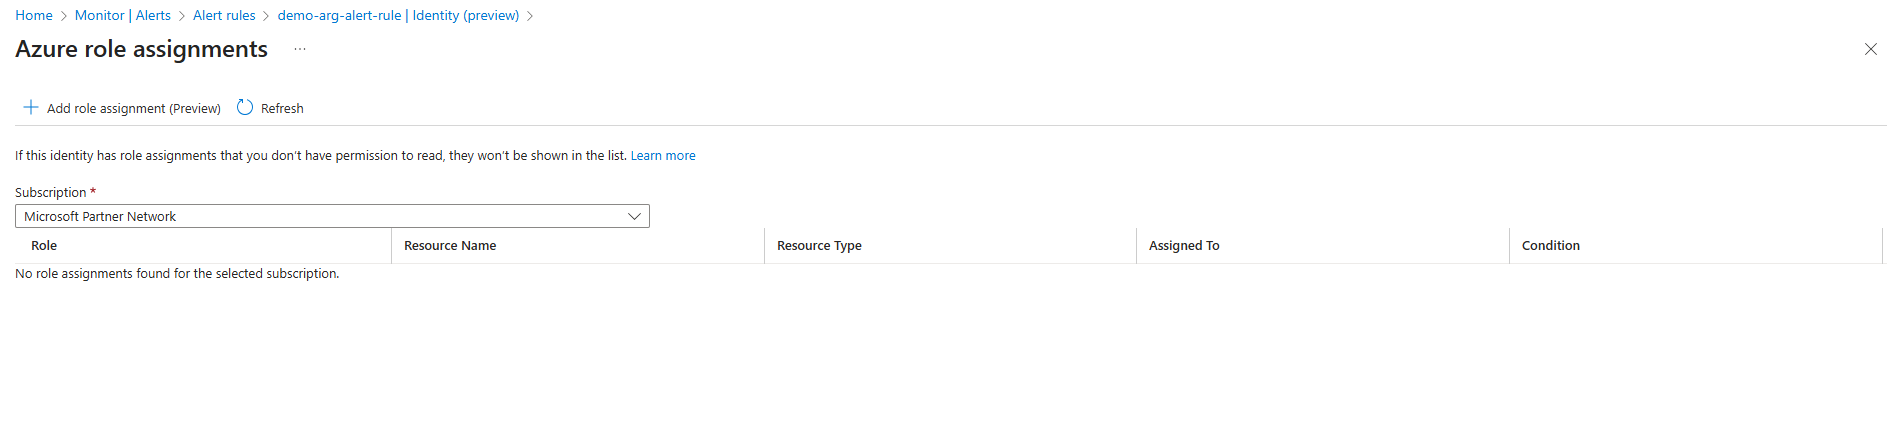
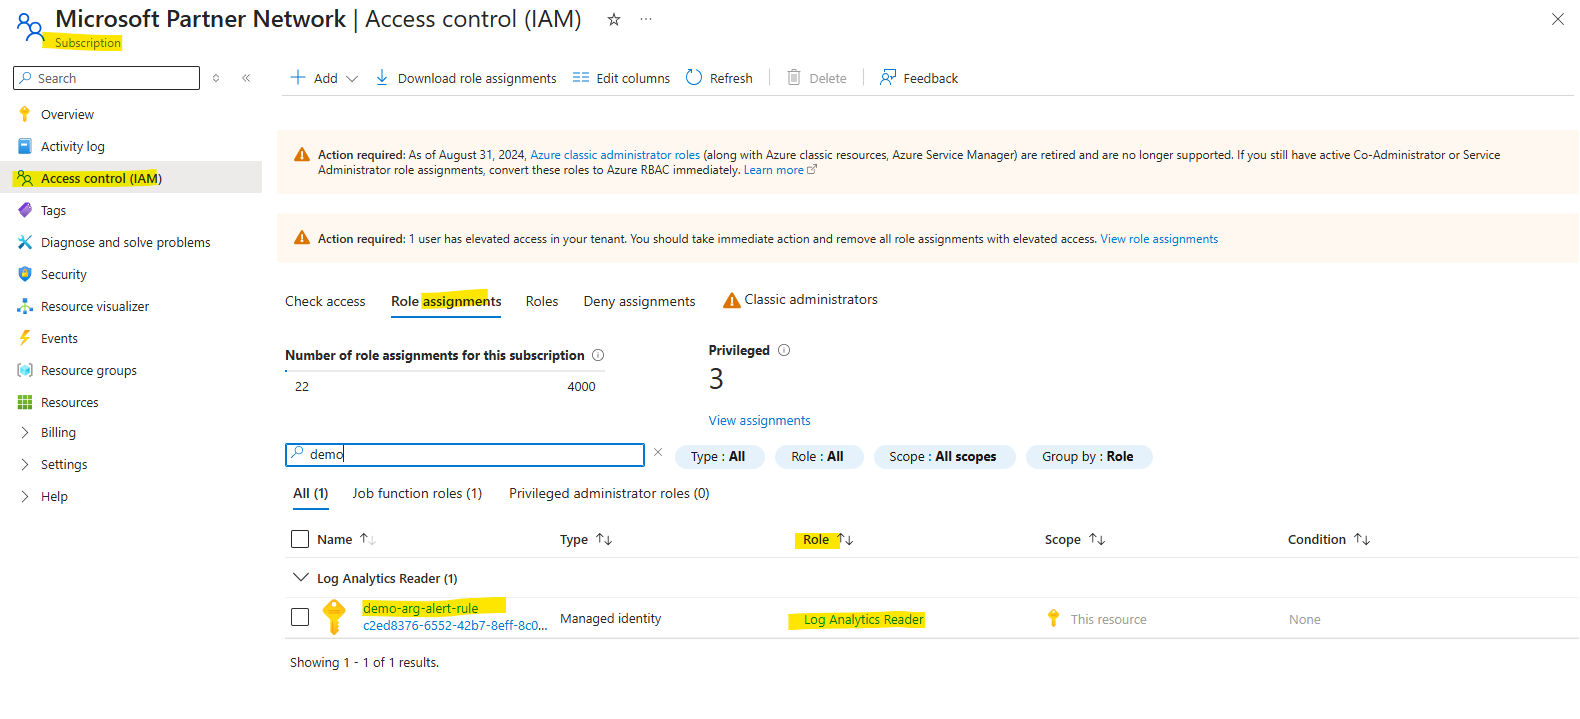
On the log search alert rule under Settings -> Identity (preview) we can check the Azure Role assignments or by just navigating to our subscription and checking if our identity is already assigned under Access control (IAM) -> Role assignments.
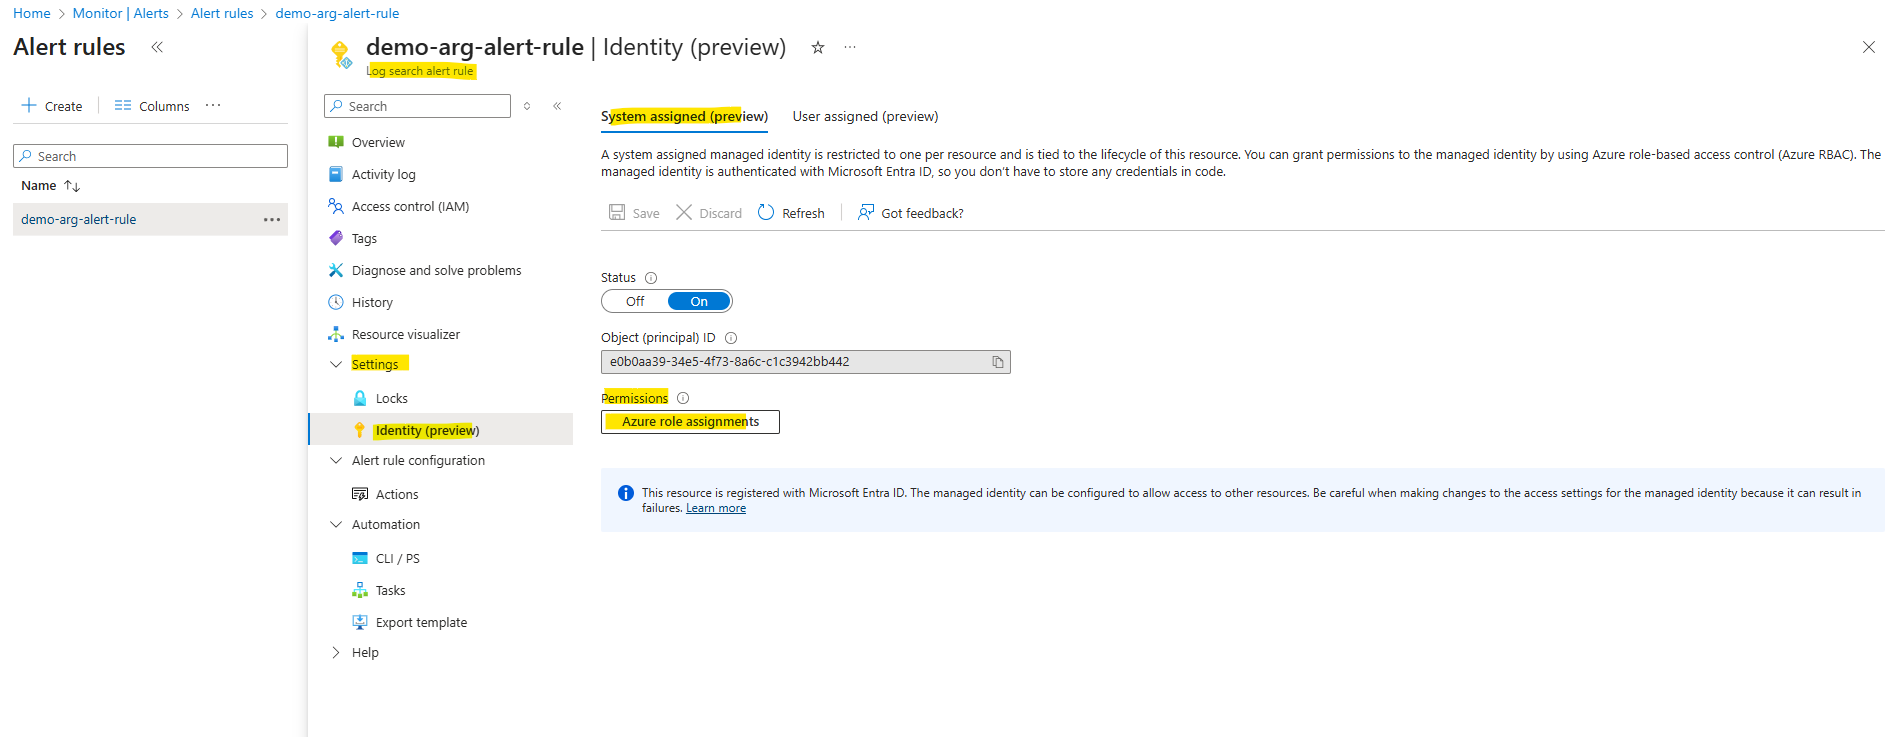
So far no role is assigned to our identity.
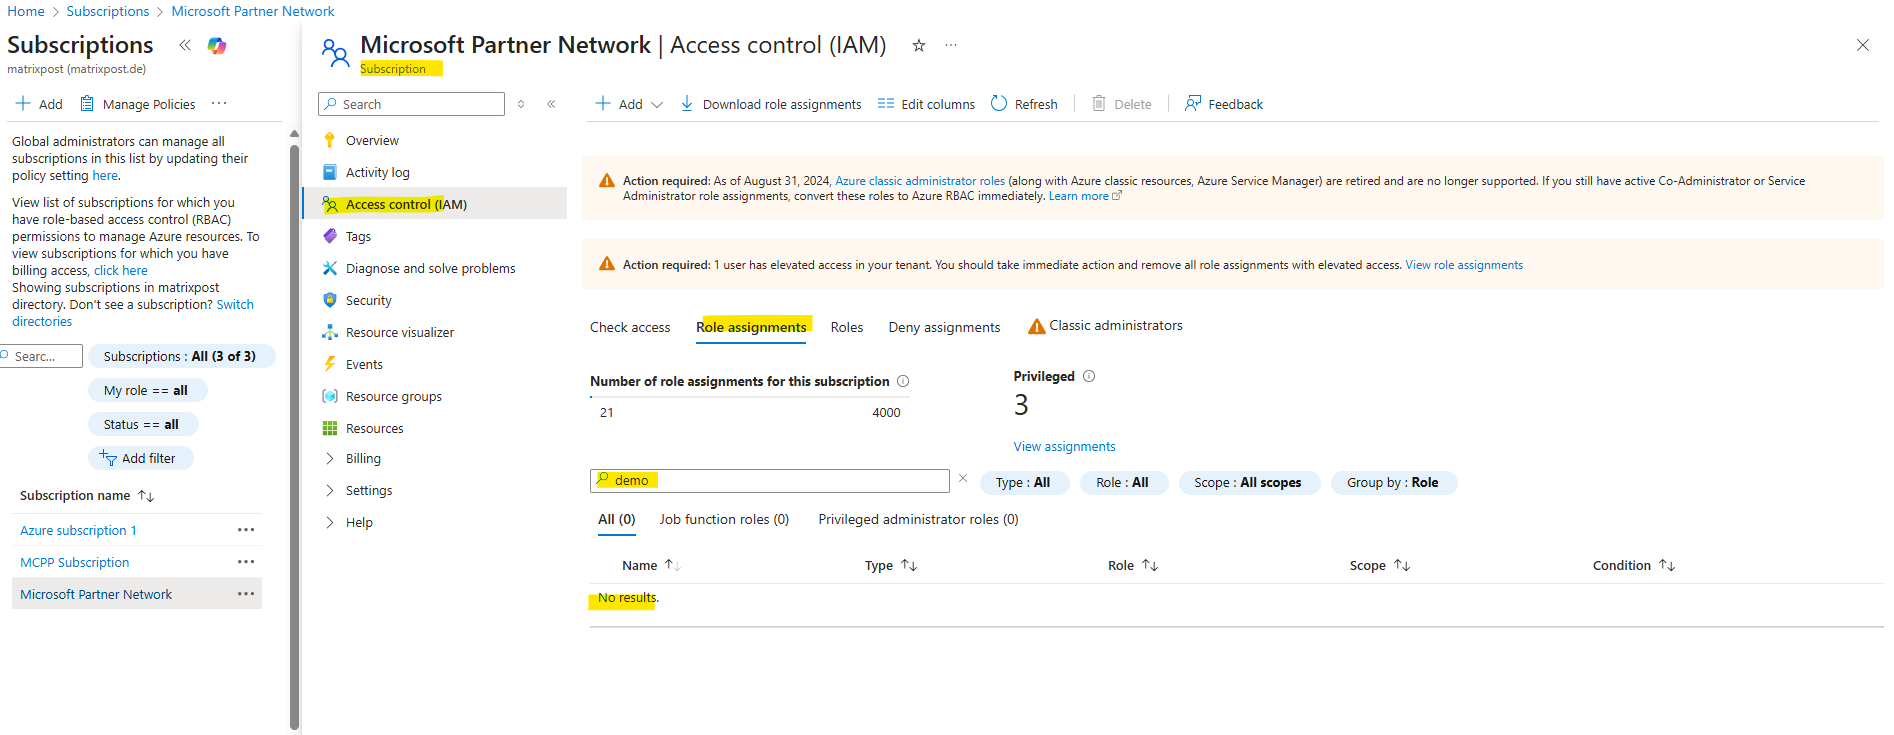
The same directly on the subscription.
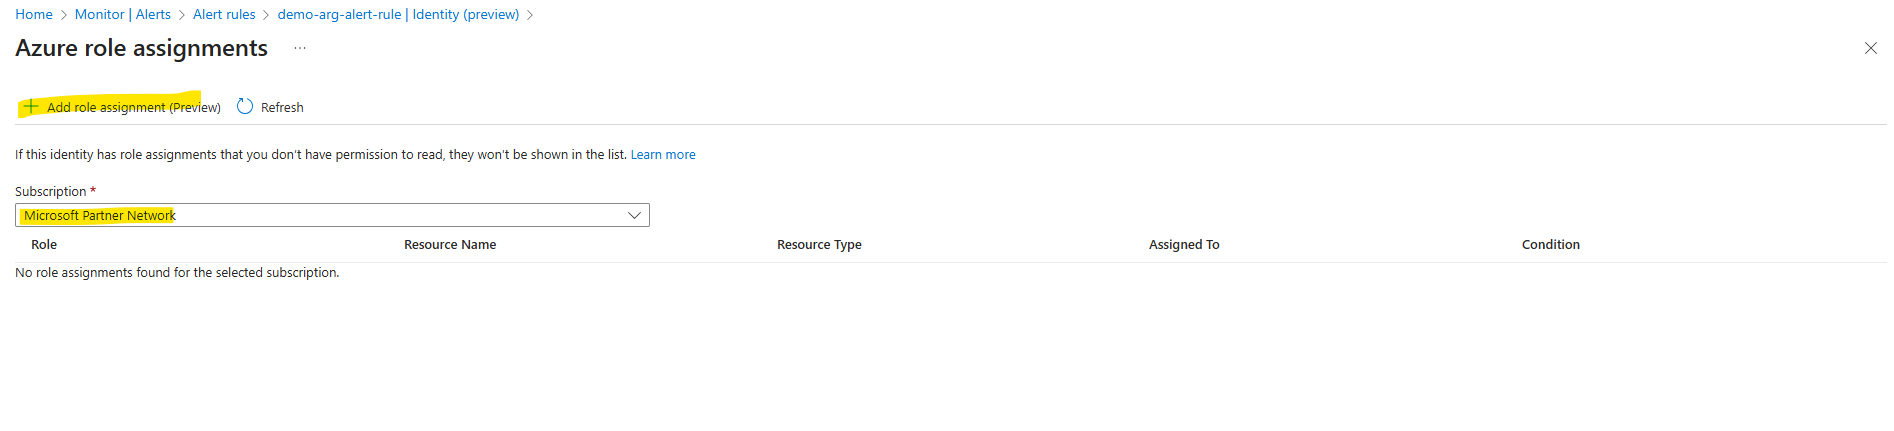
We can now either assign the Log Analytics Reader role directly on the subscription as usual or by using the alert rule blade. Click on Assign role assignments.
As already mentioned above, for some alert rules we doesn’t have below under Settings the menu point with Identity.
Some Azure Monitor alert rules don’t need an identity because the platform already has access to built-in signals like metrics and activity logs. But when an alert queries customer-owned data sources such as a Log Analytics workspace or Azure Resource Graph, Azure Monitor creates a system-assigned managed identity that must be granted the right RBAC role to read that data. This ensures alerts can run securely without over-privileged access.
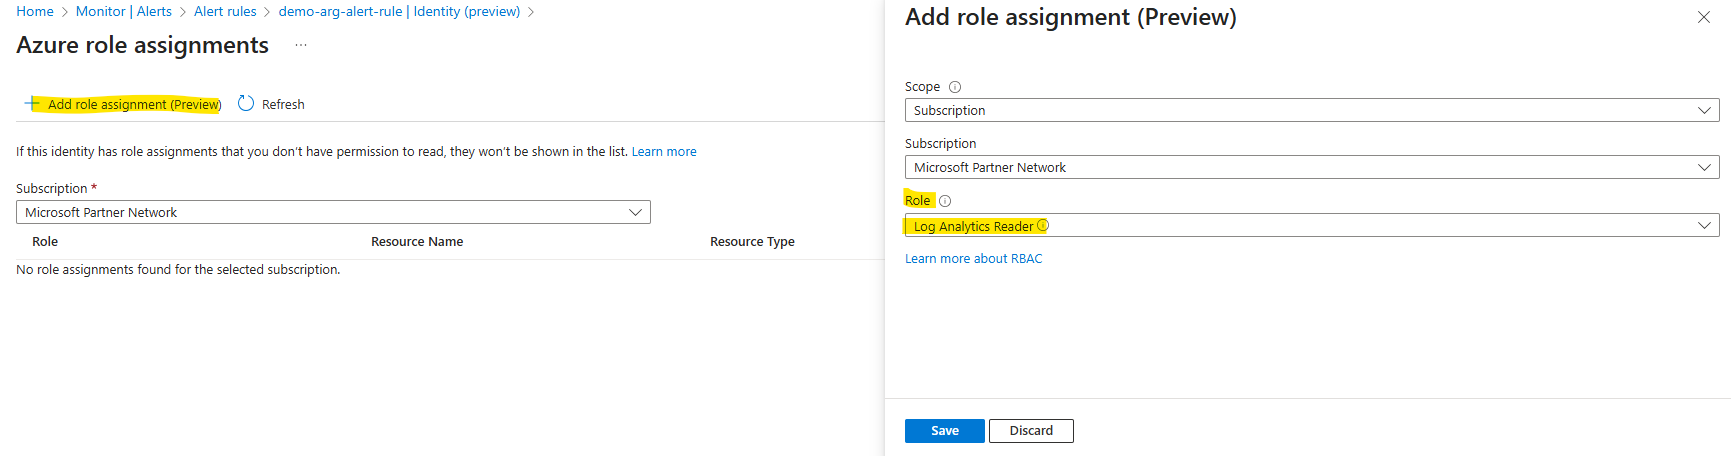
Click on Add role assignment.
Select the corresponding subscription and reader role.
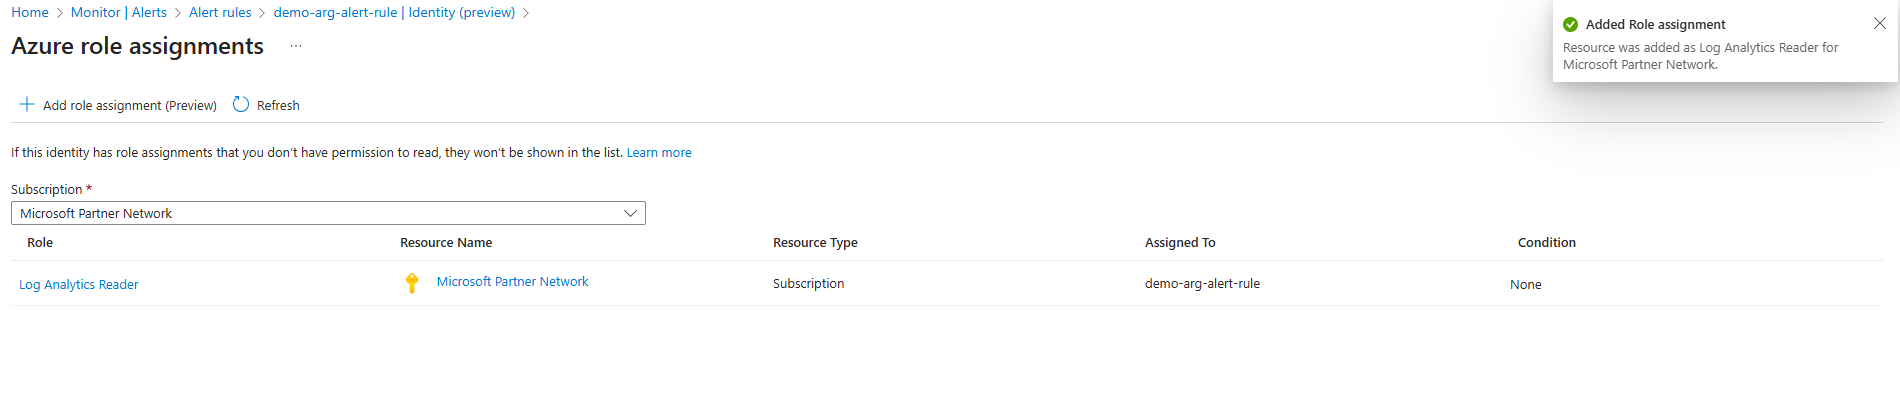
We will now also find the new role assignment directly on the subscription under Access control (IAM) -> Role assignments.
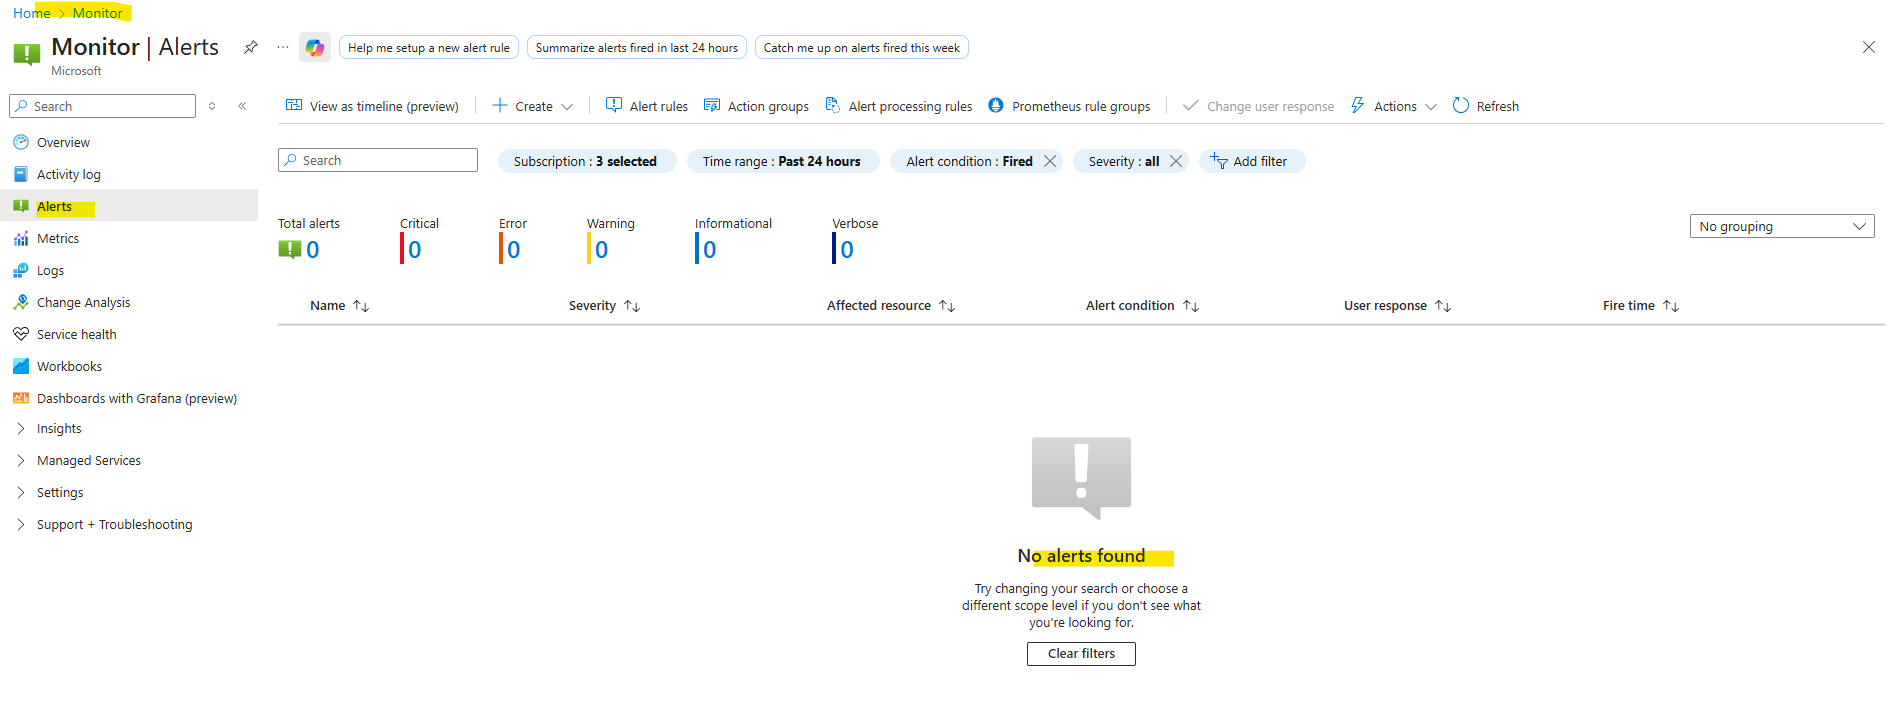
After the role is assigned to our alert rule, we begin to receive emails for alert messages. The rule was created to send alerts every five minutes and it takes a few minutes to get the first alert.
So far directly after assigning the reader role to the subscription where our resources lives, no alerts are fired.
A few minutes later the first alert is fired and from now on each 5 minutes as set previously for frequency of evaluation.
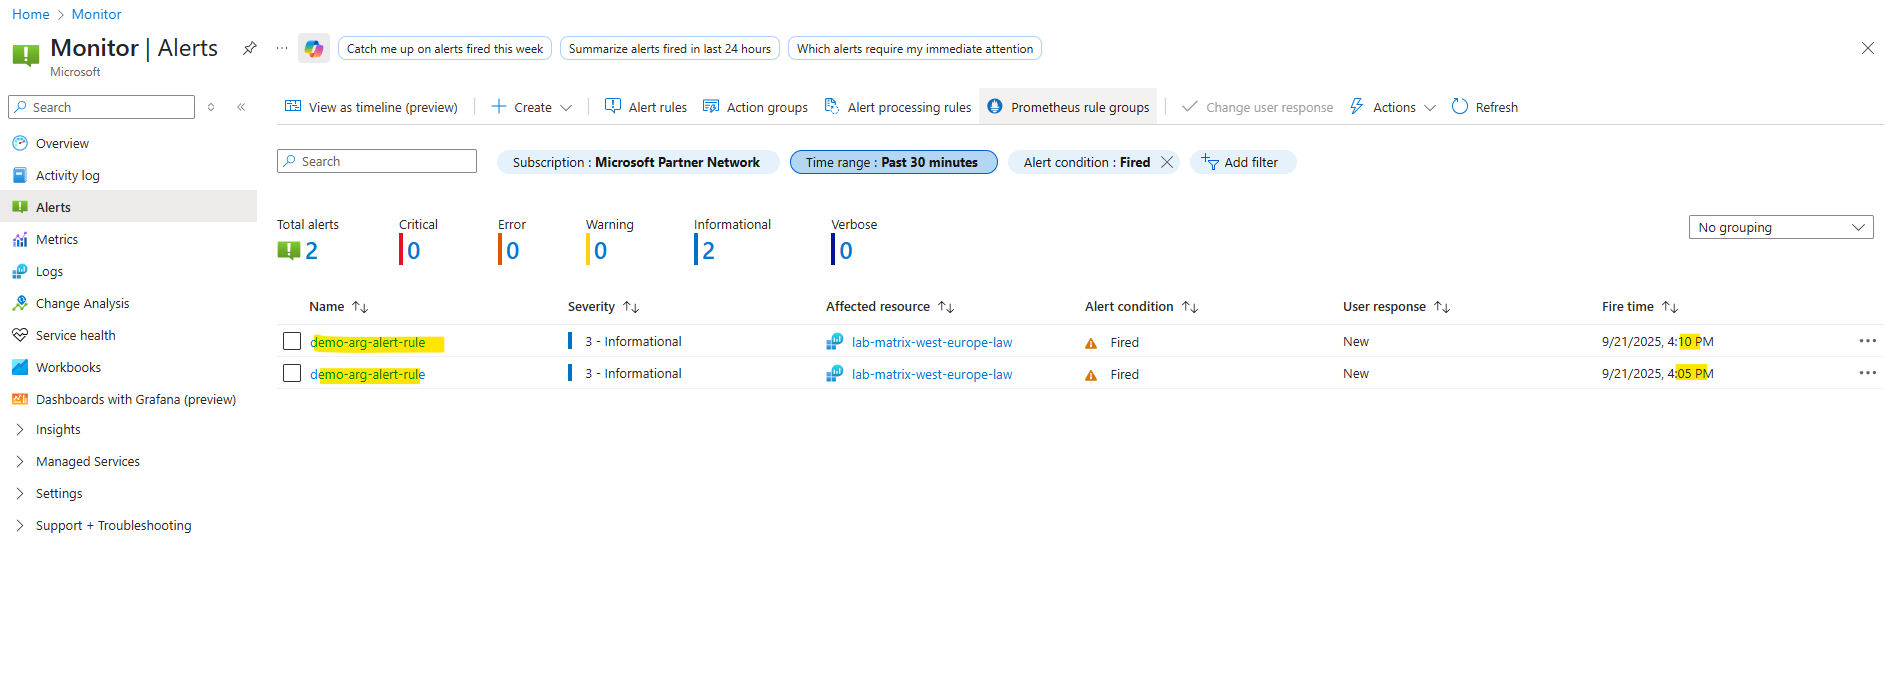
We can also click on the alert below to get more details about why it was fired.
Links
Log Analytics workspace overview
https://learn.microsoft.com/en-us/azure/azure-monitor/logs/log-analytics-workspace-overviewAzure Monitor overview
https://learn.microsoft.com/en-us/azure/azure-monitor/fundamentals/overviewAzure Monitor data platform
https://learn.microsoft.com/en-us/azure/azure-monitor/fundamentals/data-platformAzure Monitor Logs overview
https://learn.microsoft.com/en-us/azure/azure-monitor/logs/data-platform-logsAction groups
https://learn.microsoft.com/en-us/azure/azure-monitor/alerts/action-groupsMicrosoft Azure Monitor – Alert Processing Rules (John Savill)
https://www.youtube.com/watch?v=cHH4RkL-9DgMicrosoft Azure Monitor Agent (AMA) and Data Collection Rule (DCR) Overview (John Savill)
https://www.youtube.com/watch?v=Z1zDlXCwI9kQuery Azure Resource Graph from Azure Monitor
https://techcommunity.microsoft.com/blog/azureobservabilityblog/query-azure-resource-graph-from-azure-monitor/3918298Query Azure Resource Graph from Log Analytics
https://www.cloudsma.com/2023/09/query-azure-resource-graph-log-analytics/Design a Log Analytics workspace architecture
https://learn.microsoft.com/en-us/azure/azure-monitor/logs/workspace-designRETIRED – NEW VERSION AVAILABLE – Microsoft Azure Master Class Part 9 – Monitoring and Security (John Savill)
https://www.youtube.com/watch?v=hTS8jXEX_88