Mastering Packet Monitor (Pktmon) on Windows
For years, troubleshooting network traffic on Windows servers often meant installing third-party tools like Wireshark or Npcap directly on production systems, something many administrators and security teams prefer to avoid.
What many IT professionals still do not realize is that modern versions of Windows Server (Windows 10 and Windows Server 2019 (Version 1809 and later)) already include a powerful built-in packet capture and diagnostics tool: Packet Monitor, better known as Pktmon.
In this post, we will take a deep dive into Packet Monitor (Pktmon), exploring how to capture and filter network traffic directly on Windows servers without installing additional software. We will cover practical real-world troubleshooting scenarios, filtering traffic by IP addresses, protocols, and ports, converting captures into PCAPNG format for later analysis, and using Pktmon effectively in enterprise production environments.
Limitations of Packet Monitor (Pktmon)
Promiscuous Mode
Although Packet Monitor is a powerful built-in troubleshooting tool for Windows, it is important to understand its limitations compared to full-featured packet analyzers like Wireshark with Npcap.
Pktmon primarily captures traffic processed by the local Windows networking stack and therefore does not support classic promiscuous mode for passively sniffing arbitrary Layer-2 traffic on the network. This means Pktmon is mainly intended for troubleshooting traffic to and from the local system rather than acting as a traditional network sniffer on switched networks or SPAN/mirror ports.
Duplicate Packets and False TCP Retransmissions
Because Pktmon captures packets at multiple points within the Windows networking stack, converted PCAPNG captures may contain duplicate packets or misleading TCP retransmission indicators when opened in Wireshark.
This behavior is especially common on modern Windows servers using NIC offloading technologies such as Large Send Offload (LSO) or Receive Segment Coalescing (RSC).
More Limited Packet Analysis Capabilities
While Pktmon is excellent for capturing packets directly on Windows systems, its built-in analysis capabilities are much more limited compared to Wireshark.
Advanced protocol decoding, stream reconstruction, graphical statistics, deep inspection, VoIP analysis, and extensive filtering options are typically performed later in Wireshark after converting the capture into PCAPNG format.
Listing and Removing Existing Pktmon Filters
Before starting a new packet capture session with Packet Monitor, it is usually a good idea to first verify whether filters from previous capture sessions are still configured.
Existing filters can affect new captures and may lead to unexpected or incomplete results.
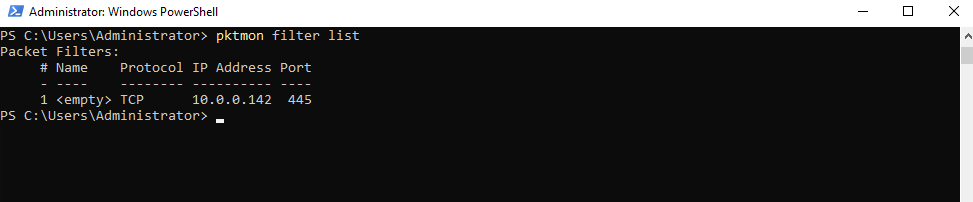
To display all currently configured filters, we can run the following command:
PS> pktmon filter list
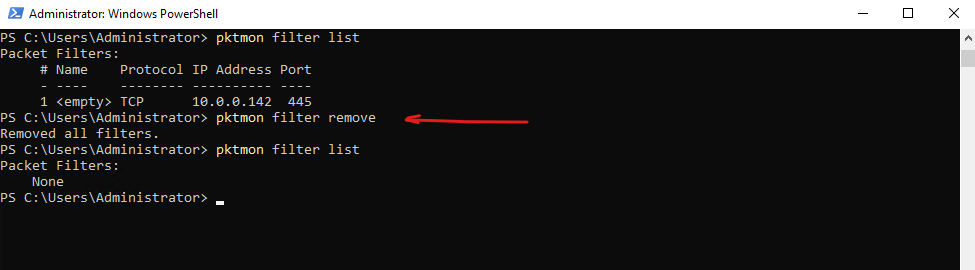
If existing filters are present, we can remove them and start with a clean filter configuration by running:
This ensures that only the newly configured filters are applied to the next packet capture session.
PS> pktmon filter remove
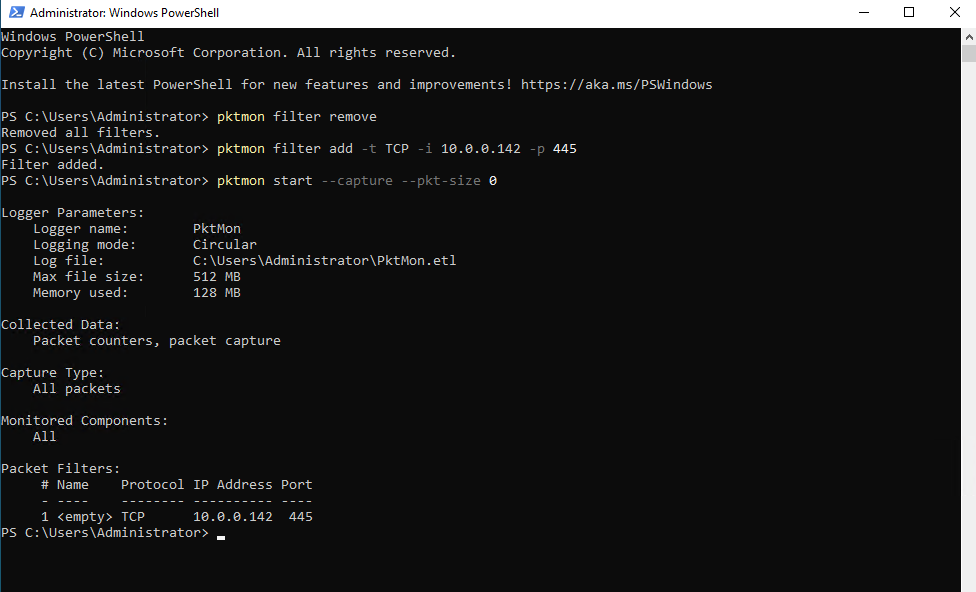
Capturing SMB (TCP 445) Traffic
In the example below, I was running all Packet Monitor commands directly on the domain controller 10.0.0.70 to capture SMB traffic from the client 10.0.0.142 on TCP port 445.
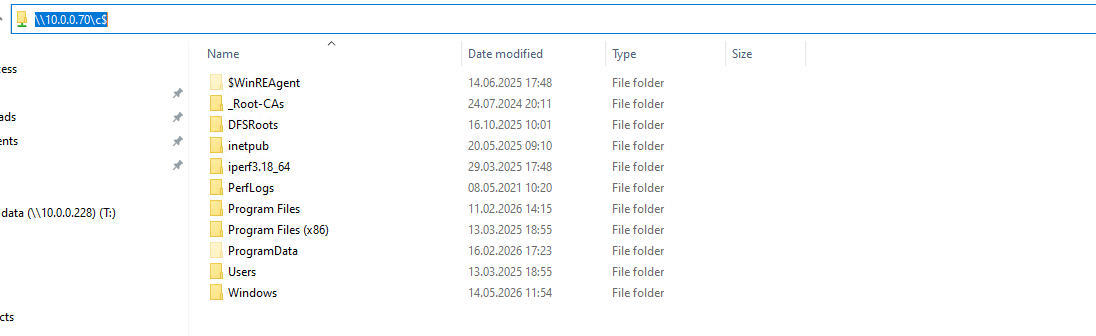
Afterwards, I accessed the administrative SMB share \\10.0.0.70\c$ on the domain controller from the client machine to generate matching SMB traffic and finally converted the ETL capture into PCAPNG format for later analysis in Wireshark.
Important: In
pktmon filter add, the-iparameter is used to filter by IP address, but it does not distinguish between source and destination.The
-tparameter is used to filter traffic by transport protocol, allowing you to capture only specific protocols such as TCP, UDP, ICMP, or ICMPv6.The
-dparameter does not mean destination IP; it is used for data-link protocol / EtherType filters such as IPv4, IPv6, or ARP.Source: https://learn.microsoft.com/en-us/windows-server/networking/technologies/pktmon/pktmon-syntax
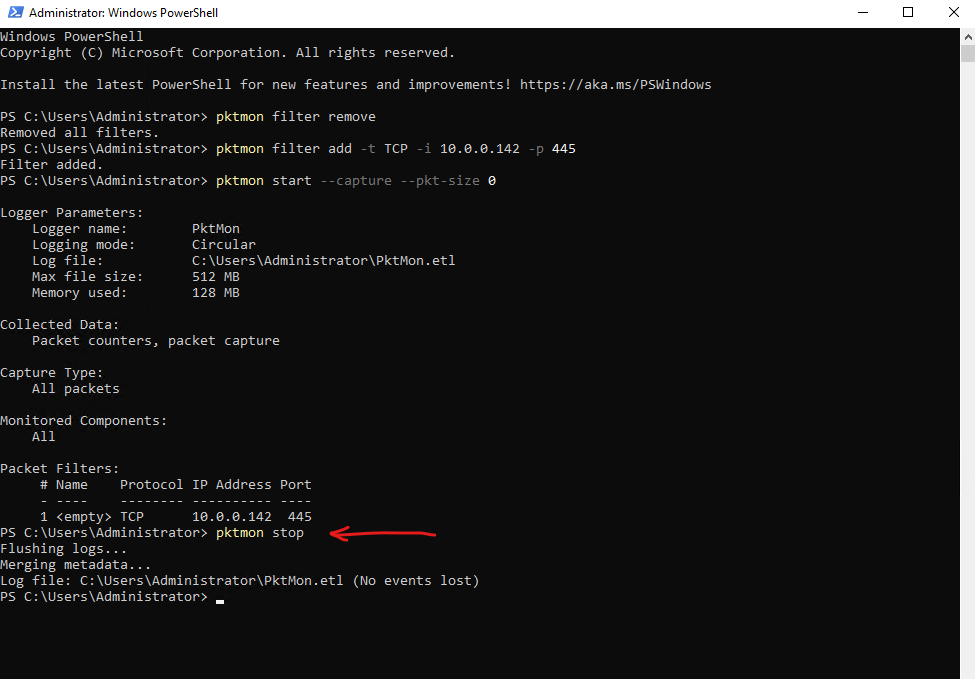
PS> pktmon filter remove
PS> pktmon filter add -t TCP -i 10.0.0.142 -p 445
PS> pktmon start --capture --pkt-size 0

# To capture multiple protocols and ports just add further filters e.g.:
PS> pktmon filter add -t TCP -i 10.0.0.142 -p 443
PS> pktmon filter add -t UDP -i 10.0.0.142 -p 53
Here I was accessing the administrative SMB share \\10.0.0.70\c$ on the domain controller from the client machine.
After reproducing the issue or generating the desired network traffic, we can stop the active capture session by running the following command:
This command stops the packet capture process and automatically writes the collected trace data into the
PktMon.etlfile, which can later be converted into readable text or PCAPNG format for further analysis.
PS> pktmon stop
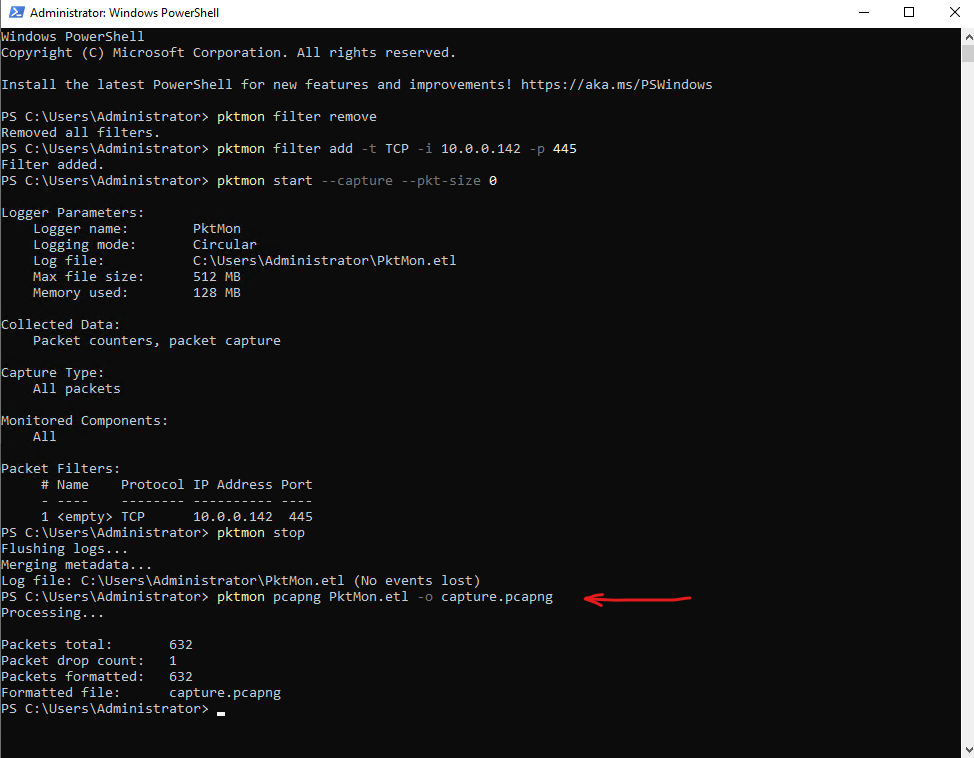
Finally, we can convert the native ETL capture file generated by Packet Monitor into the more commonly used PCAPNG format by running the following command:
The ETL format (
Event Trace Log) is Microsoft’s native event tracing format used internally by Windows and optimized for Event Tracing for Windows (ETW). In contrast, PCAPNG (Packet Capture Next Generation) is the industry-standard packet capture format that can be opened and analyzed with tools like Wireshark.
PS> pktmon pcapng PktMon.etl -o capture.pcapng
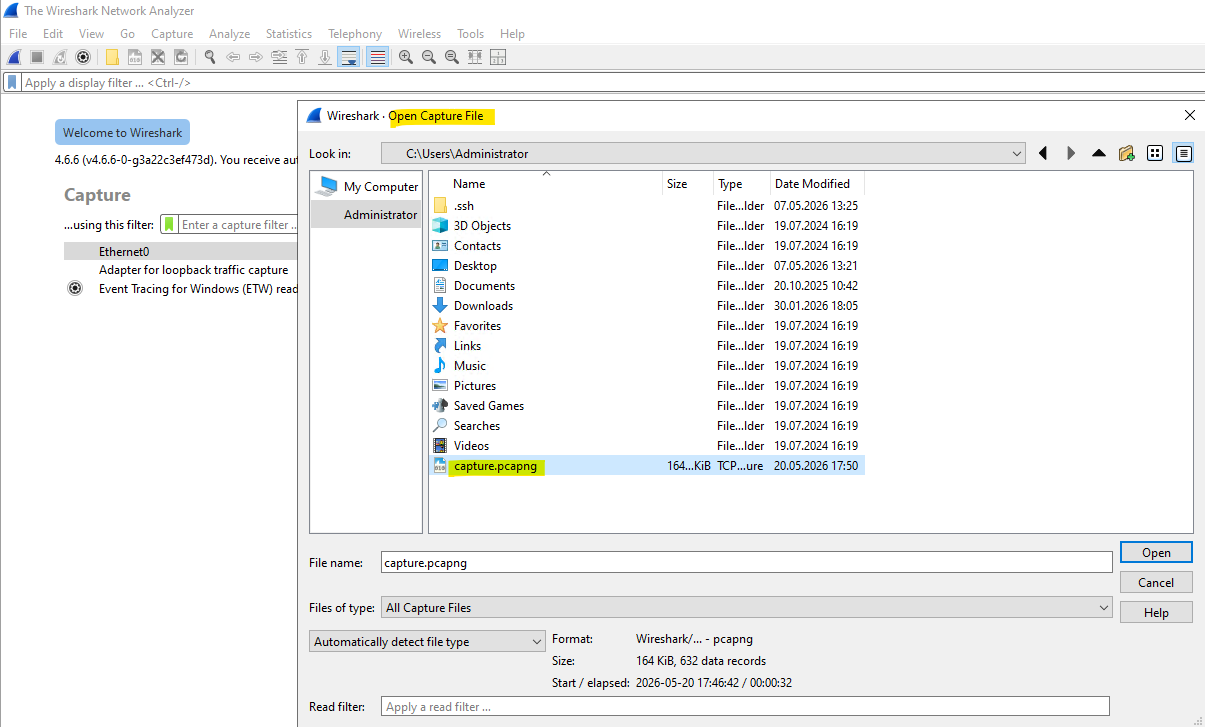
After converting the capture into PCAPNG format, we can open and analyze the file using Wireshark just like a regular network packet capture.
This allows us to inspect protocols, conversations, retransmissions, ports, IP addresses, and detailed packet contents using Wireshark’s advanced filtering and analysis capabilities.
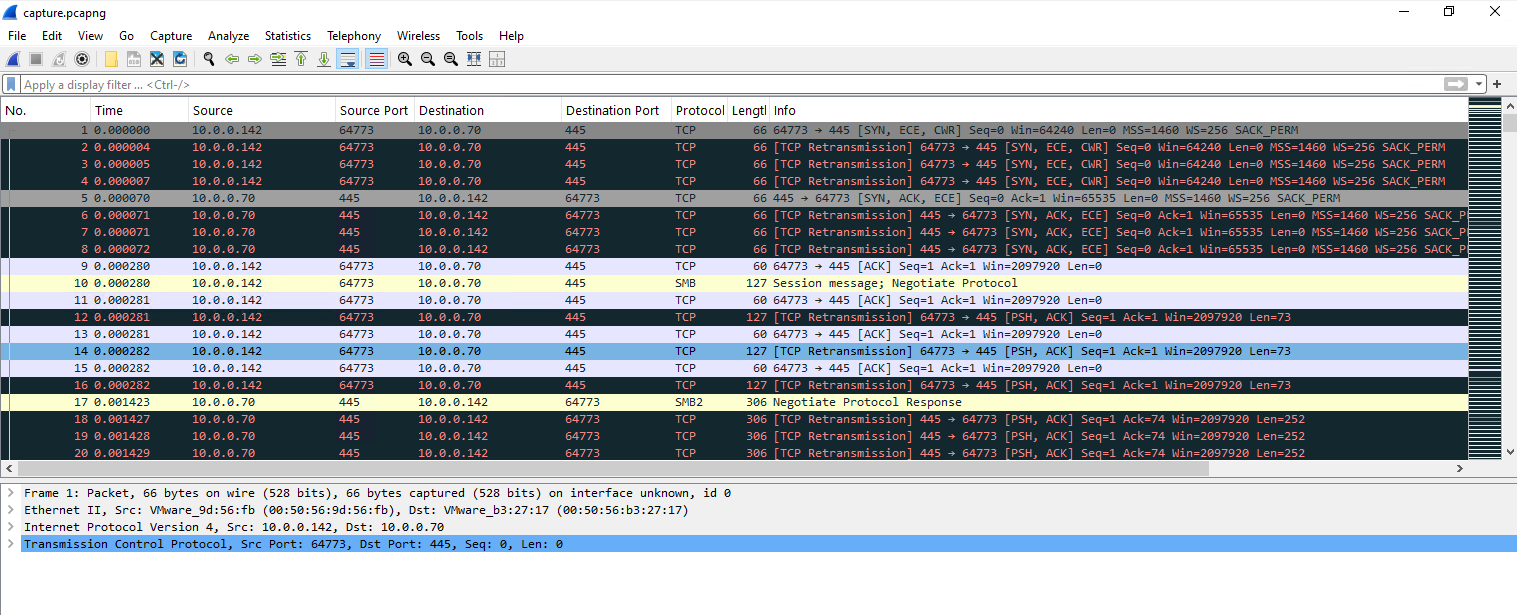
When opening the converted PCAPNG capture in Wireshark, you may notice a large number of TCP retransmission packets. In many cases, these are not caused by actual network problems or packet loss, but instead are artifacts caused by how Packet Monitor captures traffic through the Windows networking stack and how the ETL capture is later converted into PCAPNG format.
Modern NIC offloading features such as Large Send Offload (LSO) and Receive Segment Coalescing (RSC) can further contribute to these misleading retransmission indicators.
Below we will see some additional practical examples demonstrating how to use Packet Monitor for troubleshooting common network issues directly on Windows servers without installing third-party packet capture tools.
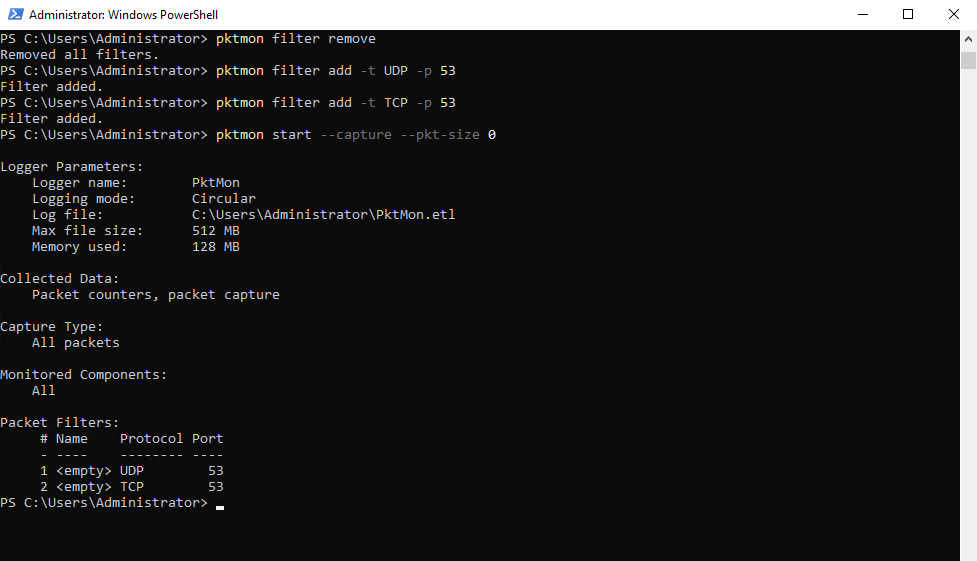
Capture DNS Traffic (UDP/TCP 53)
DNS primarily uses UDP port 53 for standard queries, but TCP port 53 is also used, for example with larger responses, zone transfers, or fallback scenarios. Therefore, when troubleshooting DNS resolution issues, it makes sense to capture both UDP and TCP traffic on port 53.
The command below I will also run on my domain controller which is also configure as DNS server on the clients.
Without using the
-iparameter (source IP or destination IP), the configured filter will capture matching traffic regardless of the source or destination IP address.
PS> pktmon filter remove
PS> pktmon filter add -t UDP -p 53
PS> pktmon filter add -t TCP -p 53
PS> pktmon start --capture --pkt-size 0
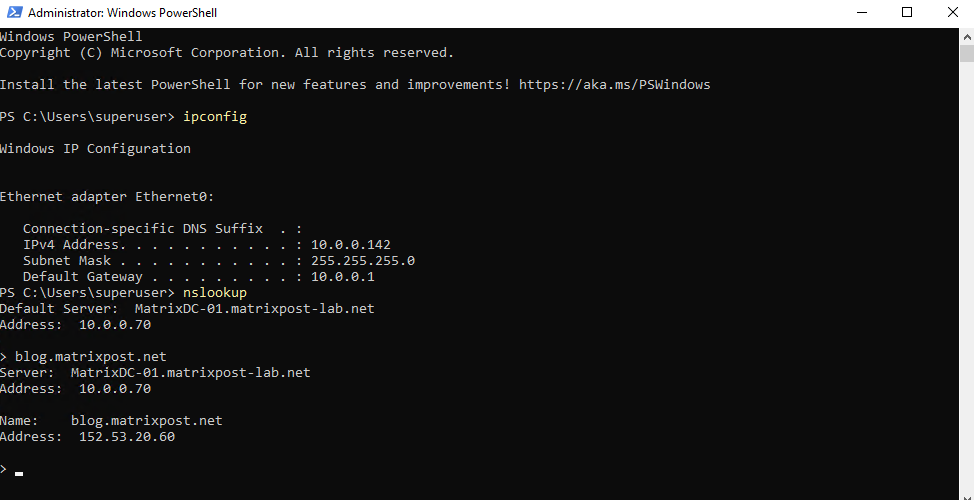
On the client machine, I generated DNS traffic by running an nslookup query against the FQDN of my blog to produce matching DNS requests and responses visible in the packet capture.
Afterwards we need to the stop the active capture session again.
PS> pktmon stop
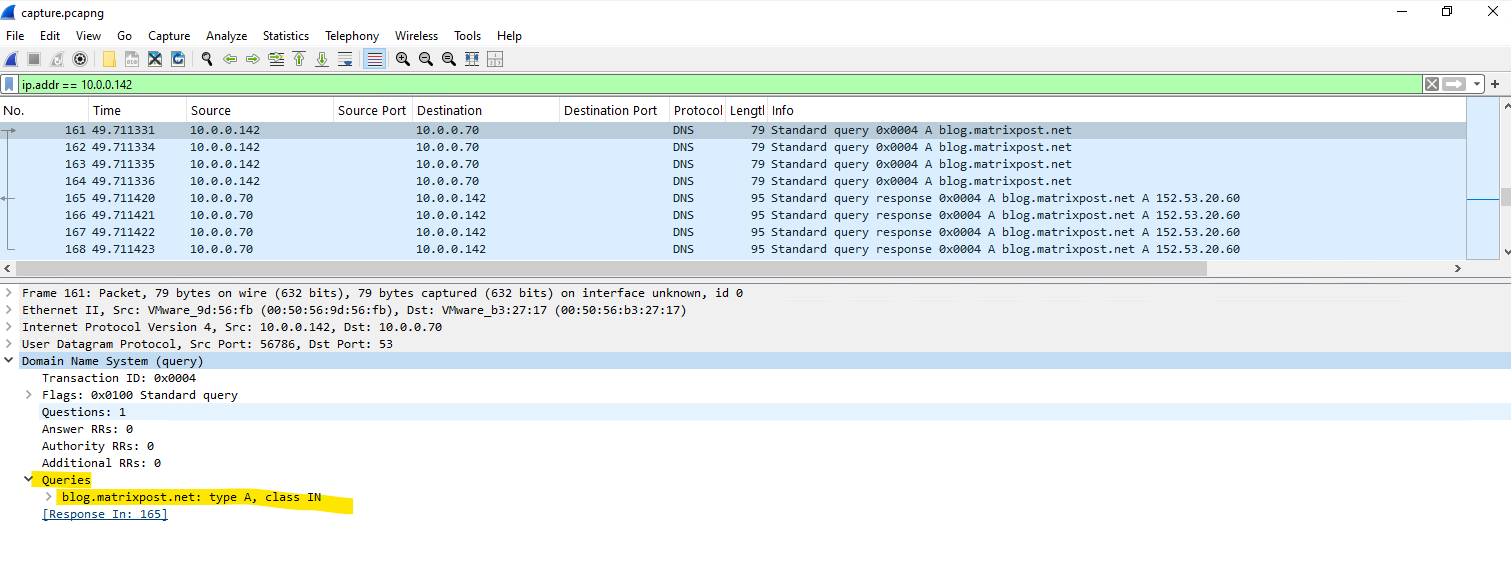
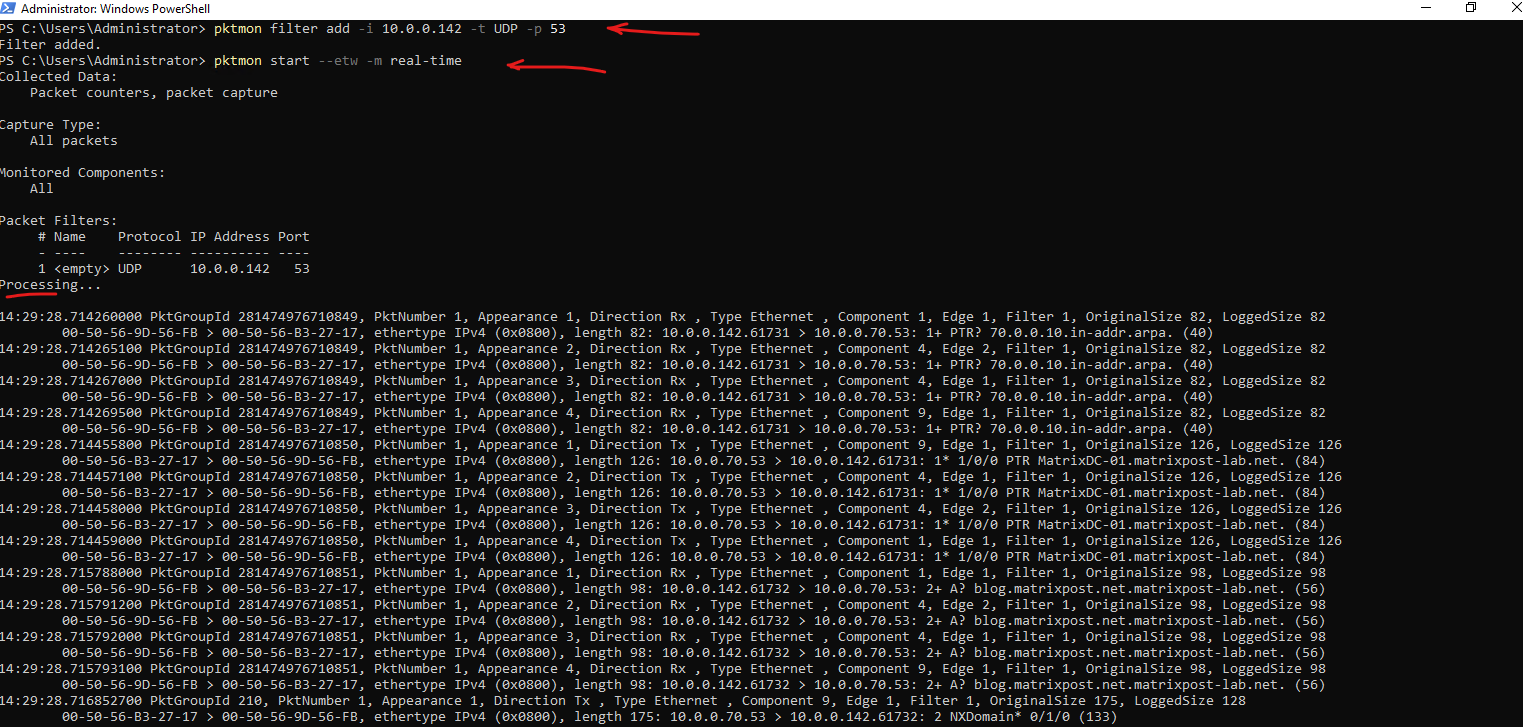
The following screenshot shows the DNS query request generated by the client while resolving the FQDN of my blog through the configured DNS server.
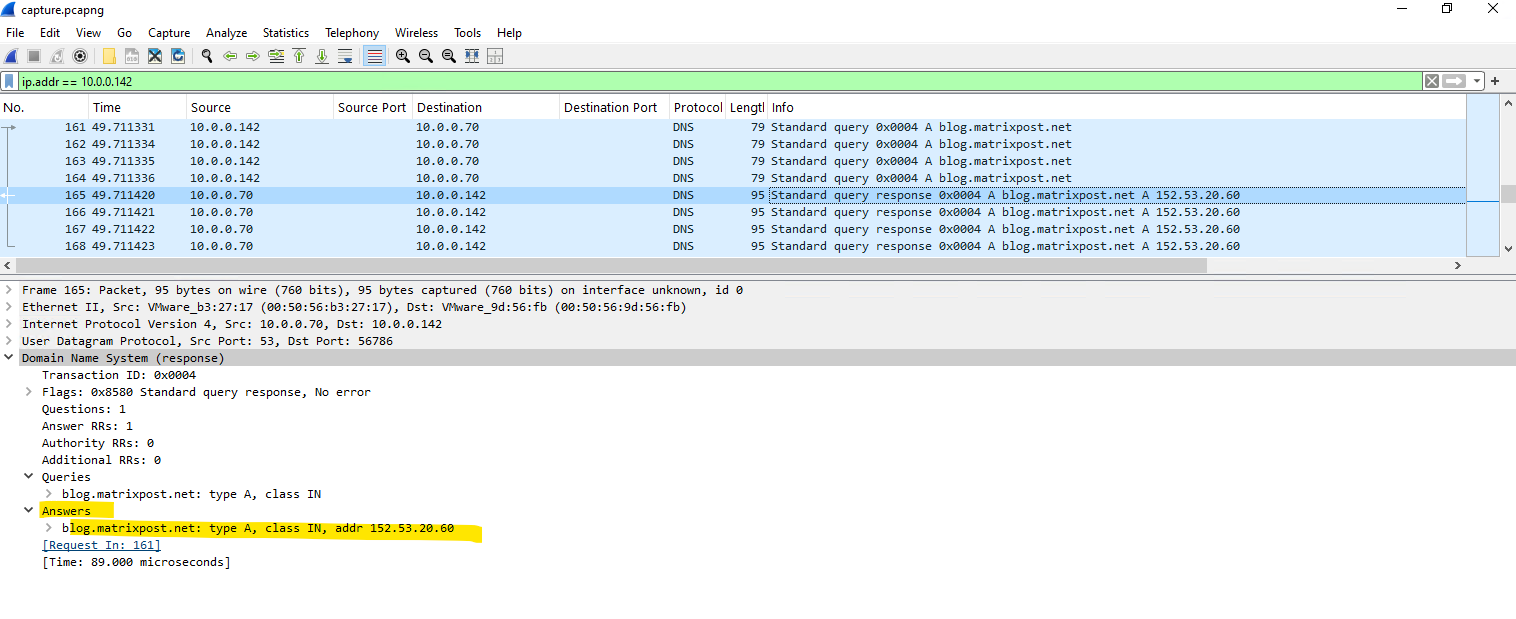
The next screenshot shows the corresponding DNS response returned by the DNS server, including the resolved IP address for the requested FQDN.
Capturing All Traffic for a Specific IP Address with PktMon
Packet Monitor allows you to filter packets by IP address, making it easy to monitor all traffic sent to or received from a specific system while reducing the amount of captured data.
Note that PktMon does not differentiate between source and destination IP addresses when using IP-based filters.
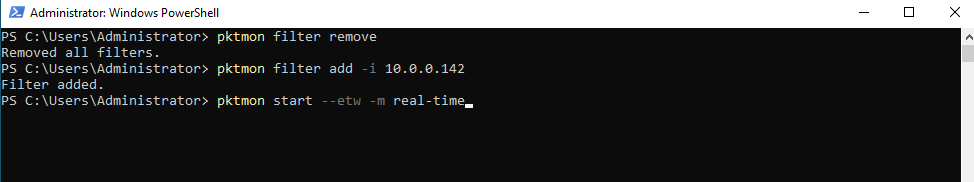
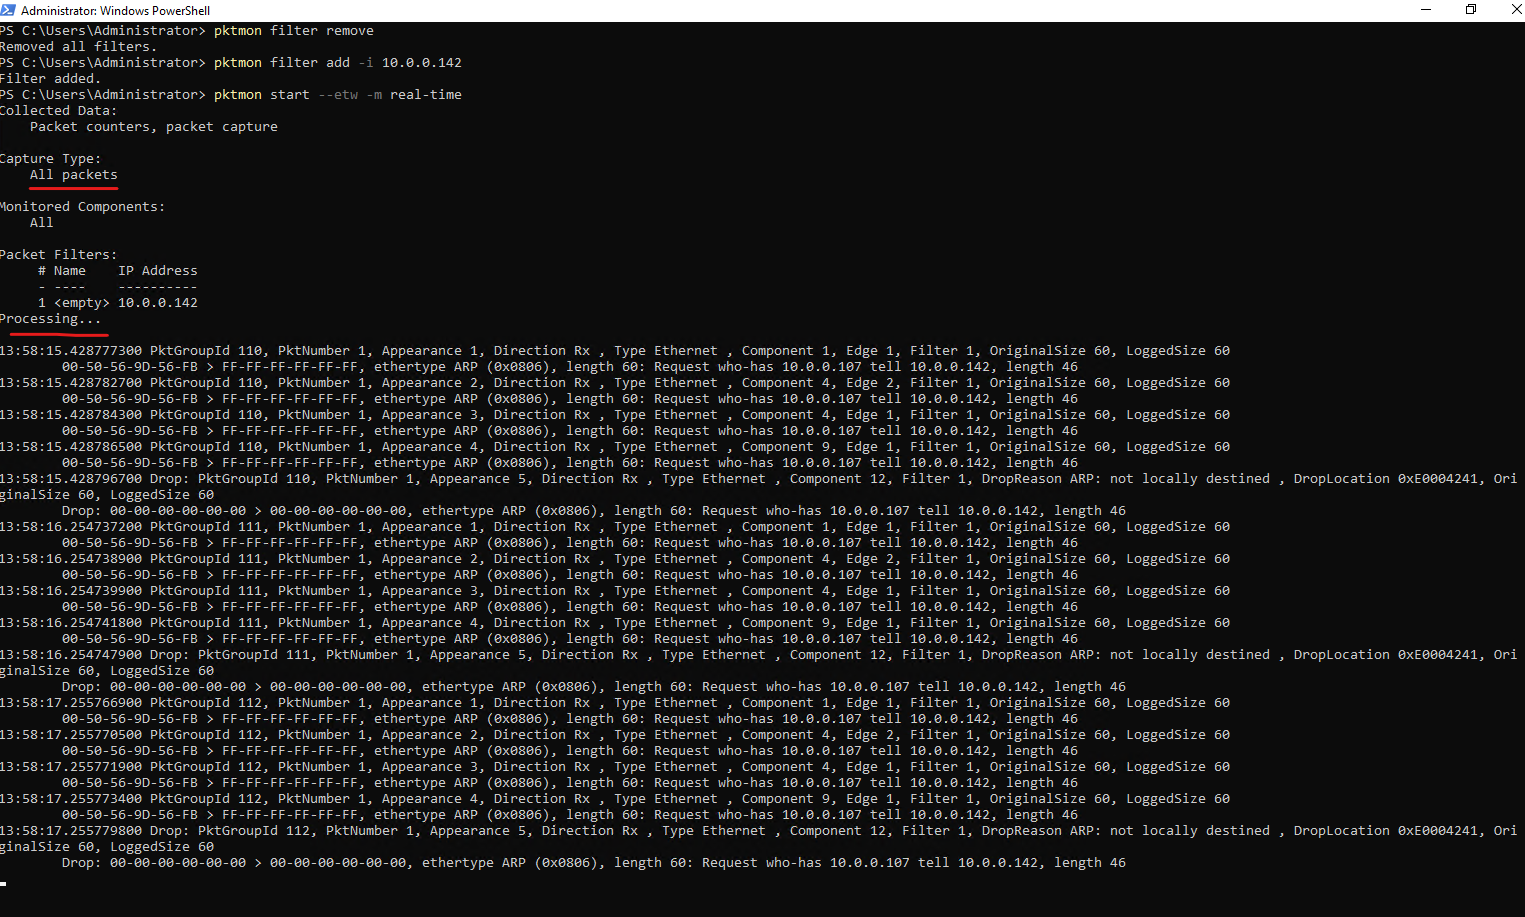
pktmon start --etw -m real-time starts Packet Monitor in real-time mode, displaying captured packets directly in the console as they are processed by the Windows networking stack. This is particularly useful for interactive troubleshooting because you can immediately observe network activity without first writing the capture to an ETL file and converting it afterwards.
By applying an IP-based filter such as
pktmon filter add -i 10.0.0.142, Packet Monitor captures all traffic associated with the specified host. Unless additional protocol (-t) or port (-p) filters are configured, packets of all protocols and ports involving the specified IP address are included in the capture.
PS> pktmon filter remove
PS> pktmon filter add -i 10.0.0.142
PS> pktmon start --etw -m real-time
Capturing ICMP Traffic
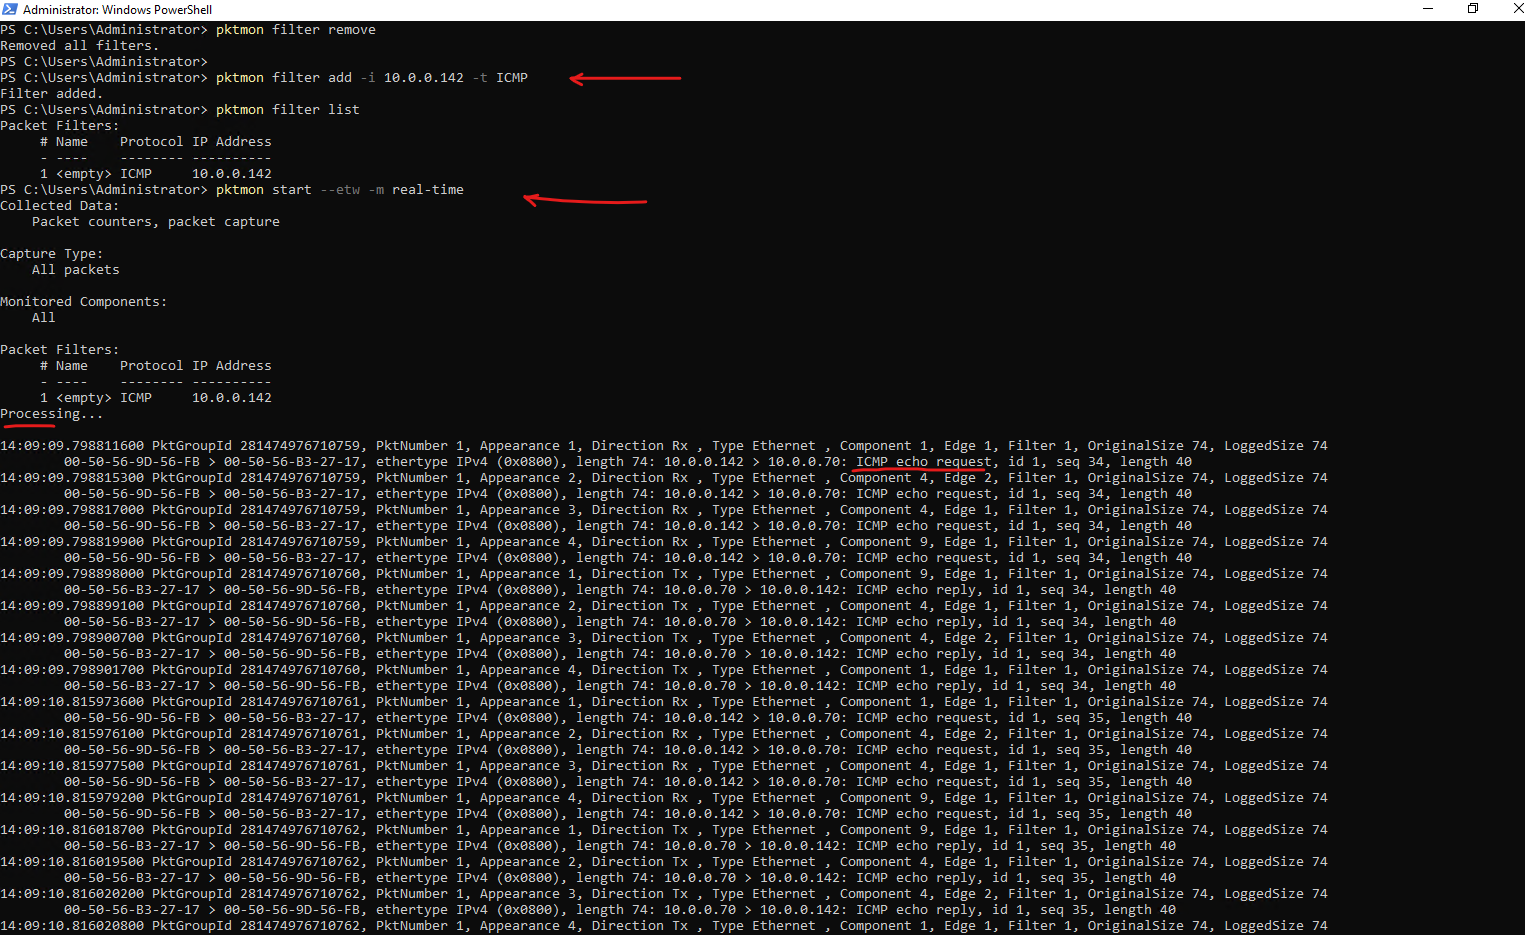
By combining an IP address filter with the ICMP protocol filter, Packet Monitor captures only ICMP packets associated with the specified host, making it easy to verify echo requests and echo replies without being distracted by unrelated network traffic.
In the example below, PktMon captures successful ICMP echo requests sent from 10.0.0.142 to 10.0.0.70 and the corresponding echo replies returned by the destination host.
PS> pktmon filter add -i 10.0.0.142 -t ICMP
PS> pktmon start --etw -m real-time
Determining whether Traffic uses TCP or UDP
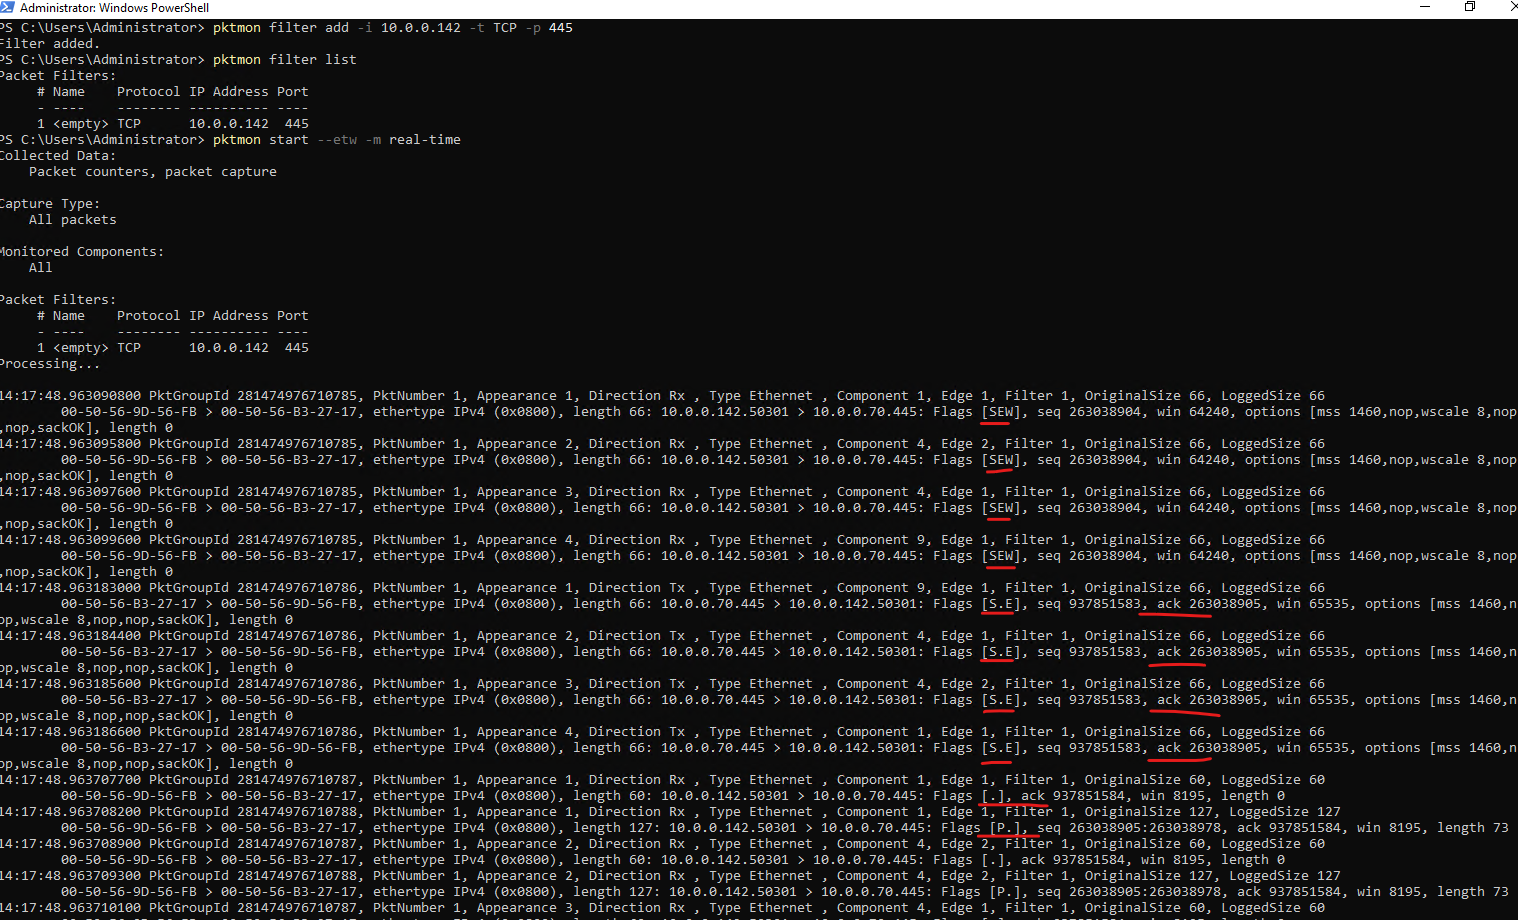
When analyzing network traffic with PktMon, it is often useful to determine whether an application is communicating over TCP or UDP. One of the easiest ways to identify TCP traffic is by examining the TCP flags displayed in the packet details. Common flags such as SYN, ACK, and PSH indicate that the captured packets belong to a TCP session, whereas UDP traffic does not contain connection-oriented flags and is typically displayed simply as UDP, length <n>.
In the example below, the presence of flags such as S (SYN), . (ACK), and P (PSH) clearly identifies the traffic as TCP. The captured packets also reveal the TCP three-way handshake, consisting of a SYN packet from the client, a SYN/ACK response from the server, and a final ACK from the client before application data is exchanged.
The TCP three-way handshake can be identified by the sequence of TCP flags: SYN (
S), SYN/ACK (S.), and ACK (.). Once the handshake is complete, application data is exchanged, typically indicated by packets containing the PSH (P) flag.
PS> pktmon filter add -i 10.0.0.142 -t TCP -p 445
PS> pktmon start --etw -m real-time
Unlike TCP, UDP does not use connection-oriented flags such as SYN, ACK, or FIN. Depending on the protocol being transported, PktMon may either display a generic
UDP, length <n>entry or decode and display the application protocol directly, as shown in the DNS examples below.
PS> pktmon filter add -i 10.0.0.142 -t UDP -p 53
PS> pktmon start --etw -m real-time
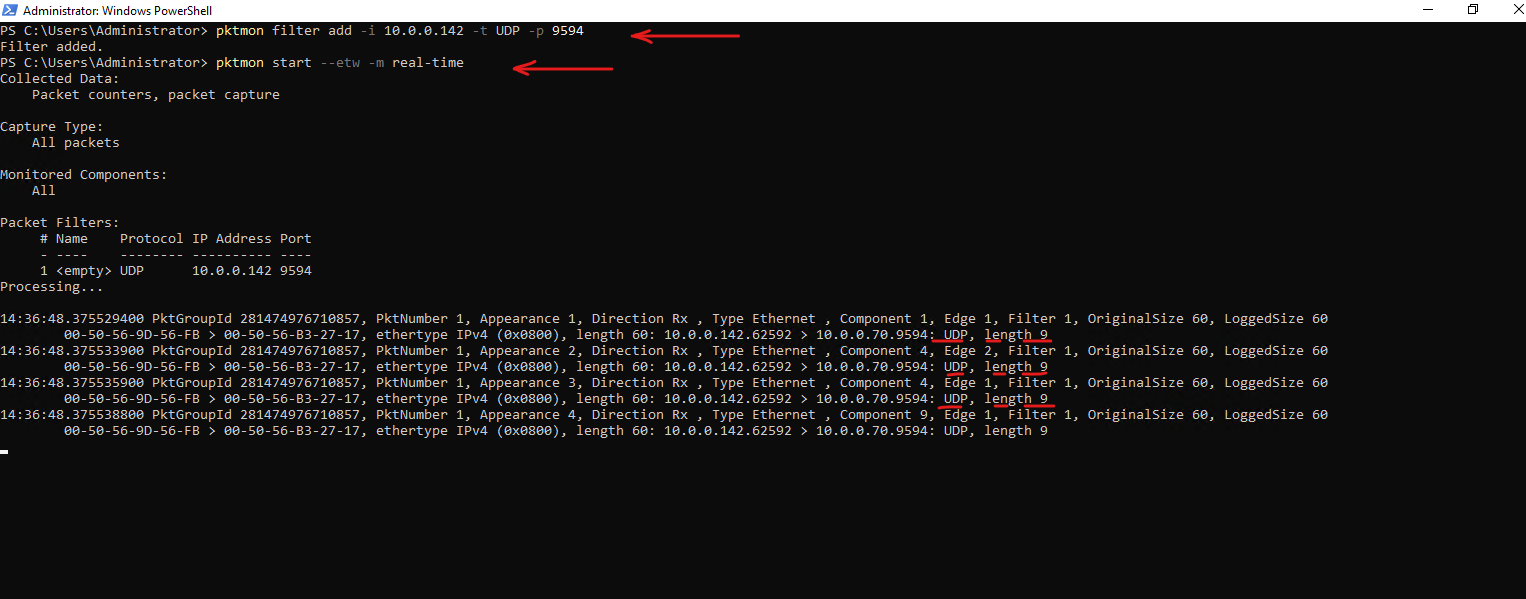
This capture shows UDP traffic from 10.0.0.142 to 10.0.0.70 on destination port 9594. Unlike TCP, there are no connection-oriented flags such as SYN or ACK; PktMon simply displays the packet as UDP, length 9, which confirms that the traffic is UDP.
PS> pktmon filter add -i 10.0.0.142 -t UDP -p 9594
pktmon start --etw -m real-time
Command-Line Help
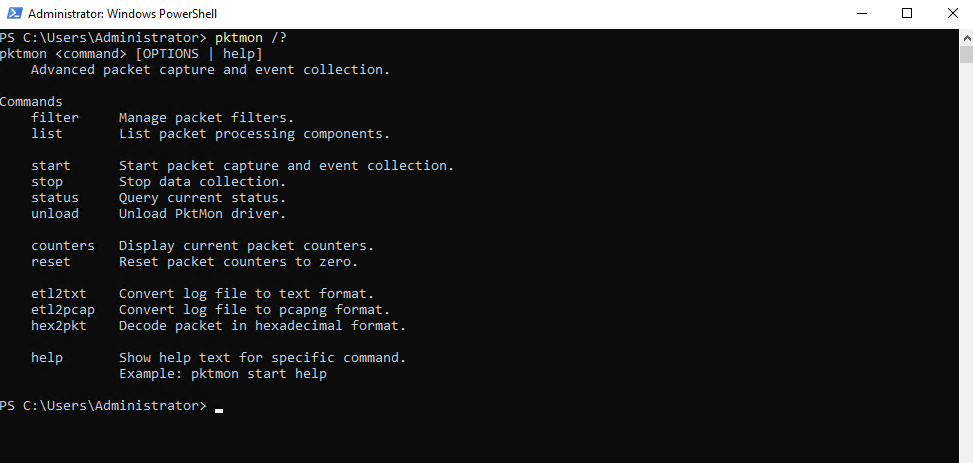
We can check command-line help for arguments and capabilities by running:
PS> pktmon /?
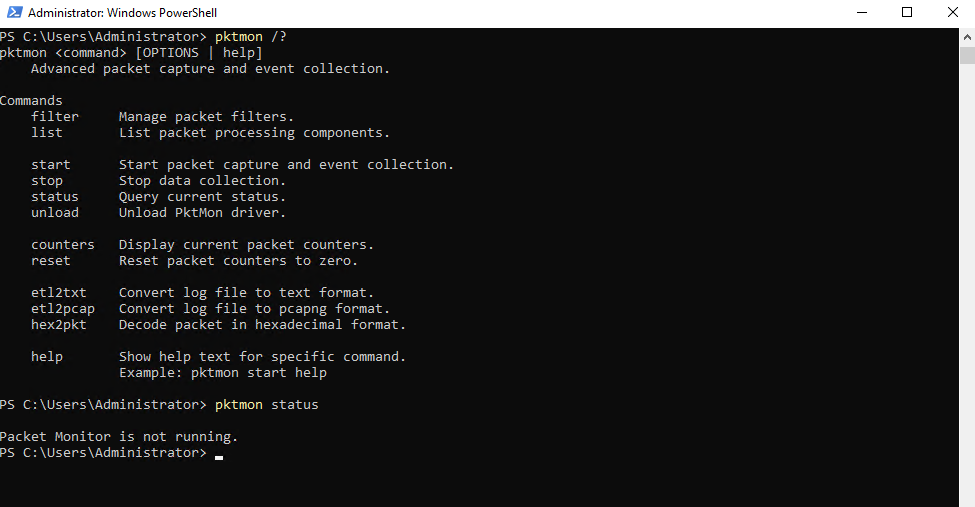
To check if Paket Monitor is running and capturing the network traffic curently we can ru:
PS> pktmon status
Links
Packet Monitor (Pktmon)
https://learn.microsoft.com/en-us/windows-server/networking/technologies/pktmon/pktmonIntroducing Packet Monitor
https://techcommunity.microsoft.com/blog/networkingblog/introducing-packet-monitor/1410594/replies/2392949?utm_source=chatgpt.comPktmon command formatting
https://learn.microsoft.com/en-us/windows-server/networking/technologies/pktmon/pktmon-syntax