Understanding NetApp ONTAP Logging – Exploring EMS Events and the ONTAP Event Log
NetApp ONTAP continuously records what is happening inside the storage system. Hardware events, cluster operations, protocol activities, and even cloud provider actions for Cloud Volume ONTAP (CVO) systems are all captured through the Event Management System (EMS).
Overview of ONTAP Logs
NetApp ONTAP records a wide range of system activities through different logging mechanisms that help administrators monitor, troubleshoot, and audit system behavior.
The most relevant logs for administrators are generated by the Event Management System (EMS), which captures important events occurring within the cluster and can forward them to external systems such as syslog servers for monitoring.
In addition to EMS, ONTAP maintains administrative audit logs that record management operations performed on the system. These logs capture details such as the executed command or API request, the user who initiated it, the access method used, and the timestamp of the action.
Audit logging applies to CLI commands, ONTAP APIs, and HTTP requests, providing a detailed record of configuration changes and administrative activity.
Both EMS and audit logs are stored locally on each node and are also included in AutoSupport reports, allowing NetApp support to analyze system events when troubleshooting issues. The logs are typically located under /mroot/etc/log and /mroot/etc/log/mlog, which contain various system and application logs generated by ONTAP components.
Source: https://kb.netapp.com/on-prem/ontap/Ontap_OS/OS-KBs/Overview_of_ONTAP_Logs
How to search the event (EMS) log in ONTAP
The Event Management System (EMS) log in NetApp ONTAP can be inspected directly from the CLI using the event log show command. Since a busy cluster may generate a large number of events, ONTAP provides several filtering options that allow administrators to quickly locate relevant log entries based on time, severity, node, or message name.
The following examples demonstrate how EMS events can be filtered to focus on specific system activities or troubleshooting scenarios.
To search for any EMS event that contains the word disk:
cluster01::> event log show -event *disk*
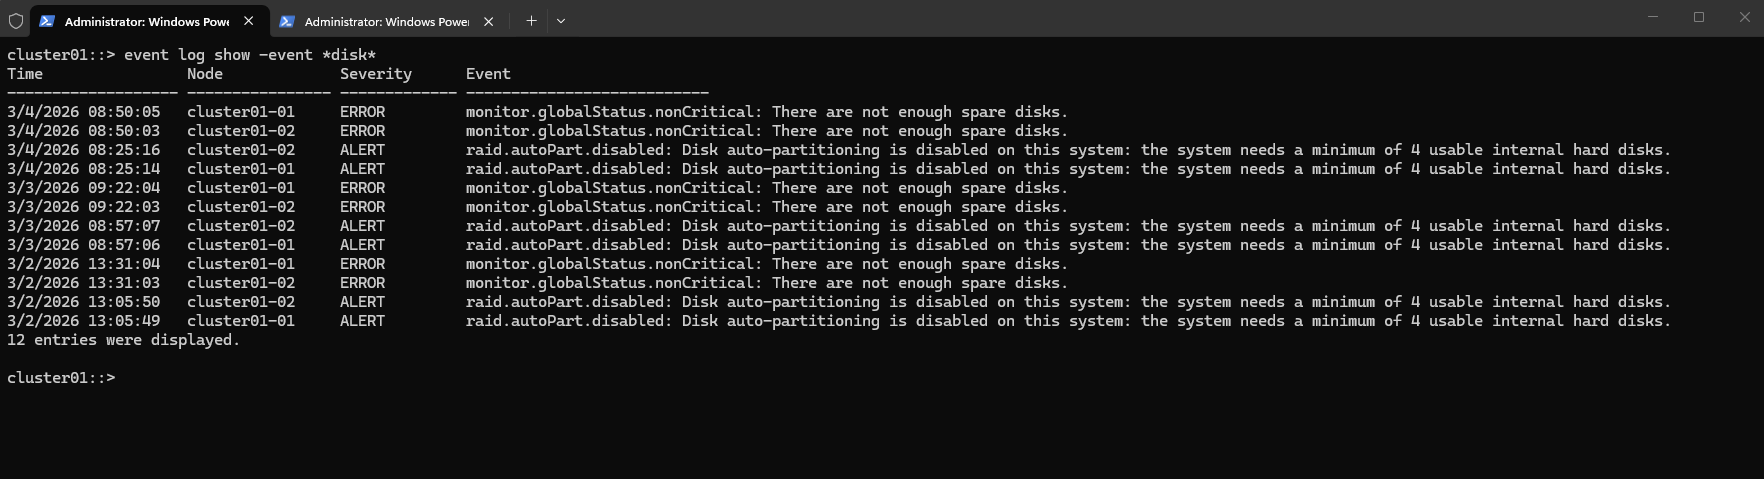
Note: The search string is case sensitive.
cluster01::> event log show -event *"Completed block"*
These are the possible entries for the severity field:
- EMERGENCY
- ALERT
- CRITICAL
- ERROR
- WARNING
- NOTICE
- INFORMATIONAL
- DEBUG
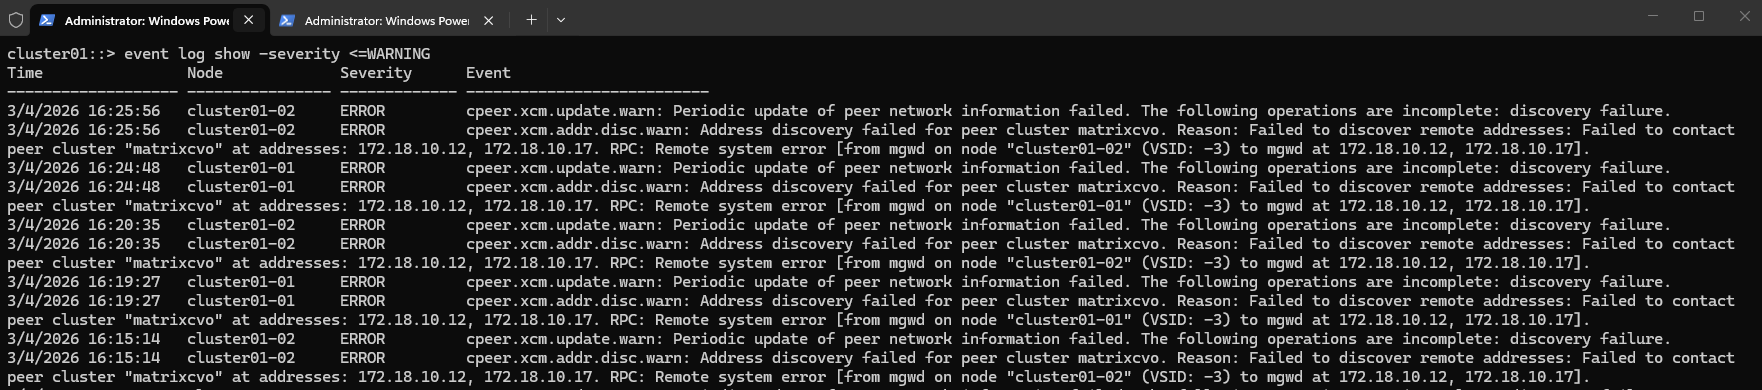
Any event with a severity of warning or higher
cluster01::> event log show -severity <=WARNING
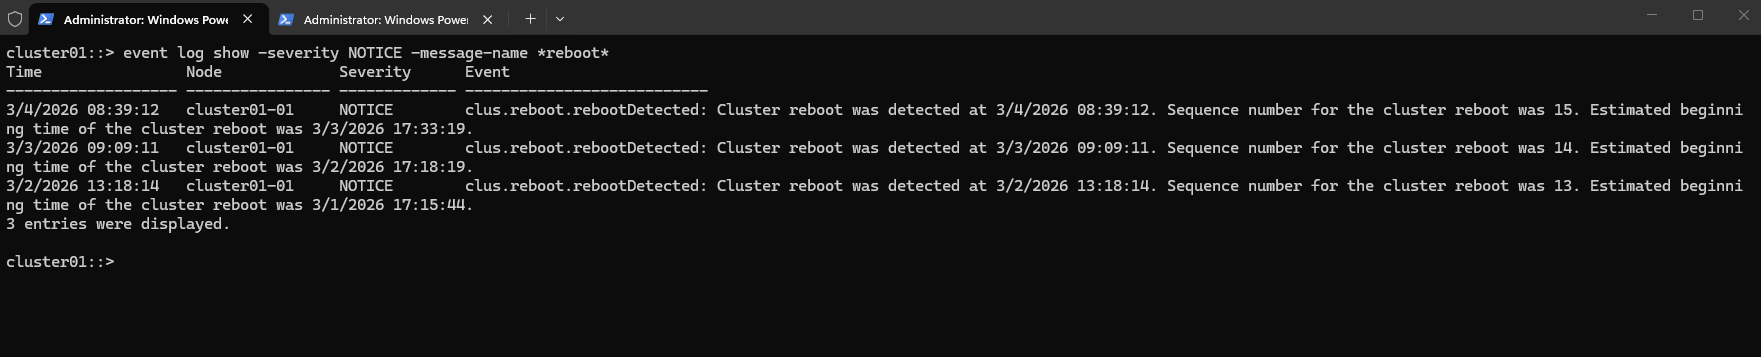
Any event with a severity of NOTICE and where the message name contains reboot.
This helps identify system reboot events, including node reboots triggered by maintenance operations (Cloud CVO systems), failovers, or other system activities.
In NetApp ONTAP the message-name is the internal identifier of the EMS event, but when you display the log with
event log show, it appears in the Event column.
cluster01::> event log show -severity NOTICE -message-name *reboot*
For example, the Azure scheduled maintenance event vsa.scheduledEvent.scheduled can be filtered directly using the -message-name parameter.
cluster01::> event log show -time >4h -message-name vsa.scheduledEvent.scheduled
2/27/2026 09:18:00 matrixcvo-01 ALERT vsa.scheduledEvent.scheduled: Cloud provider event scheduled from: Platform, out: 9 for node "matrixcvo-01". ID: 0FBFADE4-C6FA-461A-80B2-8B31AB57A61D. Type: freeze. Not before: 2/27/2026 09:32:29.

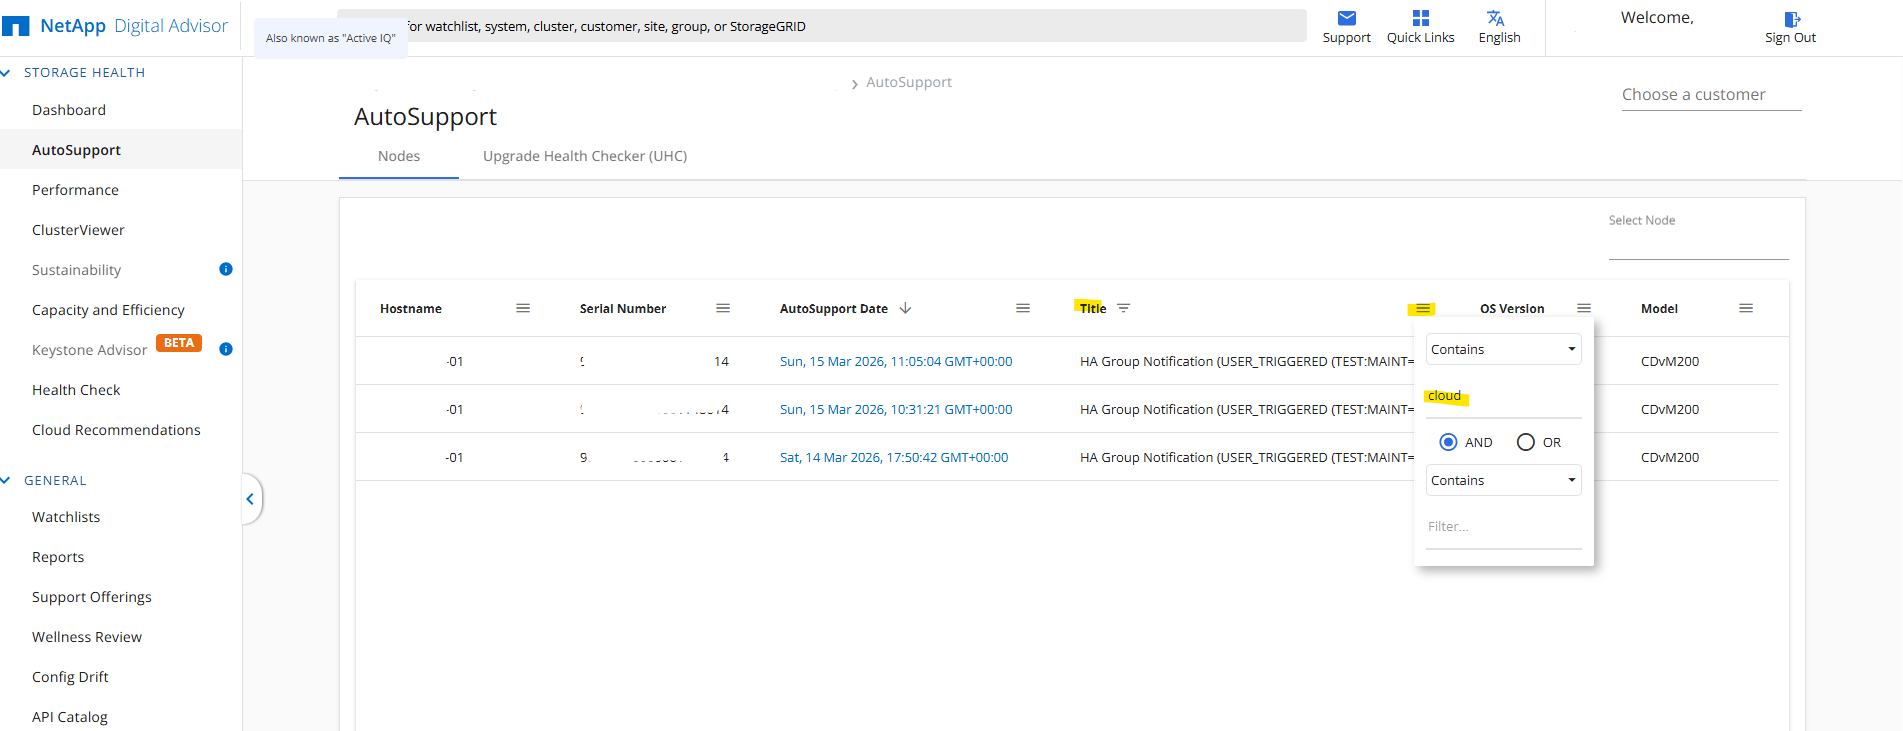
If the event is already some time in the past, the local EMS log may no longer contain the relevant entry, even with a log rotation size of 80 MB, where retention is often limited to roughly the last 24 hours depending on how chatty the system is. In such cases, AutoSupport can still be very useful, as the message history and subjects often preserve the trigger and timeline of important events, provided AutoSupport is enabled and properly configured.
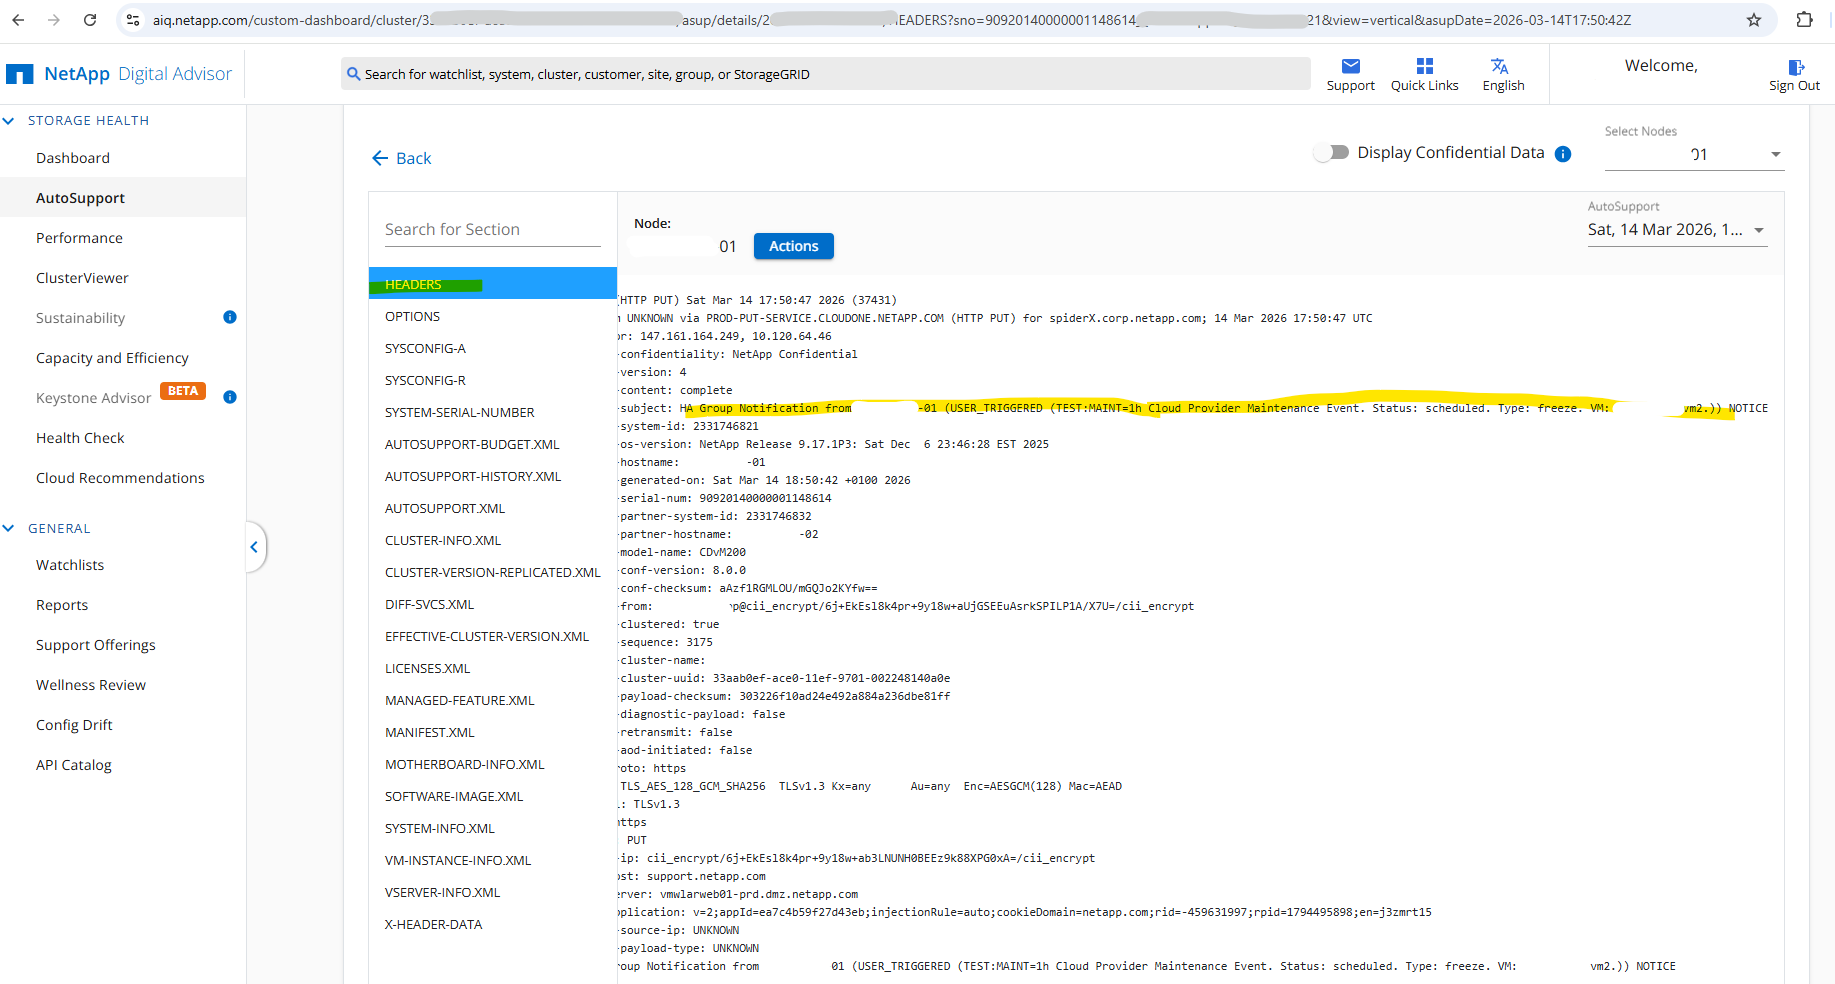
We can filter here the Title column to search for a specific event like Cloud Provider Event.
Back to our ONTAP EMS logs.
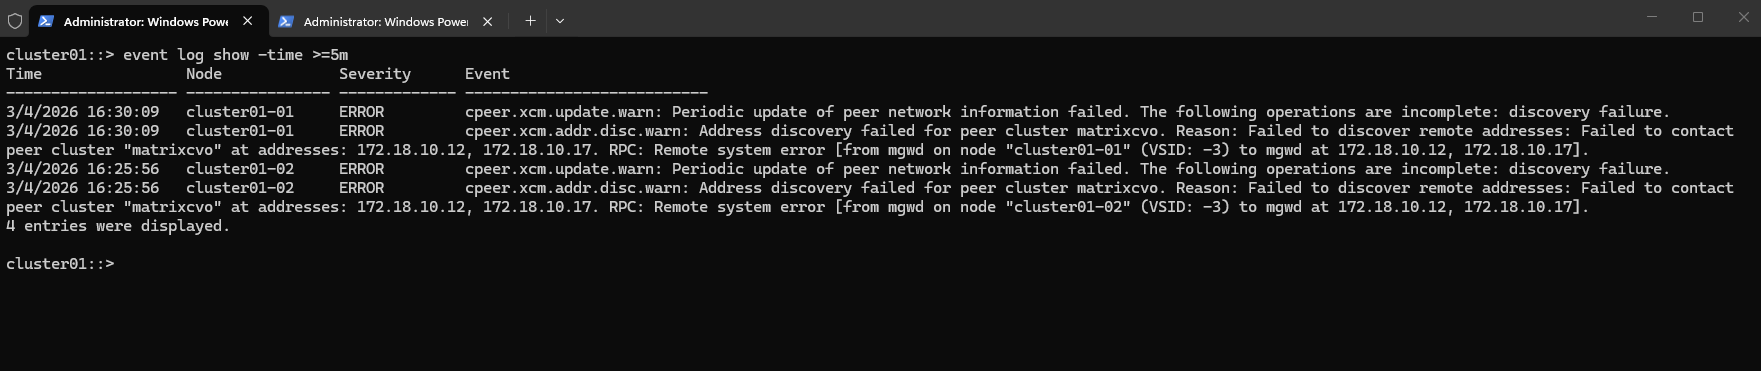
Events in the last 5 minutes.
cluster01::> event log show -time >=5m
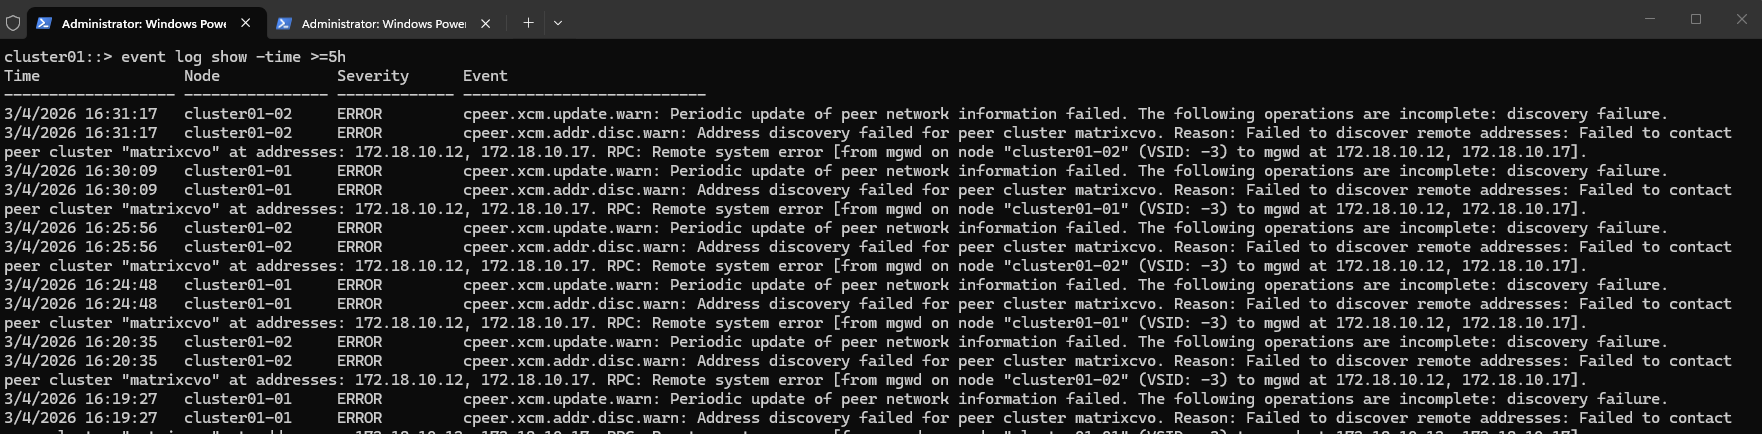
Events in the last 5 hours.
cluster01::> event log show -time >=5h
When specifying a specific time, it should be in the following format: MM/DD/YYYY HH:MM:SS
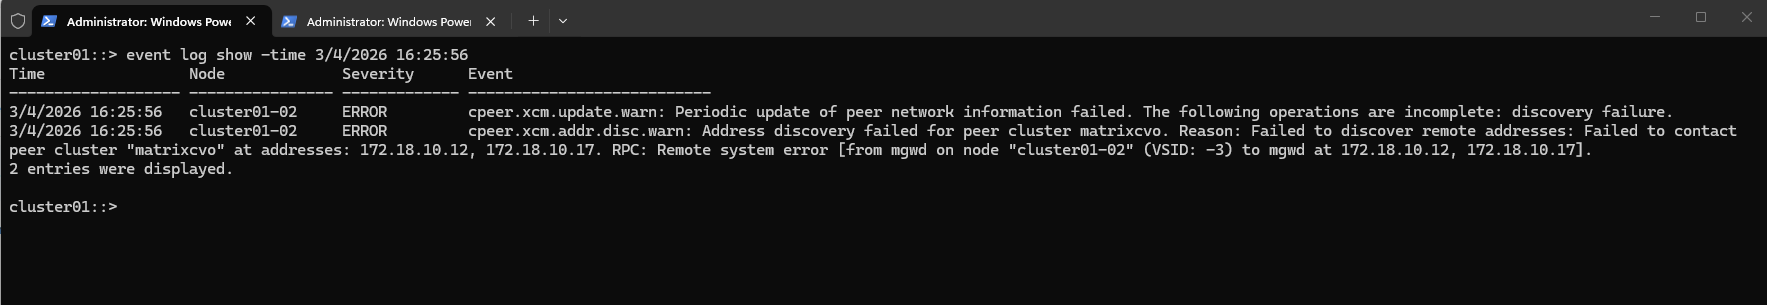
Events at a specific time.
cluster01::> event log show -time 3/4/2026 16:25:56
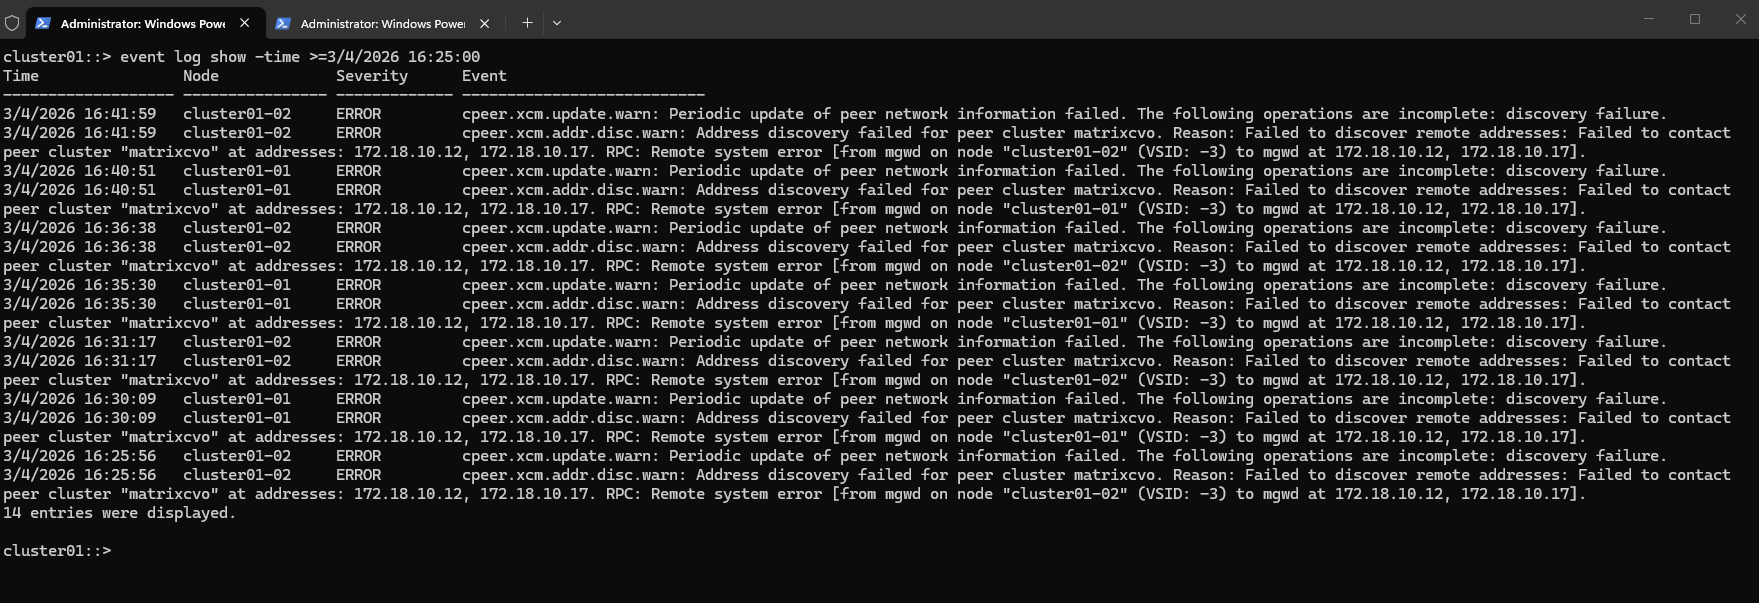
These periodic peer network information update failed messages in the output above appear because the cluster peer was already removed. The peer previously pointed to my NetApp Cloud Volumes ONTAP (CVO) system in Azure, which I had already offboarded.
About how to setup this hybrid replication with SnapMirror you can read my following post.
Events since a specific time. It should be in the following format: MM/DD/YYYY HH:MM:SS
cluster01::> event log show -time >=3/4/2026 16:25:00
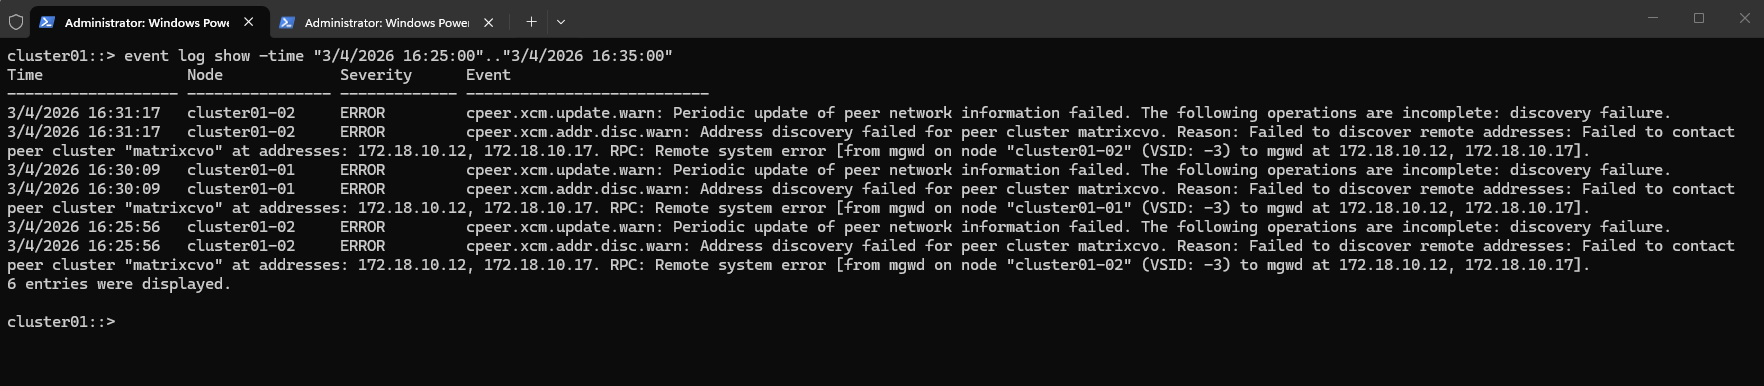
Events in a specific time range. It should be in the following format: MM/DD/YYYY HH:MM:SS
cluster01::> event log show -time "3/4/2026 16:25:00".."3/4/2026 16:35:00"
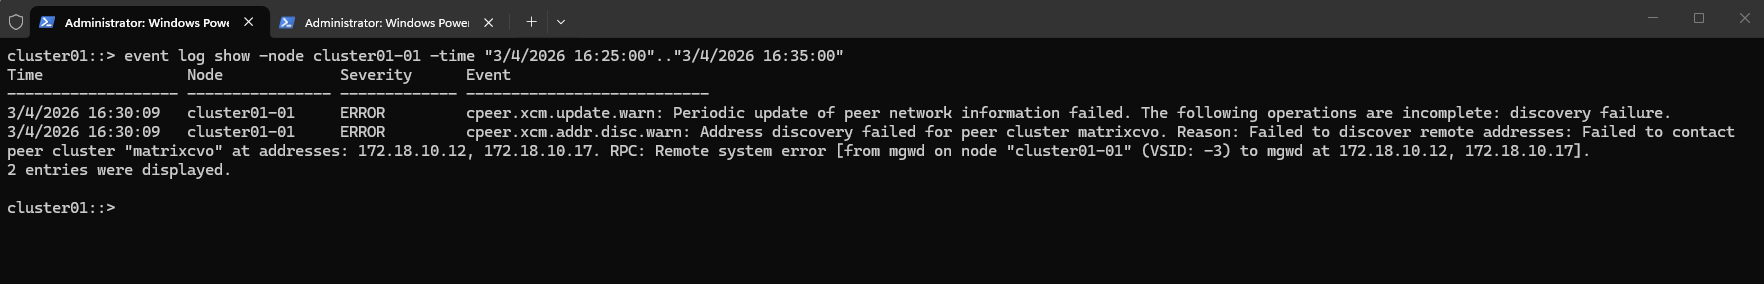
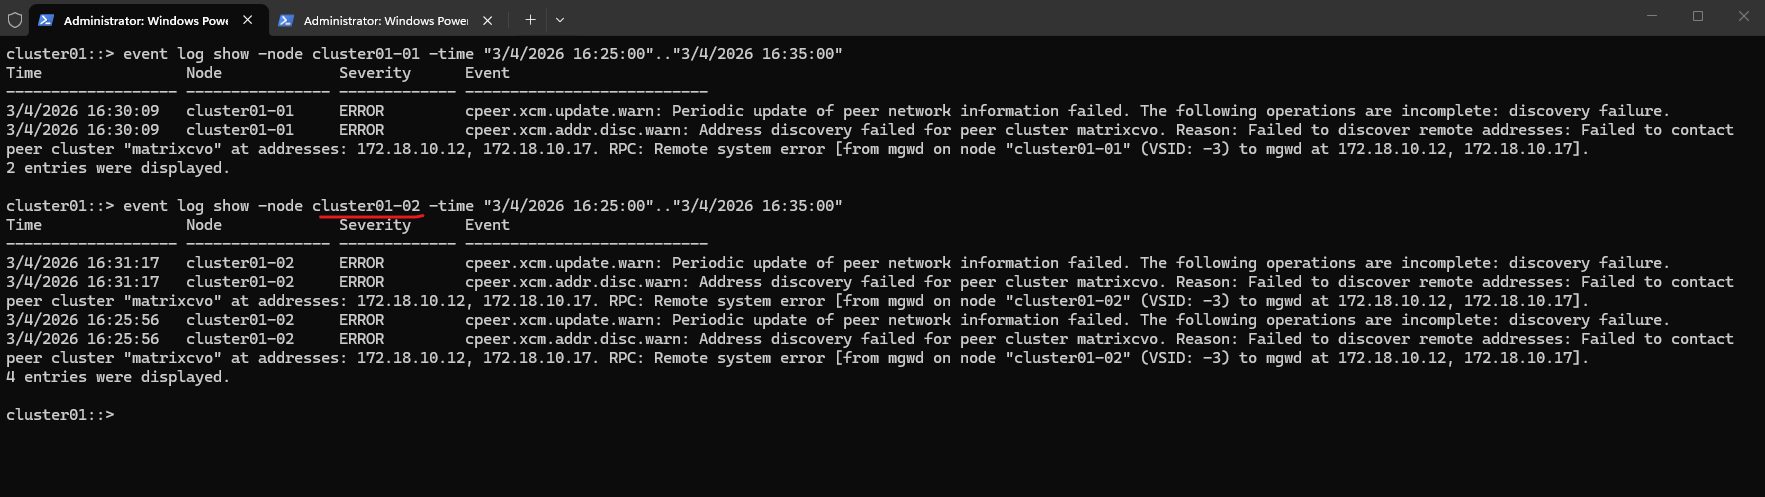
We can also search for events only from node 1 or node 2 in the cluster. It should be in the following format: MM/DD/YYYY HH:MM:SS
cluster01::> event log show -node cluster01-01 -time "3/4/2026 16:25:00".."3/4/2026 16:35:00"
Source: https://kb.netapp.com/on-prem/ontap/Ontap_OS/OS-KBs/How_to_search_the_event_log_in_ONTAP
Adjusting EMS Log Rotation Size (Advanced / Diagnostic Mode)
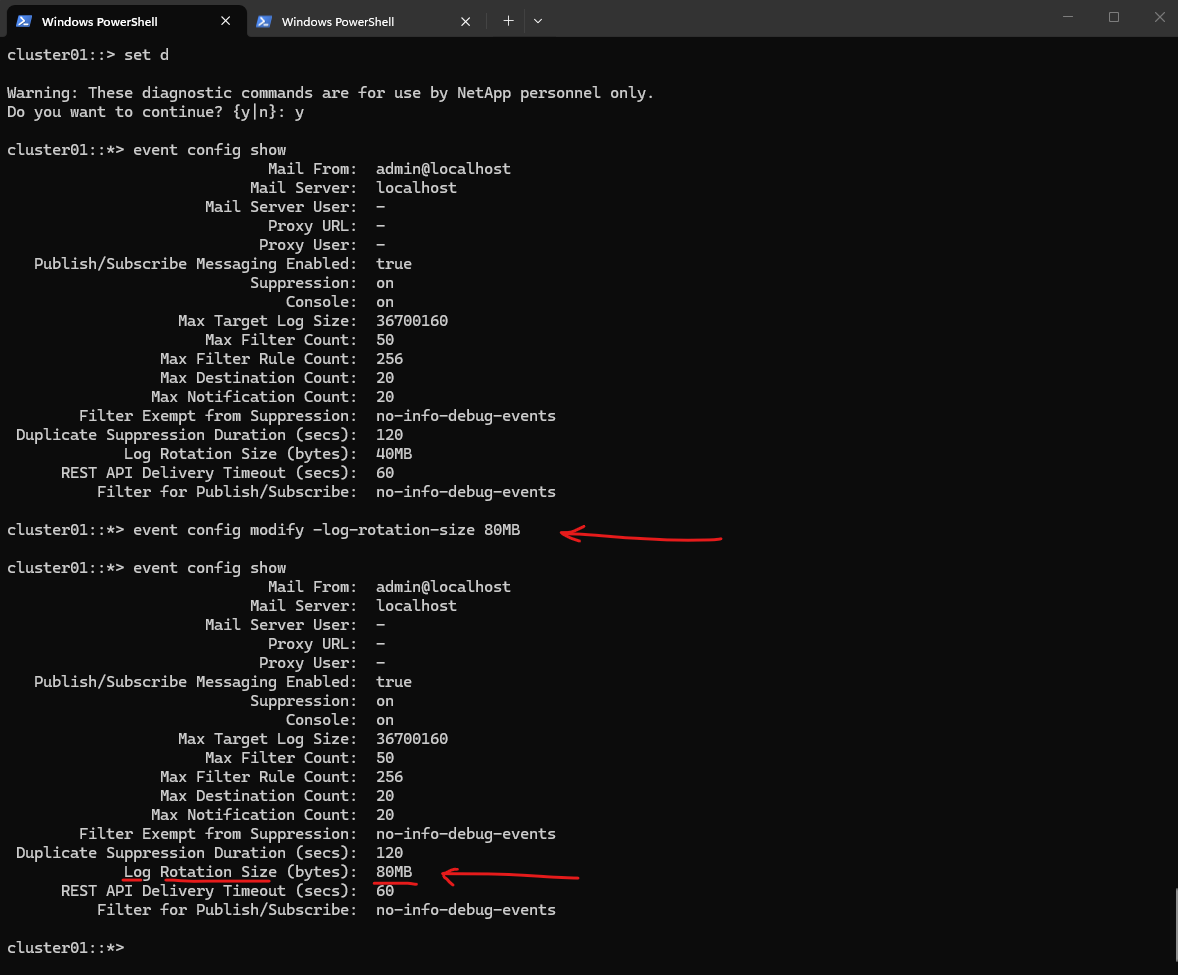
ONTAP automatically rotates EMS log files to prevent them from growing indefinitely. In diagnostic mode, administrators can adjust the maximum log file size before rotation occurs. The following command increases the EMS log rotation threshold to 80 MB, allowing more events to be retained in a single log file before a new one is created.
EMS events follow the syslog standard because they have the ability to be forwarded to a syslog server for real-time monitoring and because EMS events are the most relevant events to an administrator. They will also be sent in Autosupport.
The rest of the logs generated by the ONTAP operating system are generated from user-space applications that are constantly logging their activity. These logs are lower level and not targeted for administrators, but are mostly utilized by NetApp Support, development, and QA.
The EMS.log is rotated based on the config below.
cluster01::> set d
cluster01::*> event config show
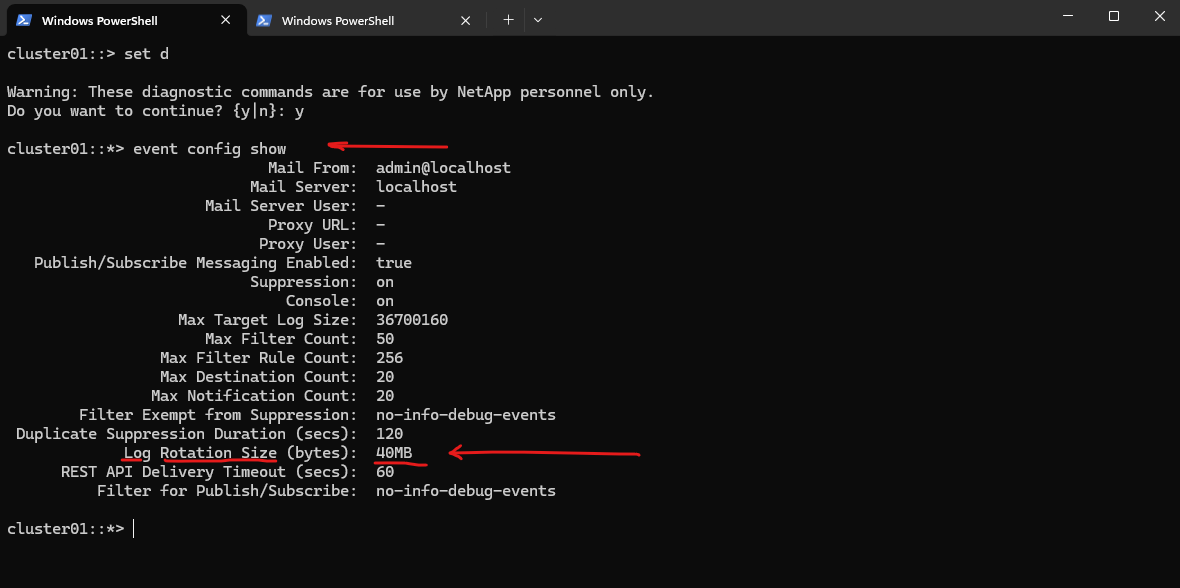
The default value can be modified, if necessary. The maximum size is 100MB:
So increasing the rotation size is essentially the only way to extend how far back EMS logs go on a system.
cluster01::*> event config modify -log-rotation-size 80MB
Source: https://kb.netapp.com/on-prem/ontap/Ontap_OS/OS-KBs/Overview_of_ONTAP_Logs
Publish/Subscribe Messaging Enabled: Enables the EMS pub/sub framework, allowing external systems (like monitoring tools or REST clients) to subscribe to events in near-real time.

Suppression: Controls duplicate-event suppression. When enabled, repeated identical EMS events within a short period are suppressed to prevent log flooding.

Max Target Log Size: This defines the maximum size of the in-memory EMS log buffer used for event targets (like syslog, mail, or other destinations). When the buffer reaches this limit, events are flushed/written to the configured destination or log target. It does not control log file rotation.

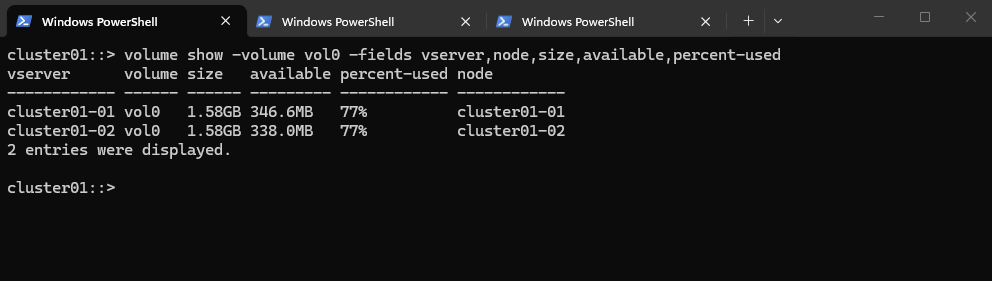
Since EMS logs are stored on the node root volume (vol0), available space should be verified before increasing the rotation size.
In most production environments this is not an issue, as the root volume typically has ample free capacity and EMS logs consume only a very small amount of space.
In my on-prem lab using the ONTAP Simulator running on VMware vSphere, the node root volumes (
vol0) are significantly smaller than in real production systems.While productive systems typically have hundreds of gigabytes available on
vol0, the simulator provides only about 1.5 GB, which means available space must be considered more carefully when adjusting settings such as EMS log rotation.
cluster01::> volume show -volume vol0 -fields vserver,node,size,available,percent-used
Links
Overview of ONTAP Logs
https://kb.netapp.com/on-prem/ontap/Ontap_OS/OS-KBs/Overview_of_ONTAP_LogsNetApp ONTAP EMS events, notifications, monitoring of filling
https://www.samuraj-cz.com/en/article/netapp-ontap-ems-events-notifications-monitoring-of-filling/How to search the event (EMS) log in ONTAP
https://kb.netapp.com/on-prem/ontap/Ontap_OS/OS-KBs/How_to_search_the_event_log_in_ONTAPONTAP 9 – How to review logs
https://www.storagefreak.net/2017/09/ontap-9-how-to-review-logsNetApp Cloud Insights – ONTAP EMS Alerting & Dashboard Widgets
https://judsonian.com/content/netapp-cloud-insights-ontap-ems-alerting-dashboard-widgets/