Understanding Misleading Volume Usage in NetApp ONTAP and Checkmk
This article highlights a potentially misleading volume utilization behavior when monitoring thin-provisioned NetApp ONTAP volumes with Checkmk.
When the logical free space of a volume exceeds the remaining free capacity of its underlying aggregate, Checkmk can report significantly more used space than the volume actually contains, something administrators should be aware of before reacting to capacity warnings or simply extending the affected volume.
Simulating Low Aggregate Free Space for the Checkmk Test
To reproduce the misleading volume utilization previously observed in Checkmk, we need to reduce the available capacity of the FabricPool performance tier.
An initial attempt to achieve this by creating a large space-guaranteed volume fails because FabricPool aggregates only permit thin-provisioned volumes with space-guarantee none; therefore, we instead need to consume the local performance-tier capacity with actual test data.
This confirms that volumes residing on an aggregate with an attached object store must be thin provisioned (
space-guarantee none).
volume create -vserver svm_matrix_cifs -volume vol_aggr_filler -aggregate aggr_data_01 -size 790GB -space-guarantee volume -security-style ntfs

Because a FabricPool aggregate does not allow space-guaranteed volumes, we instead create a large thin-provisioned FlexVol volume that will be filled with test data to consume capacity on the local performance tier.
The tiering policy is explicitly set to none to ensure that the generated filler data remains on the performance tier and is not moved to Azure Blob Storage.
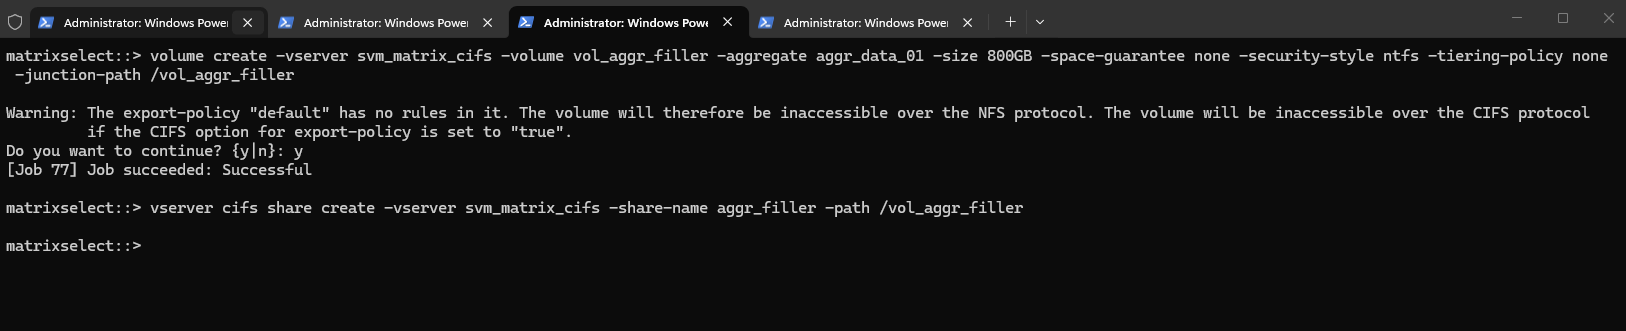
volume create -vserver svm_matrix_cifs -volume vol_aggr_filler -aggregate aggr_data_01 -size 800GB -space-guarantee none -security-style ntfs -tiering-policy none -junction-path /vol_aggr_filler

Since we want to generate the test data from a Windows client, we also create an SMB share for the new volume.
vserver cifs share create -vserver svm_matrix_cifs -share-name aggr_filler -path /vol_aggr_filler
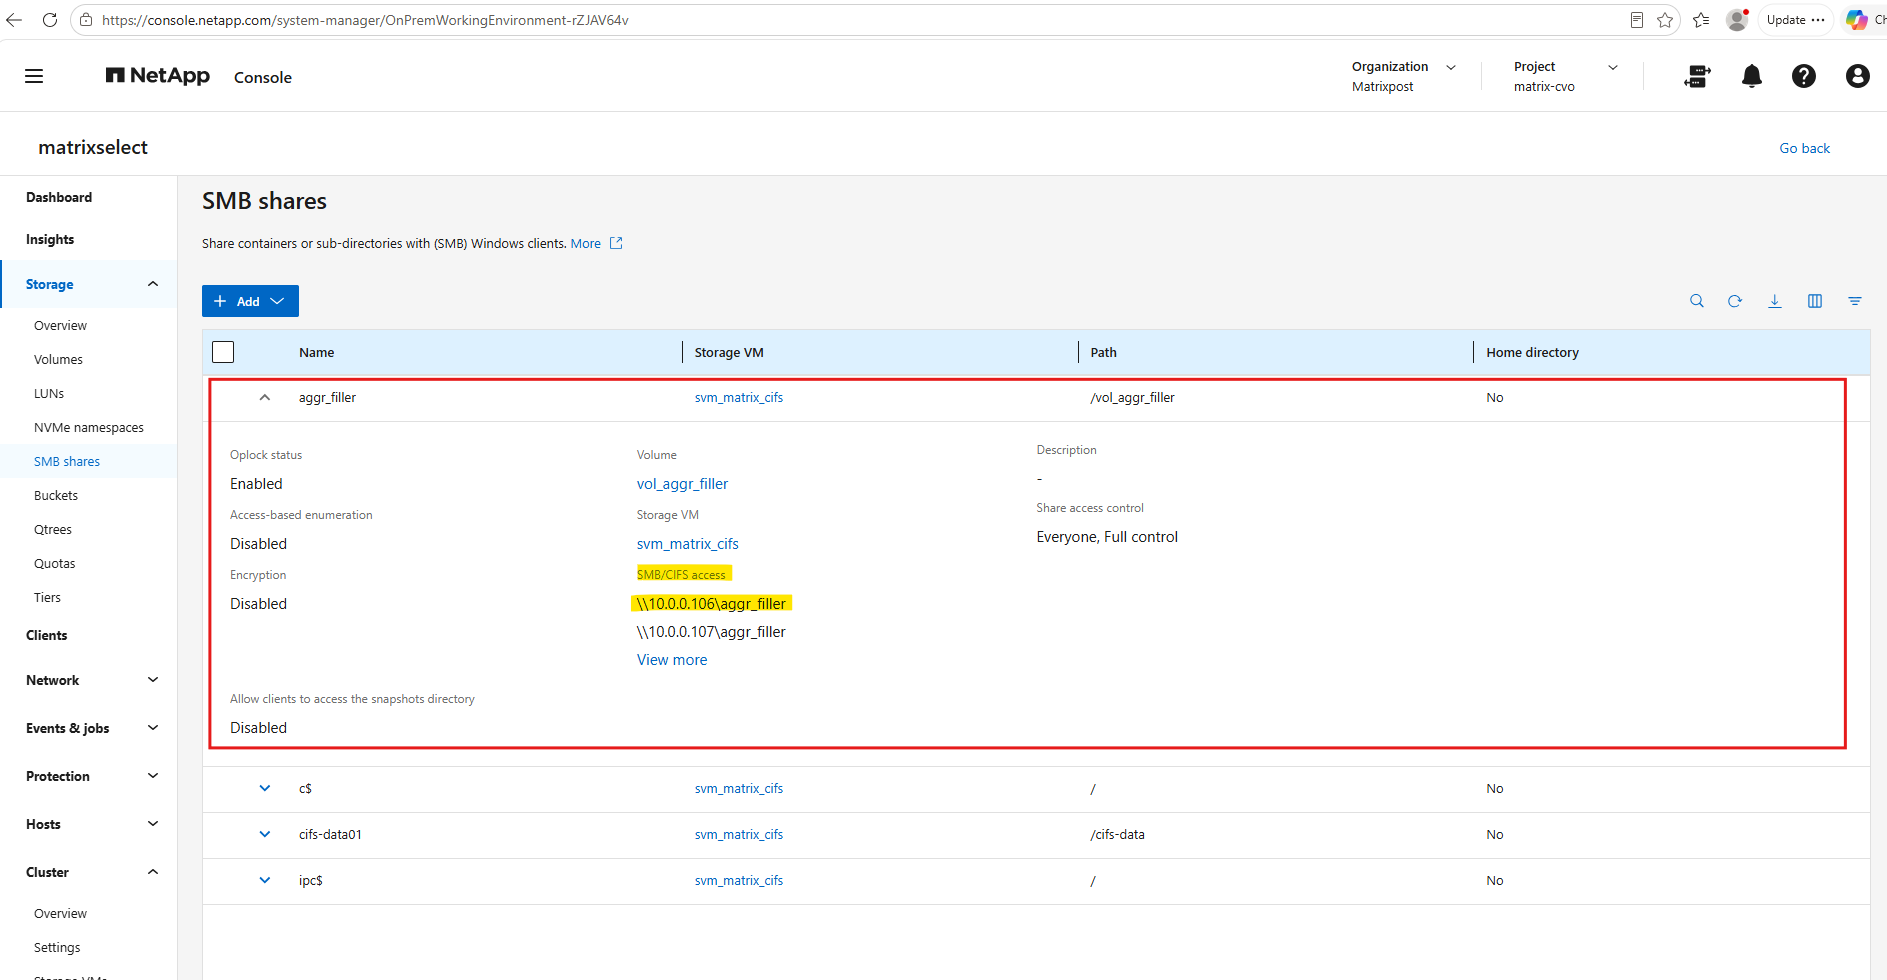
The temporary filler volume is exposed through the SMB share aggr_filler, allowing us to generate the required test data from a Windows client.
The volume uses the
nonetiering policy, ensuring that the generated data remains on the local performance tier while we deliberately reduce the available capacity ofaggr_data_01.
We can now gradually fill this volume with unique data until the available capacity of aggr_data_01 has been reduced significantly.
Let’s generate the filler data directly on Y:. Since we specifically need to defeat deduplication and compression, we use cryptographically random data. Rather than creating one enormous file, we use 10 GiB files.
To prevent ONTAP storage efficiency from eliminating our filler data through deduplication or compression, we generate unique random data on the mapped SMB share. The PowerShell script creates the data in 10 GiB files, allowing us to monitor the aggregate capacity and stop the process once approximately 150 GB of local performance-tier capacity remains available.
In an elevated PowerShell:
The PowerShell script generates unique random data in 10 GiB files on the
aggr_fillerSMB share as mentioned. Generating the required amount of random data will take some time in my lab.
$Path="Y:\FabricPool-Filler"; New-Item -ItemType Directory -Path $Path -Force | Out-Null; $Buffer=New-Object byte[] (8MB); $Rng=[System.Security.Cryptography.RandomNumberGenerator]::Create(); for($FileNo=1;$FileNo -le 80;$FileNo++){ $File=Join-Path $Path ("filler_{0:D2}.bin" -f $FileNo); $Fs=[System.IO.File]::Create($File); for($i=0;$i -lt 1280;$i++){ $Rng.GetBytes($Buffer); $Fs.Write($Buffer,0,$Buffer.Length) }; $Fs.Close(); Write-Host "Completed $FileNo x 10 GiB = $($FileNo*10) GiB" }; $Rng.Dispose()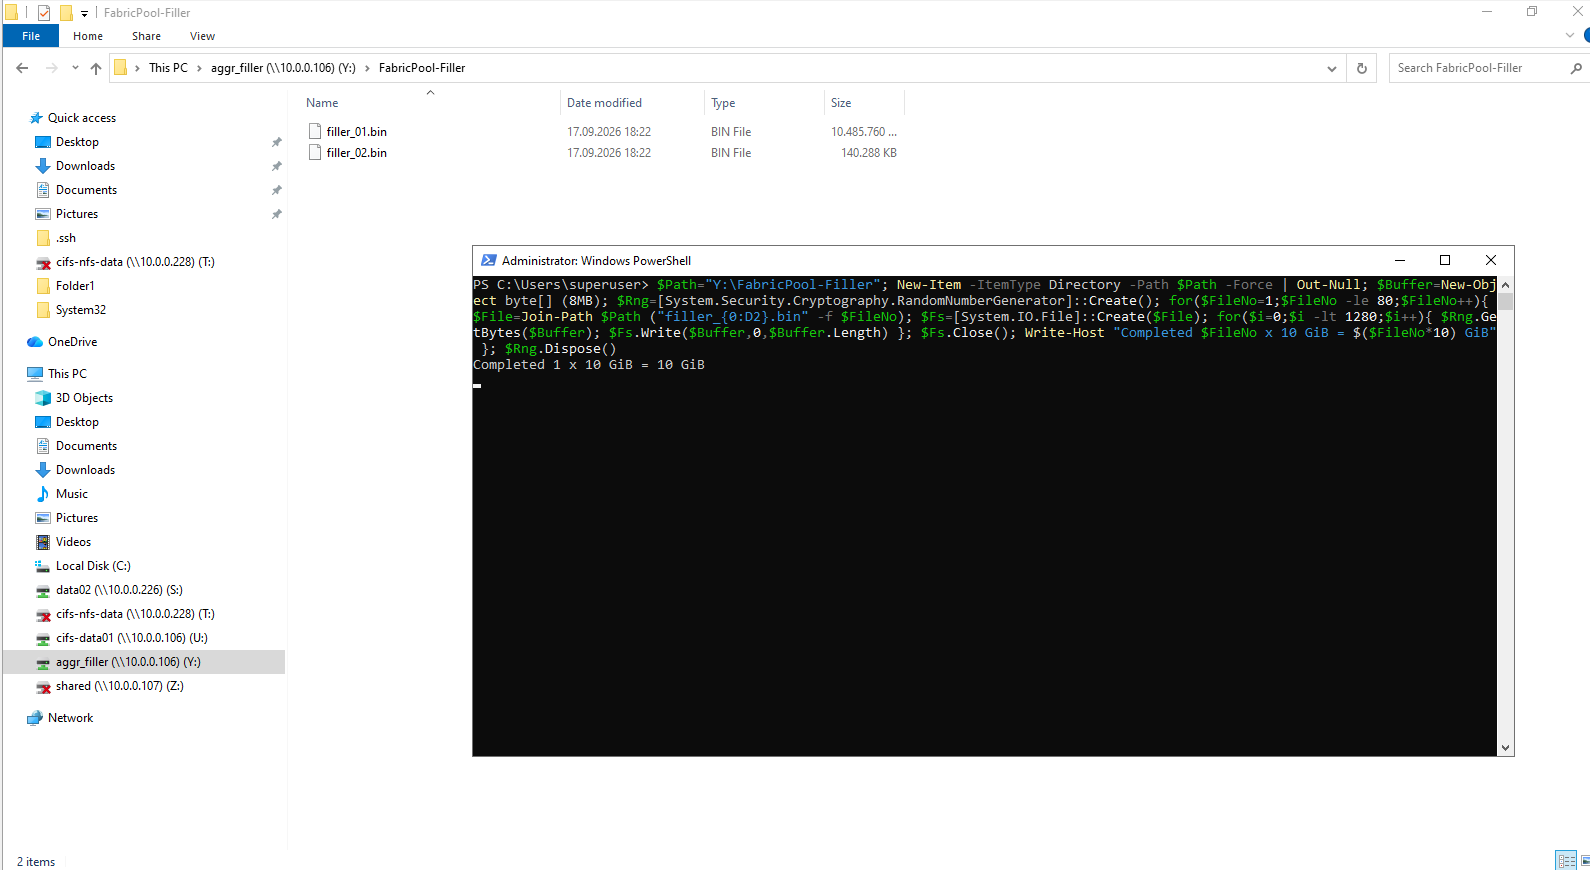
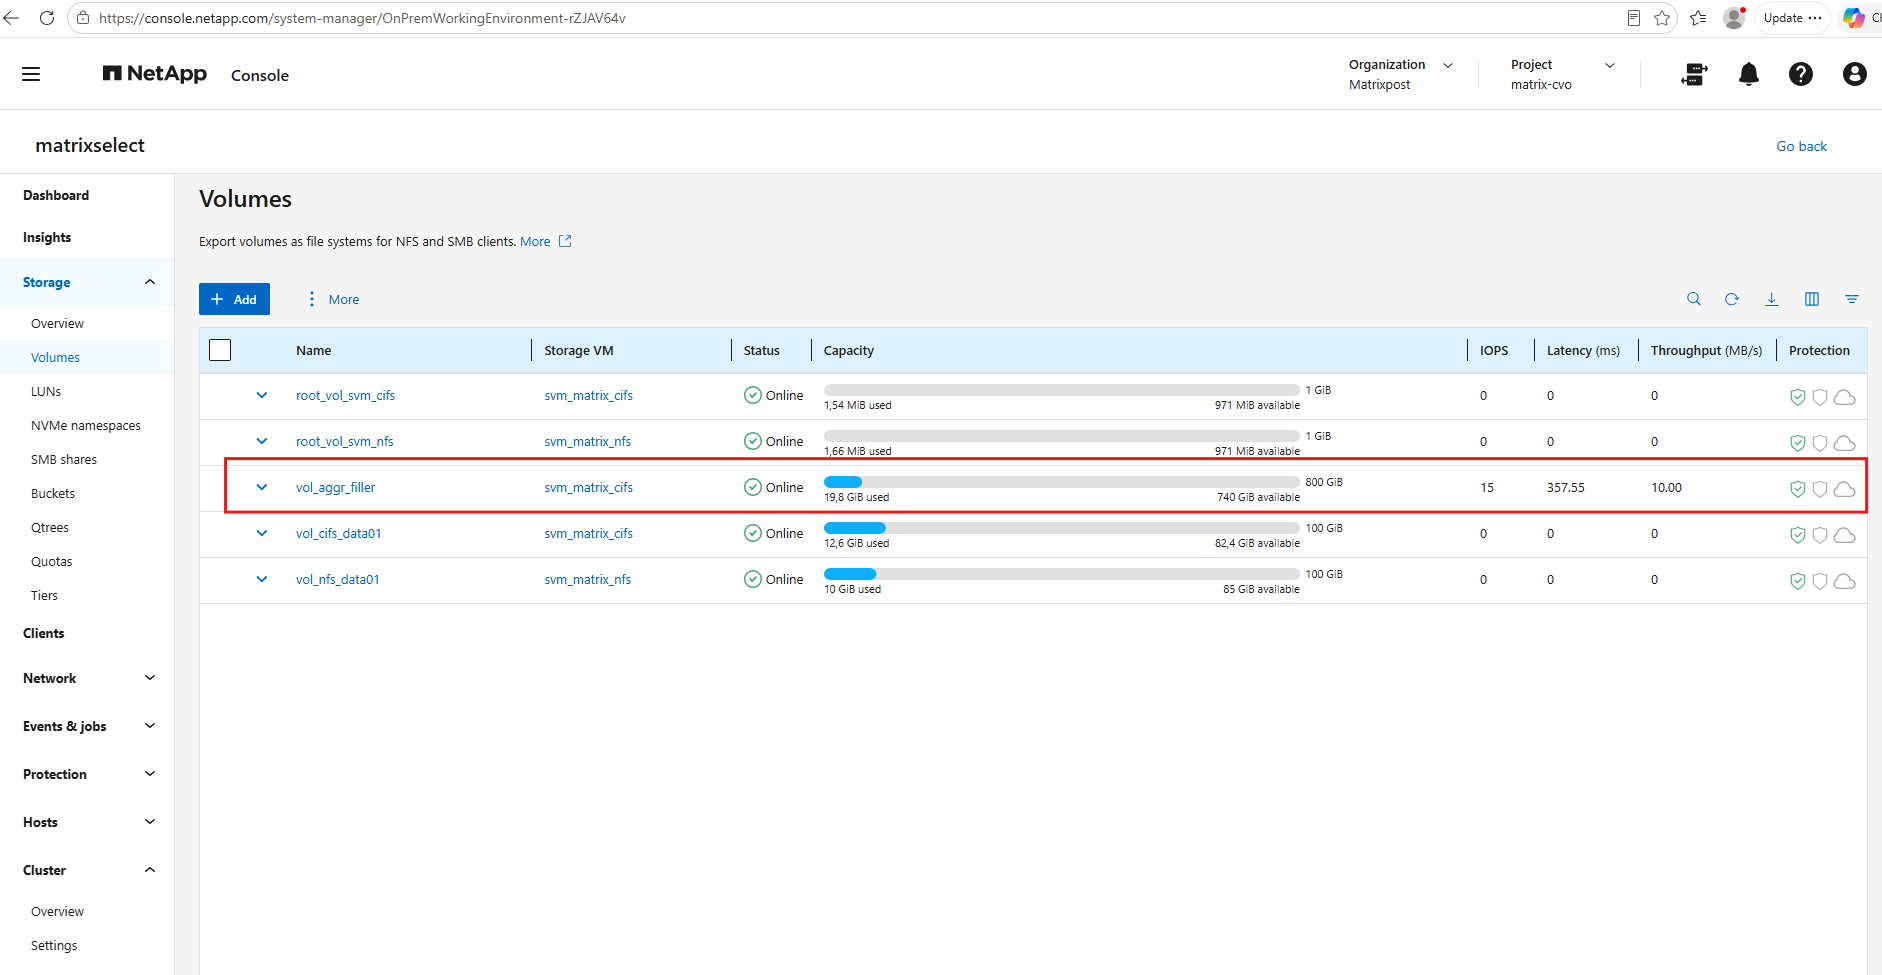
The first 10 GiB file has been completed and the second file is currently being generated as showing above, with the filler volume already consuming approximately 19.8 GiB.
The volume overview in System Manager allows us to monitor the progress as the
vol_aggr_fillervolume gradually consumes the available capacity of the local aggregate.
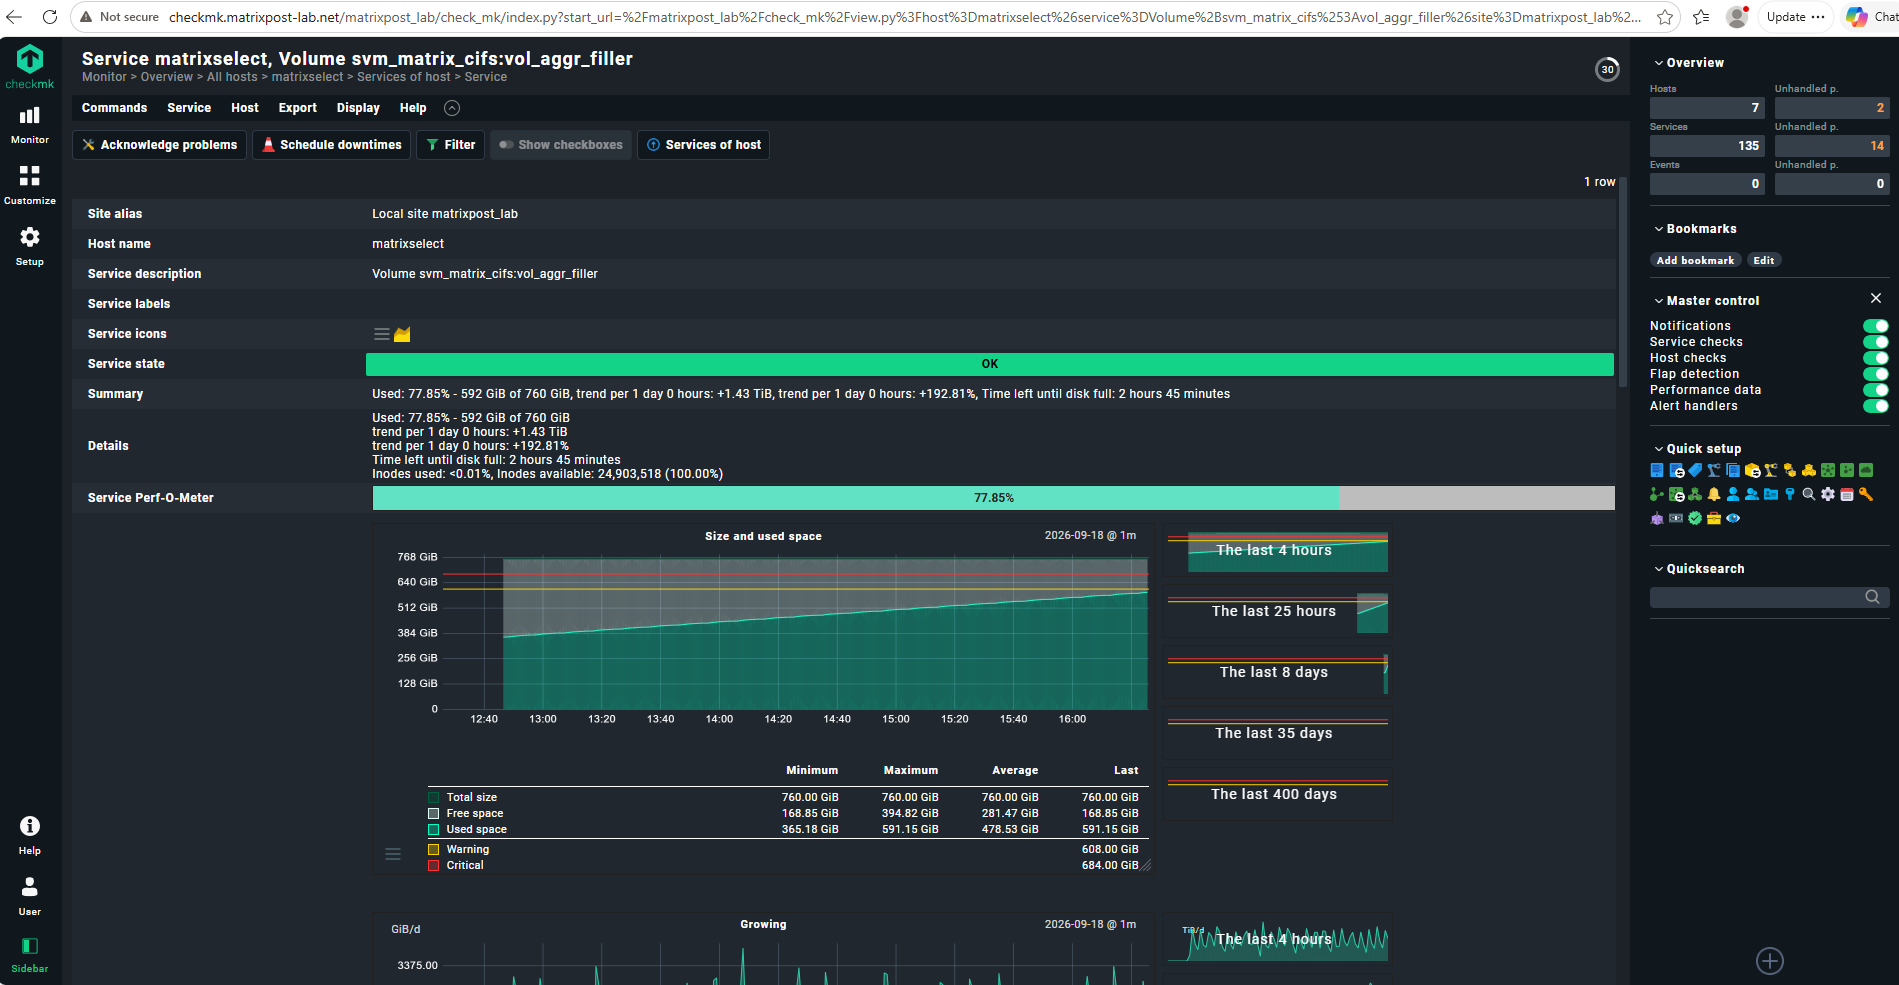
Checkmk already shows the continuous growth of the vol_aggr_filler volume, currently consuming approximately 592 GiB (77.85%).
As the filler data continues to consume local aggregate capacity, we can use Checkmk to observe how the reported utilization of our actual test volume
vol_cifs_data01changes.
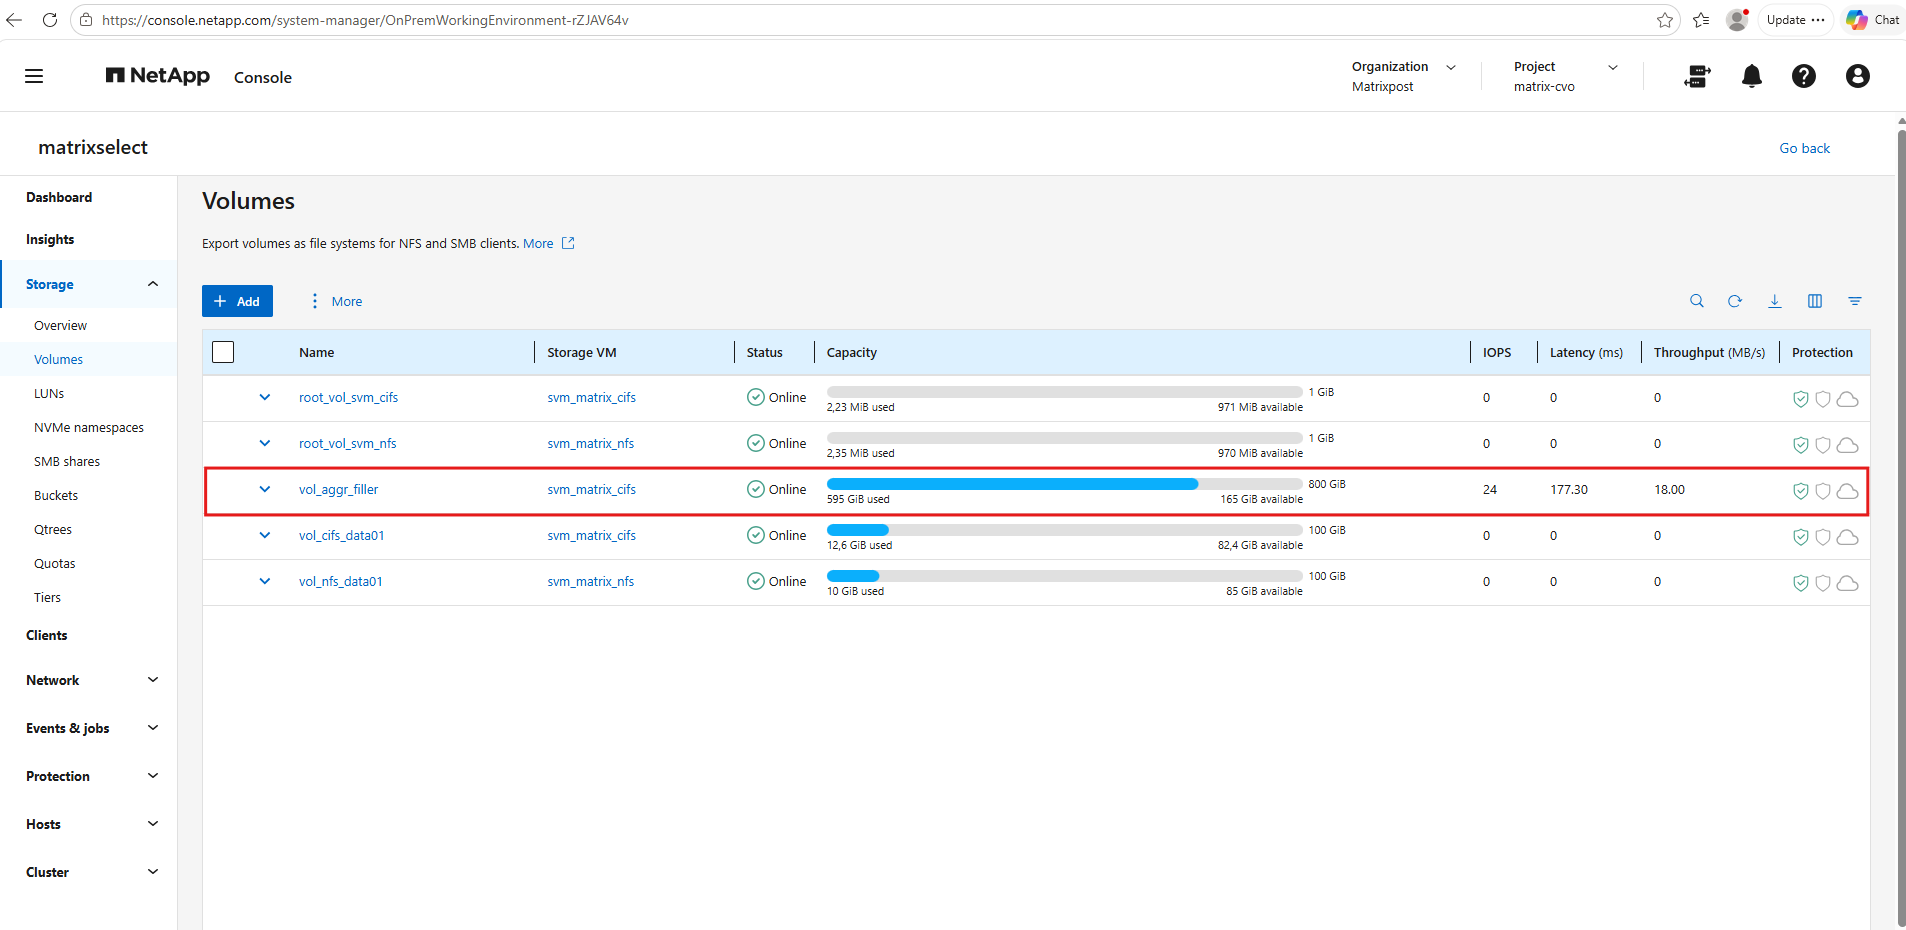
System Manager confirms that vol_aggr_filler has reached approximately 595 GiB used, while our actual test volume vol_cifs_data01 remains unchanged at 12.6 GiB used with 82.4 GiB available.
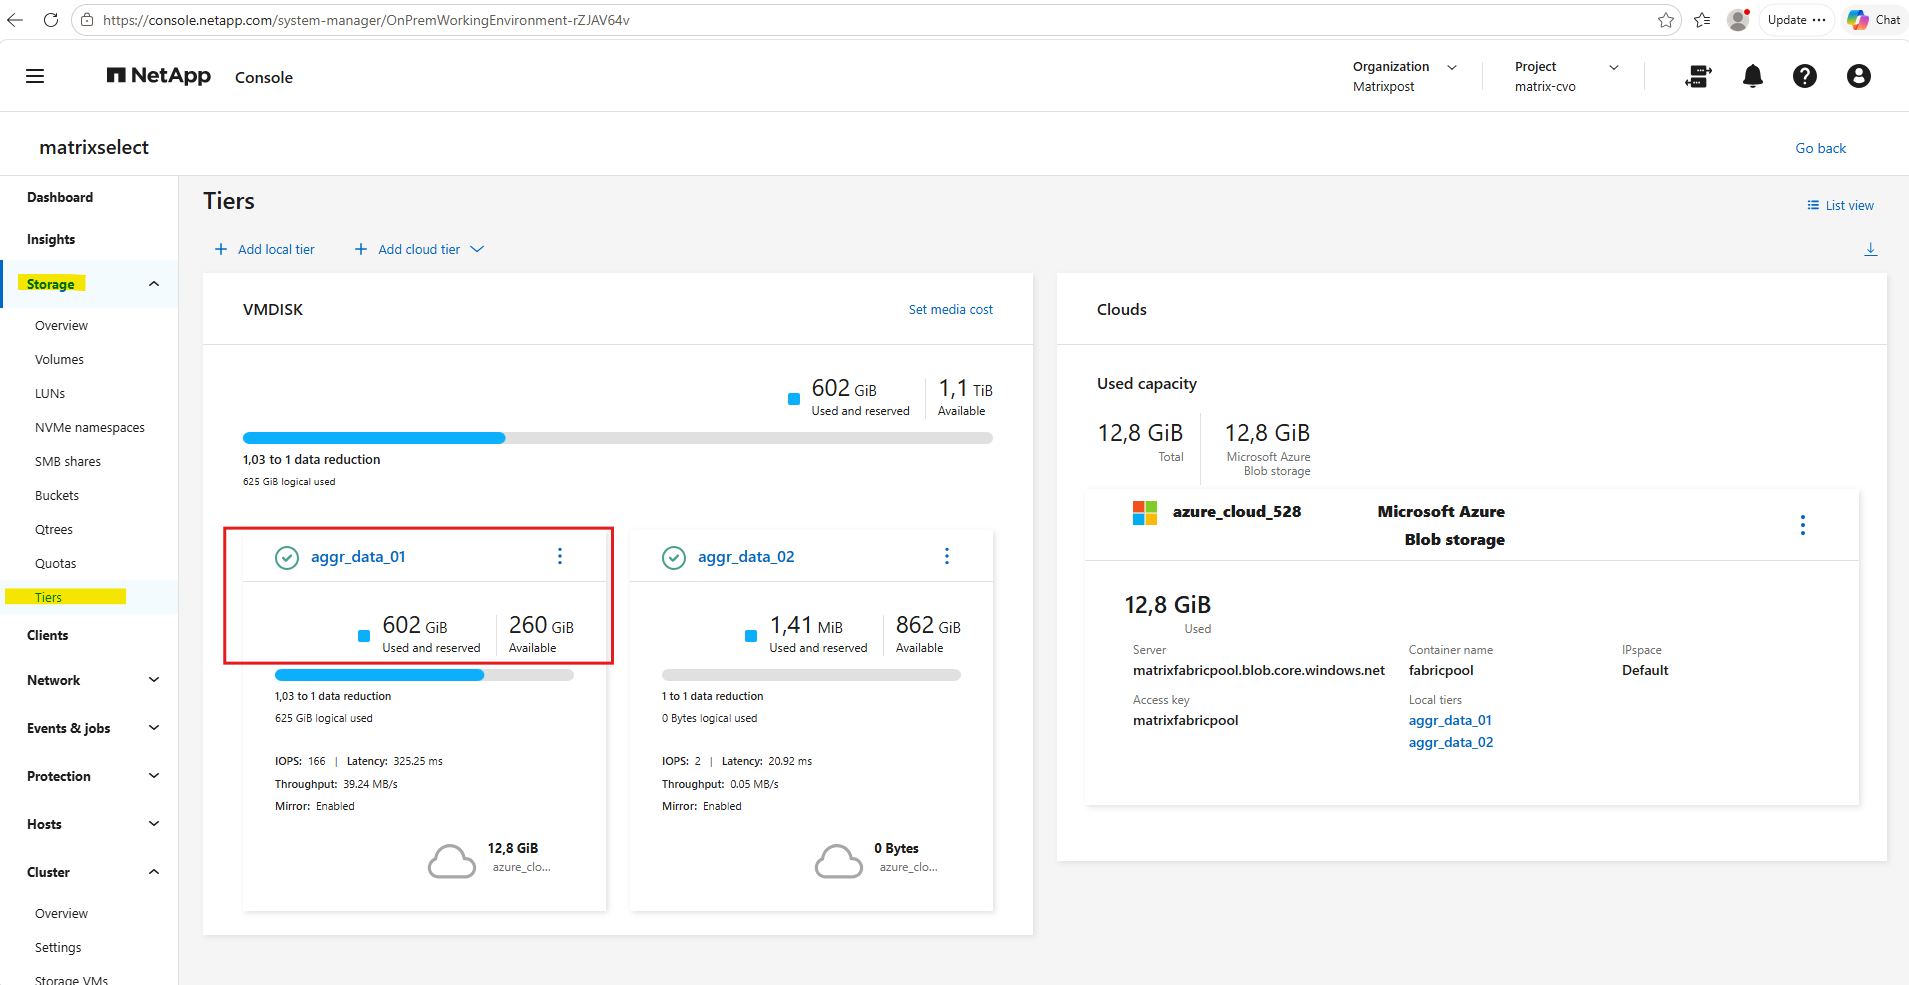
The Tiers view confirms that aggr_data_01 is now consuming approximately 602 GiB, with 260 GiB still available on the local performance tier. The attached Azure capacity tier currently contains 12.8 GiB of data.
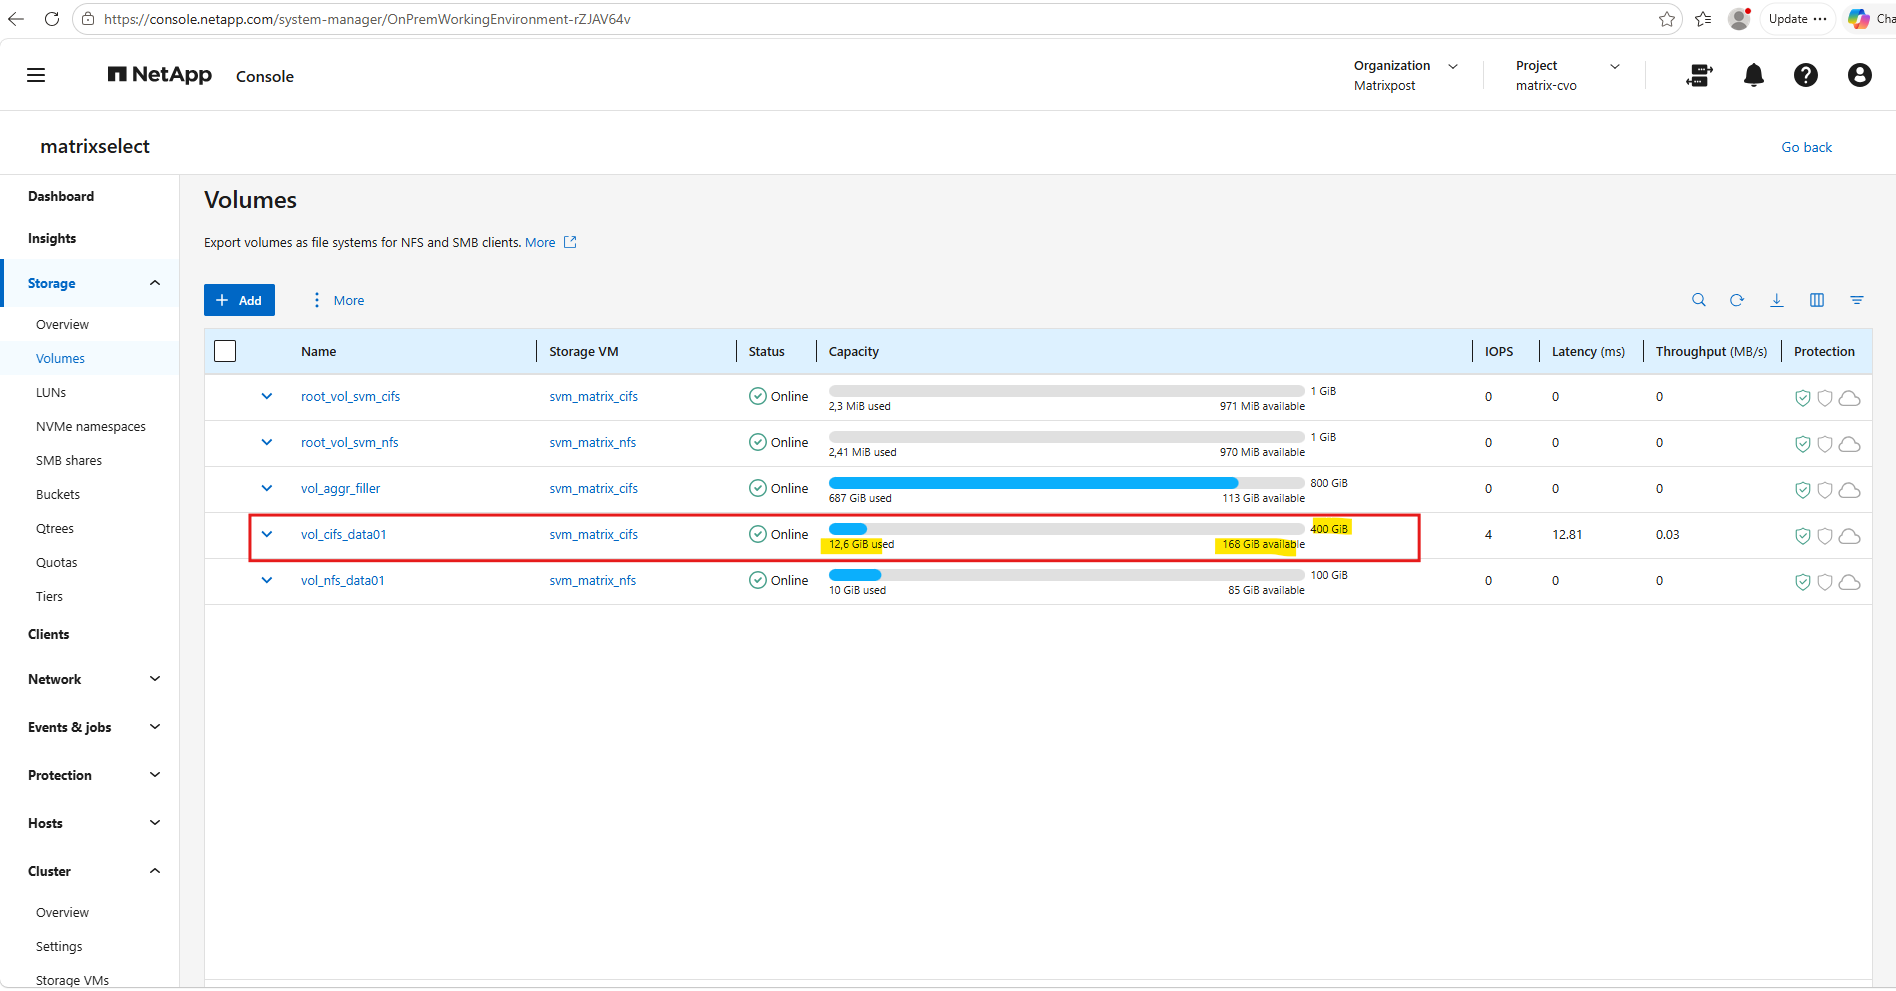
To make the discrepancy clearly visible, we extend vol_cifs_data01 from 100 GiB to 400 GiB and stop the filler workload, leaving the available capacity of the underlying aggregate at its deliberately reduced level.
Although the volume still contains only 12.6 GiB of actual user data, ONTAP now reports just 168 GiB available shown below, as the available space is constrained by the remaining capacity of the underlying aggregate.
volume size -vserver svm_matrix_cifs -volume vol_cifs_data01 -new-size 400GB

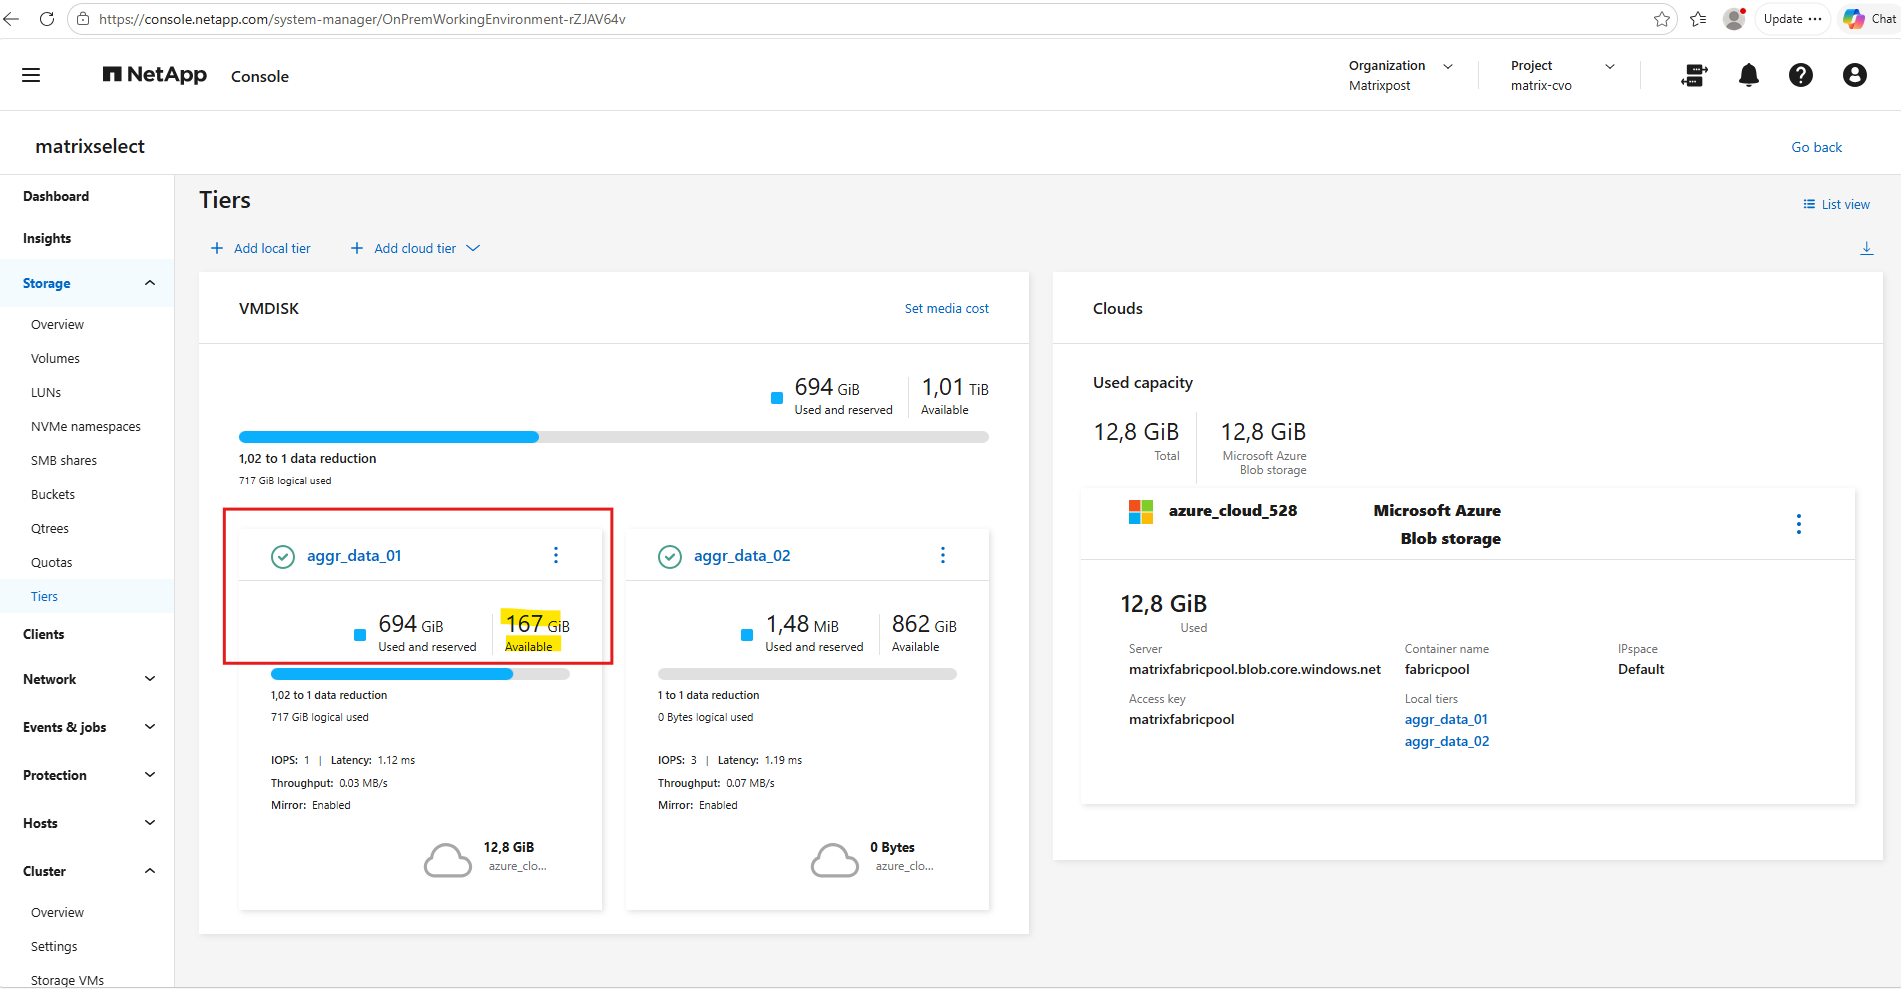
After stopping the filler workload, aggr_data_01 has reached 694 GiB used and reserved, leaving only 167 GiB available on the local performance tier.
This remaining aggregate capacity effectively limits the available space reported for all thin-provisioned volumes whose logical free space exceeds the available aggregate capacity, including our
vol_cifs_data01test volume.
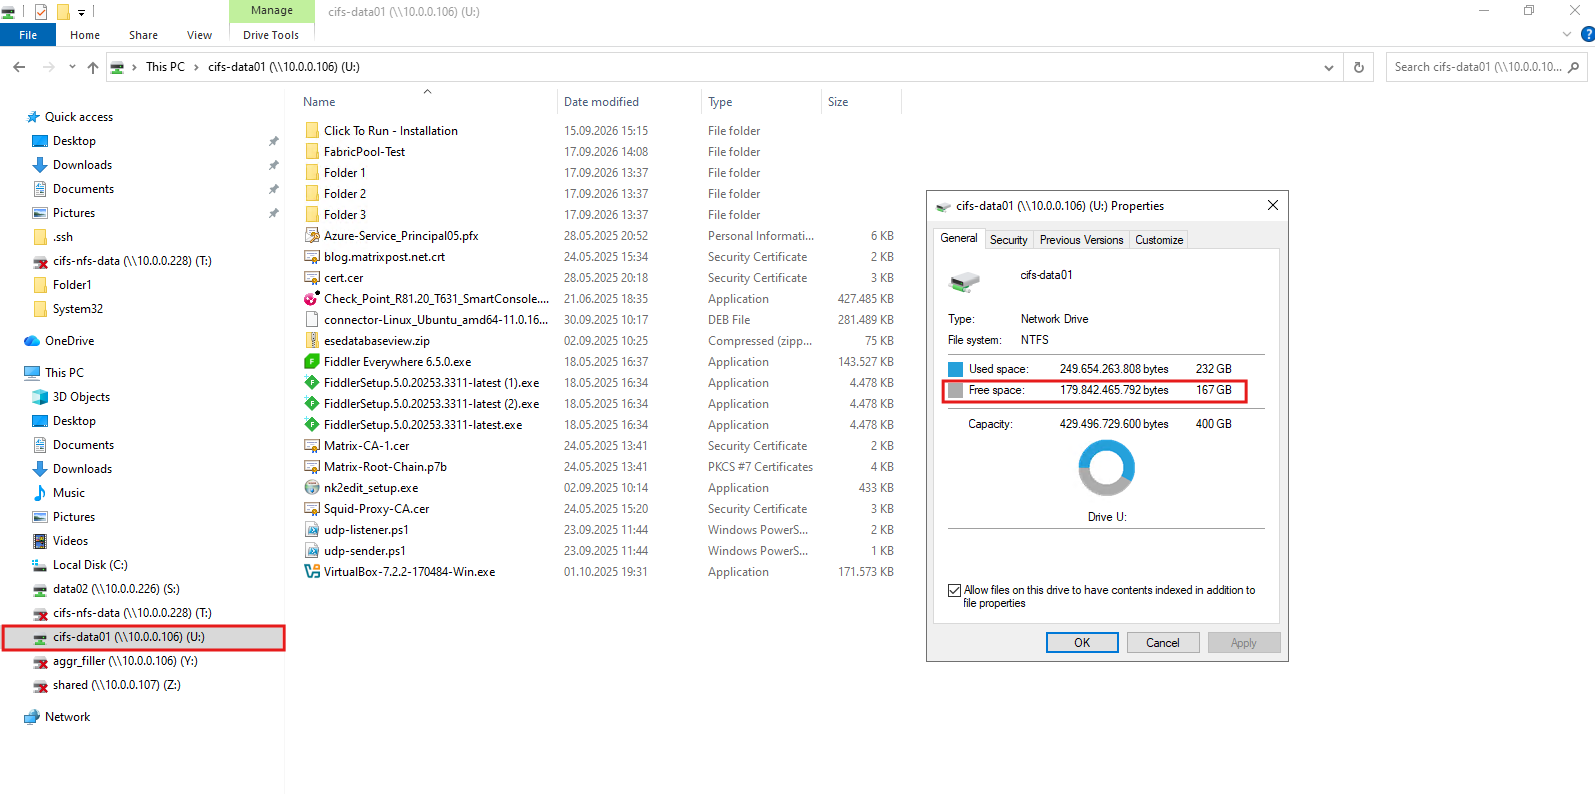
ONTAP also correctly reports the aggregate-constrained available capacity to connected clients.
As shown on the mounted SMB volume, Windows sees the 400 GiB volume with only 167 GiB free, even though the volume itself contains only about 12.6 GiB of actual user data.
Analyzing the Volume Utilization Reported by Checkmk
Now that the aggregate capacity is constrained, we can examine how Checkmk reports the utilization of our thin-provisioned vol_cifs_data01 volume.
Comparing the Checkmk values with the actual ONTAP usage reveals why the reported volume utilization can be highly misleading.
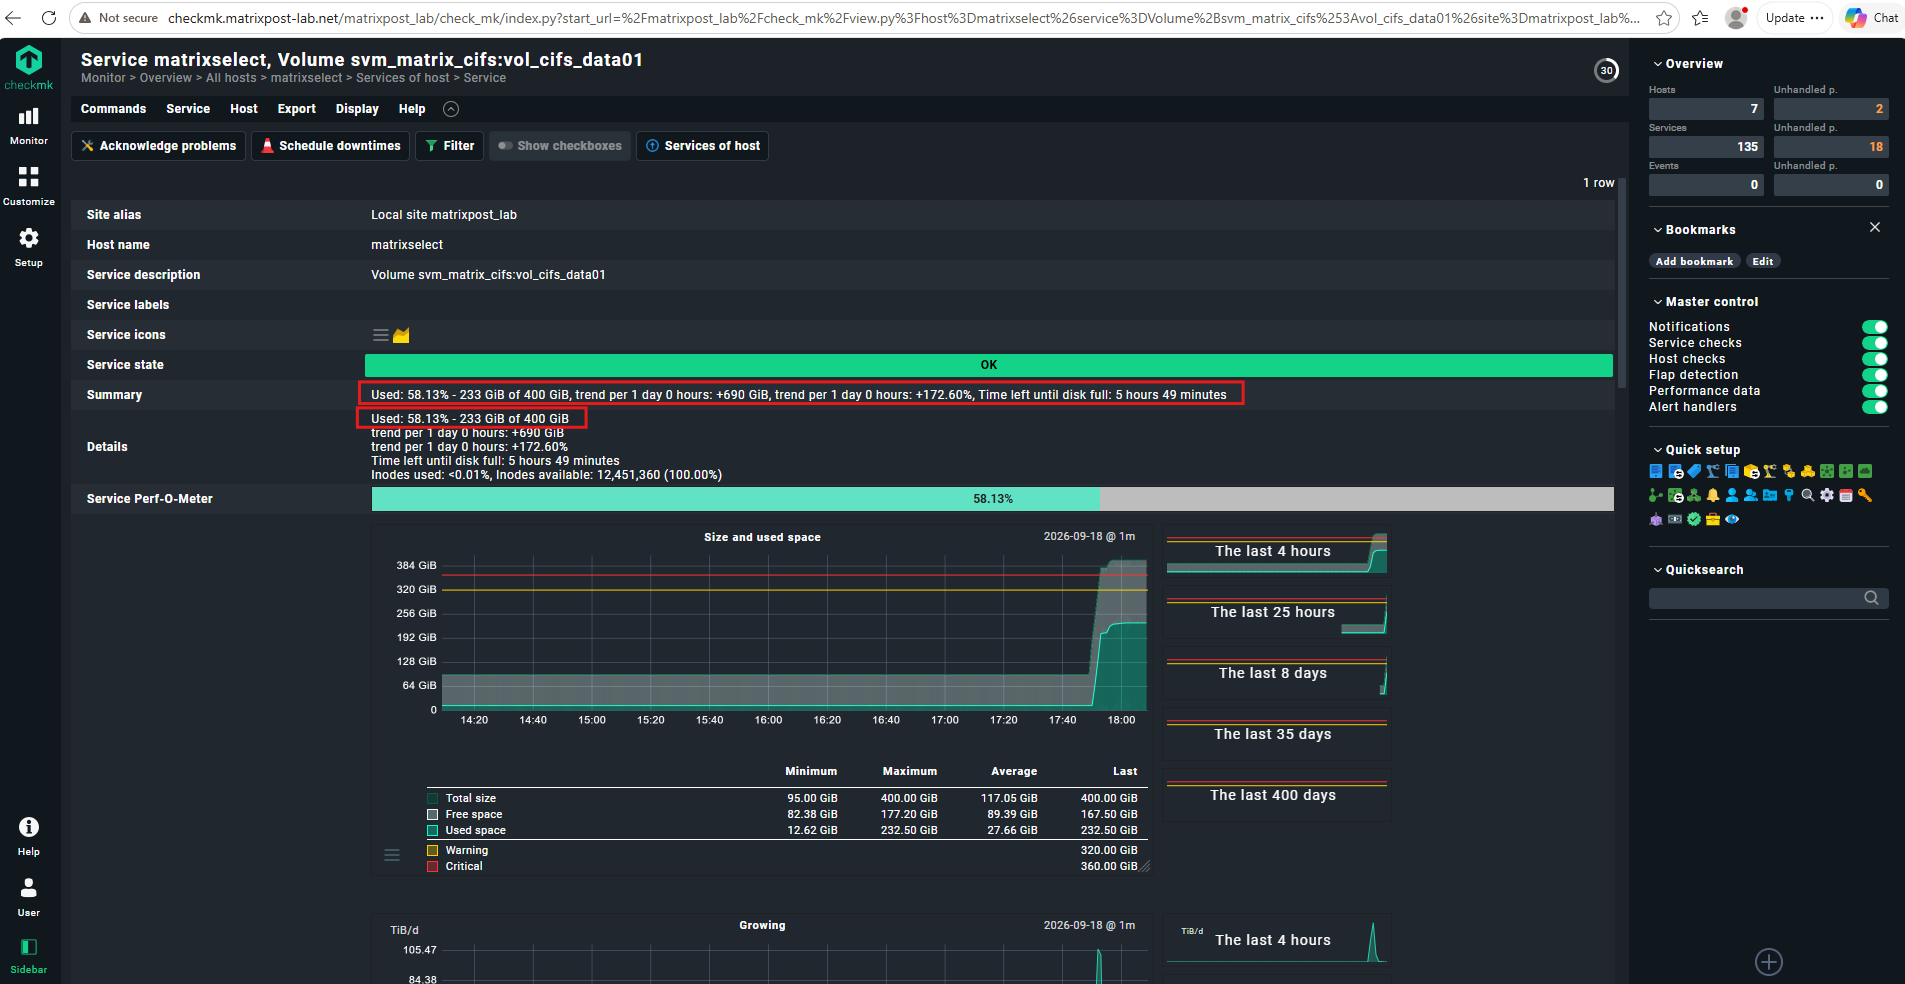
Checkmk now reports vol_cifs_data01 as 233 GiB used (58.13%) of 400 GiB, although ONTAP shows only 12.6 GiB of actual user data.
Note: The reason is that Checkmk effectively derives the used capacity as logical volume size − available space; because ONTAP limits the reported available space to the remaining 167.5 GiB of aggregate capacity, Checkmk calculates
400 GiB − 167.5 GiB ≈ 232.5 GiBas used.This behavior becomes misleading specifically for thin-provisioned volumes whose logical free space exceeds the free capacity of the underlying aggregate. If an administrator reacts to a capacity warning by extending such a volume, the available space remains constrained by the aggregate while the logical volume size increases, causing Checkmk to report even more used space and potentially leaving the administrator wondering why extending the volume apparently made the problem worse.😄
To avoid this misleading utilization, administrators should monitor the actual volume data usage together with the available capacity of the underlying aggregate, rather than relying solely on the Checkmk volume utilization percentage.
Alternatively, a custom Checkmk check or rule can be used to calculate and alert on the actual ONTAP volume data usage instead of deriving utilization from the aggregate-constrained available space.
Ultimately, sufficient free aggregate capacity must be maintained so that ONTAP can provide the logical free space configured for its thin-provisioned volumes.
Configuring NetApp ONTAP Volume Monitoring in Checkmk
If you are interested in how to configure NetApp ONTAP volume monitoring in Checkmk, the following section shows the required configuration using the NetApp ONTAP REST API integration.
For more articles and examples about Checkmk, see my other Checkmk articles on matrixpost.net.
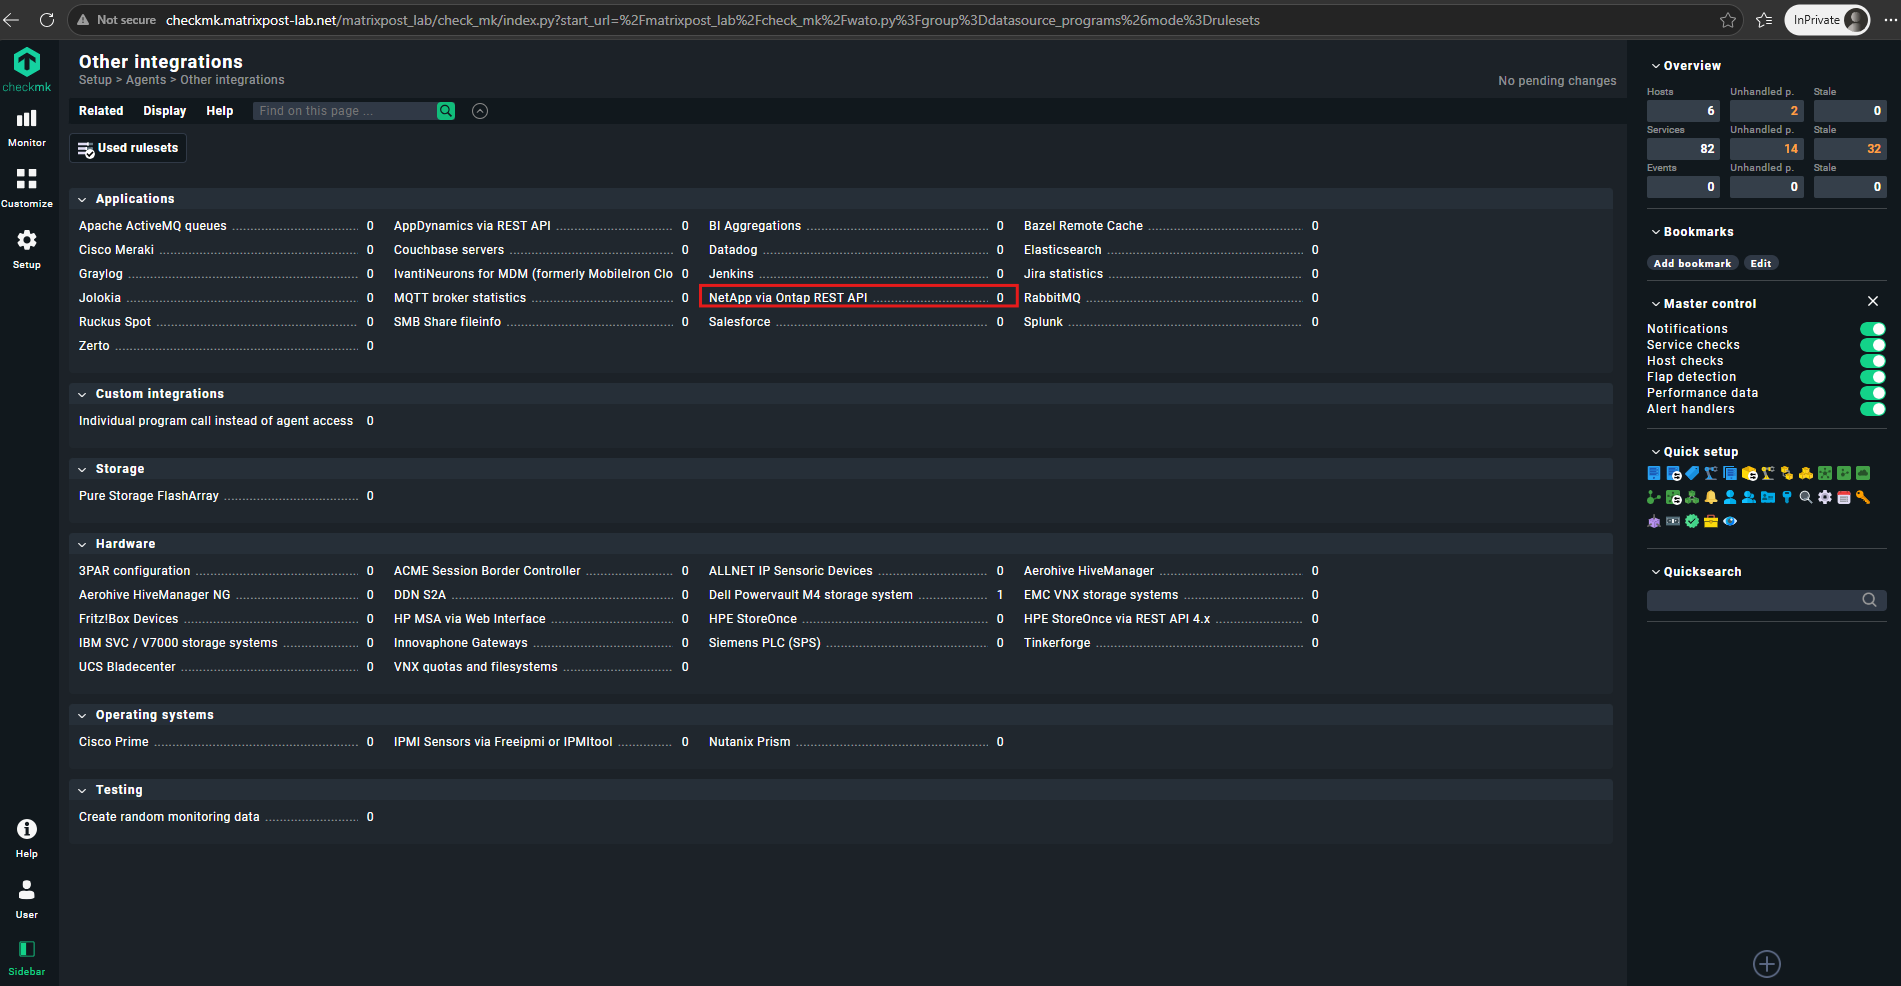
From the Checkmk Setup menu, navigate to Agents → Other integrations to configure the integration used for monitoring the NetApp ONTAP cluster.
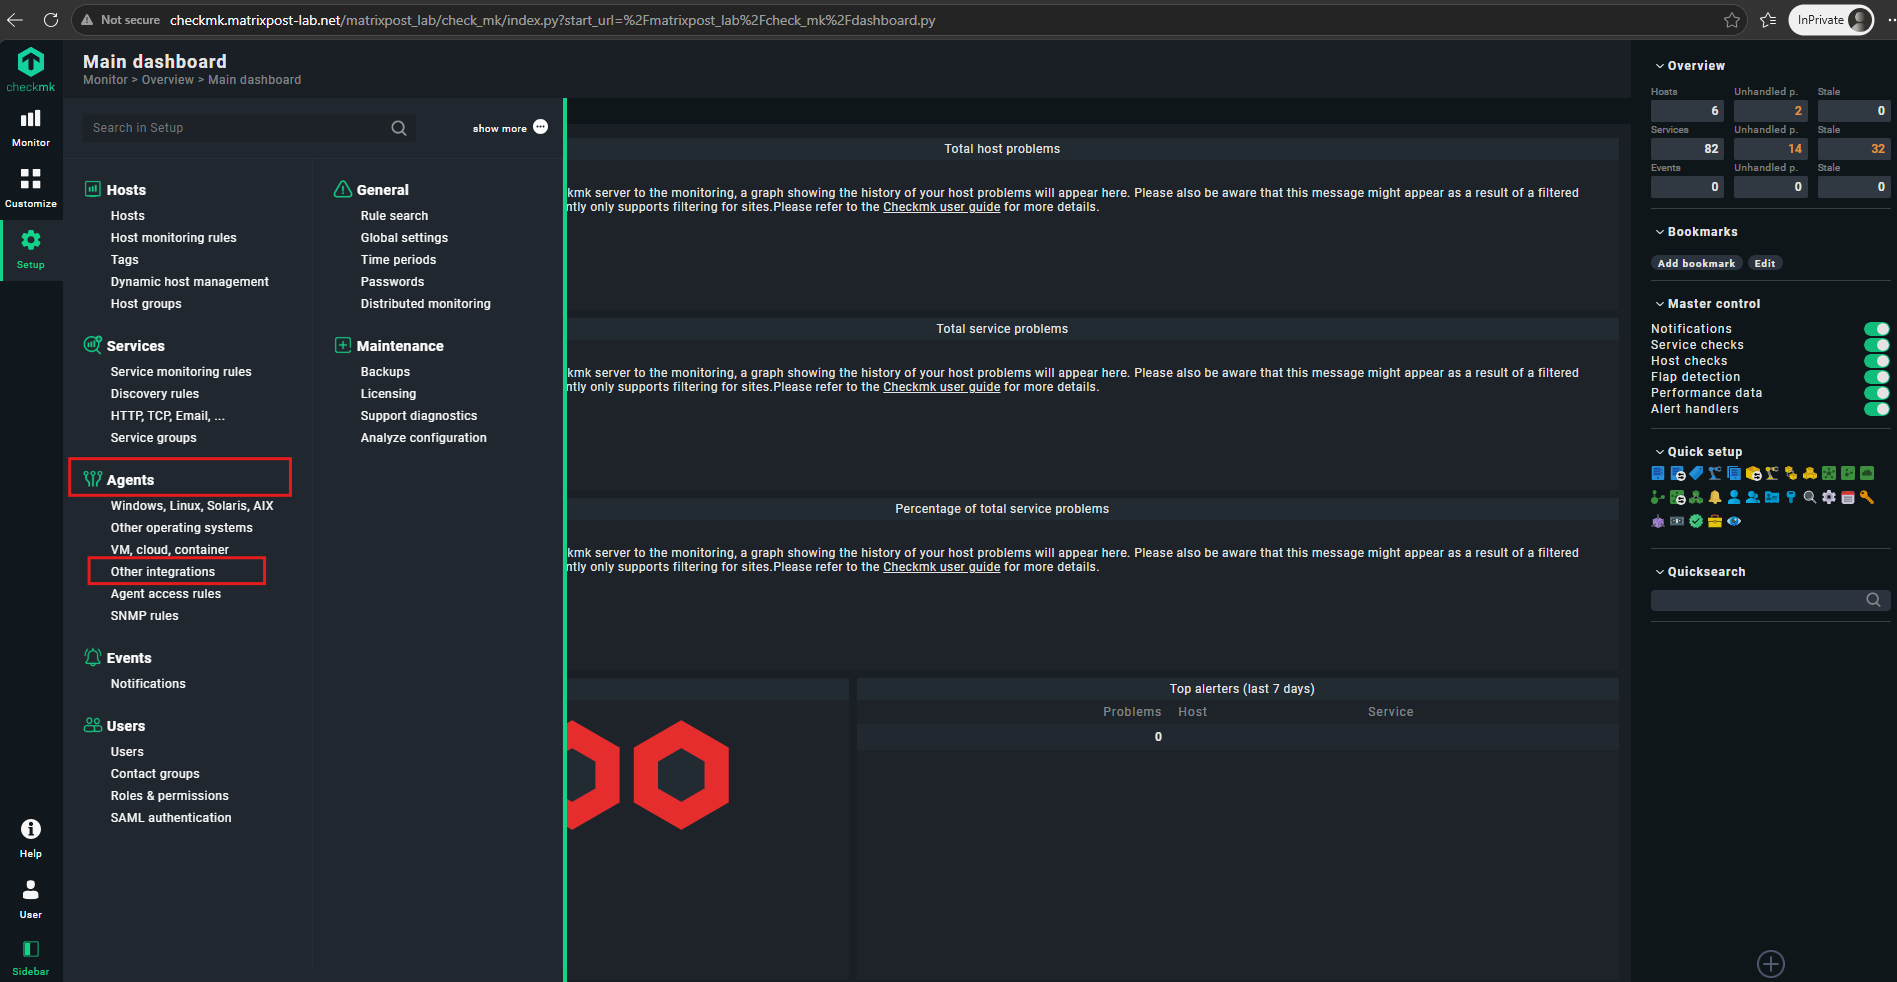
Under Other integrations, select NetApp via Ontap REST API from the Applications section. This special agent retrieves monitoring data directly from the ONTAP cluster through its REST API and does not require a Checkmk agent to be installed on ONTAP.
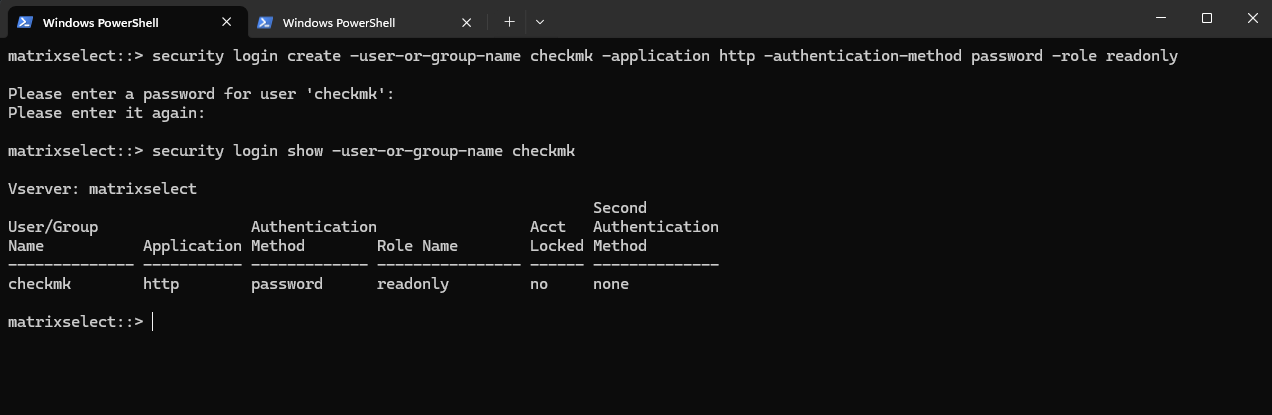
Before configuring the Checkmk integration, we create a dedicated read-only ONTAP user account for monitoring. The account uses the http application required for REST API access and the built-in readonly role, allowing Checkmk to retrieve monitoring information without granting administrative privileges.
security login create -user-or-group-name checkmk -application http -authentication-method password -role readonly

Then verify it with:
The important pieces are Application =
http, because Checkmk communicates with ONTAP through the REST API over HTTPS (in my lab just plain HTTP), and Role =readonly, which is appropriate for monitoring.
security login show -user-or-group-name checkmk
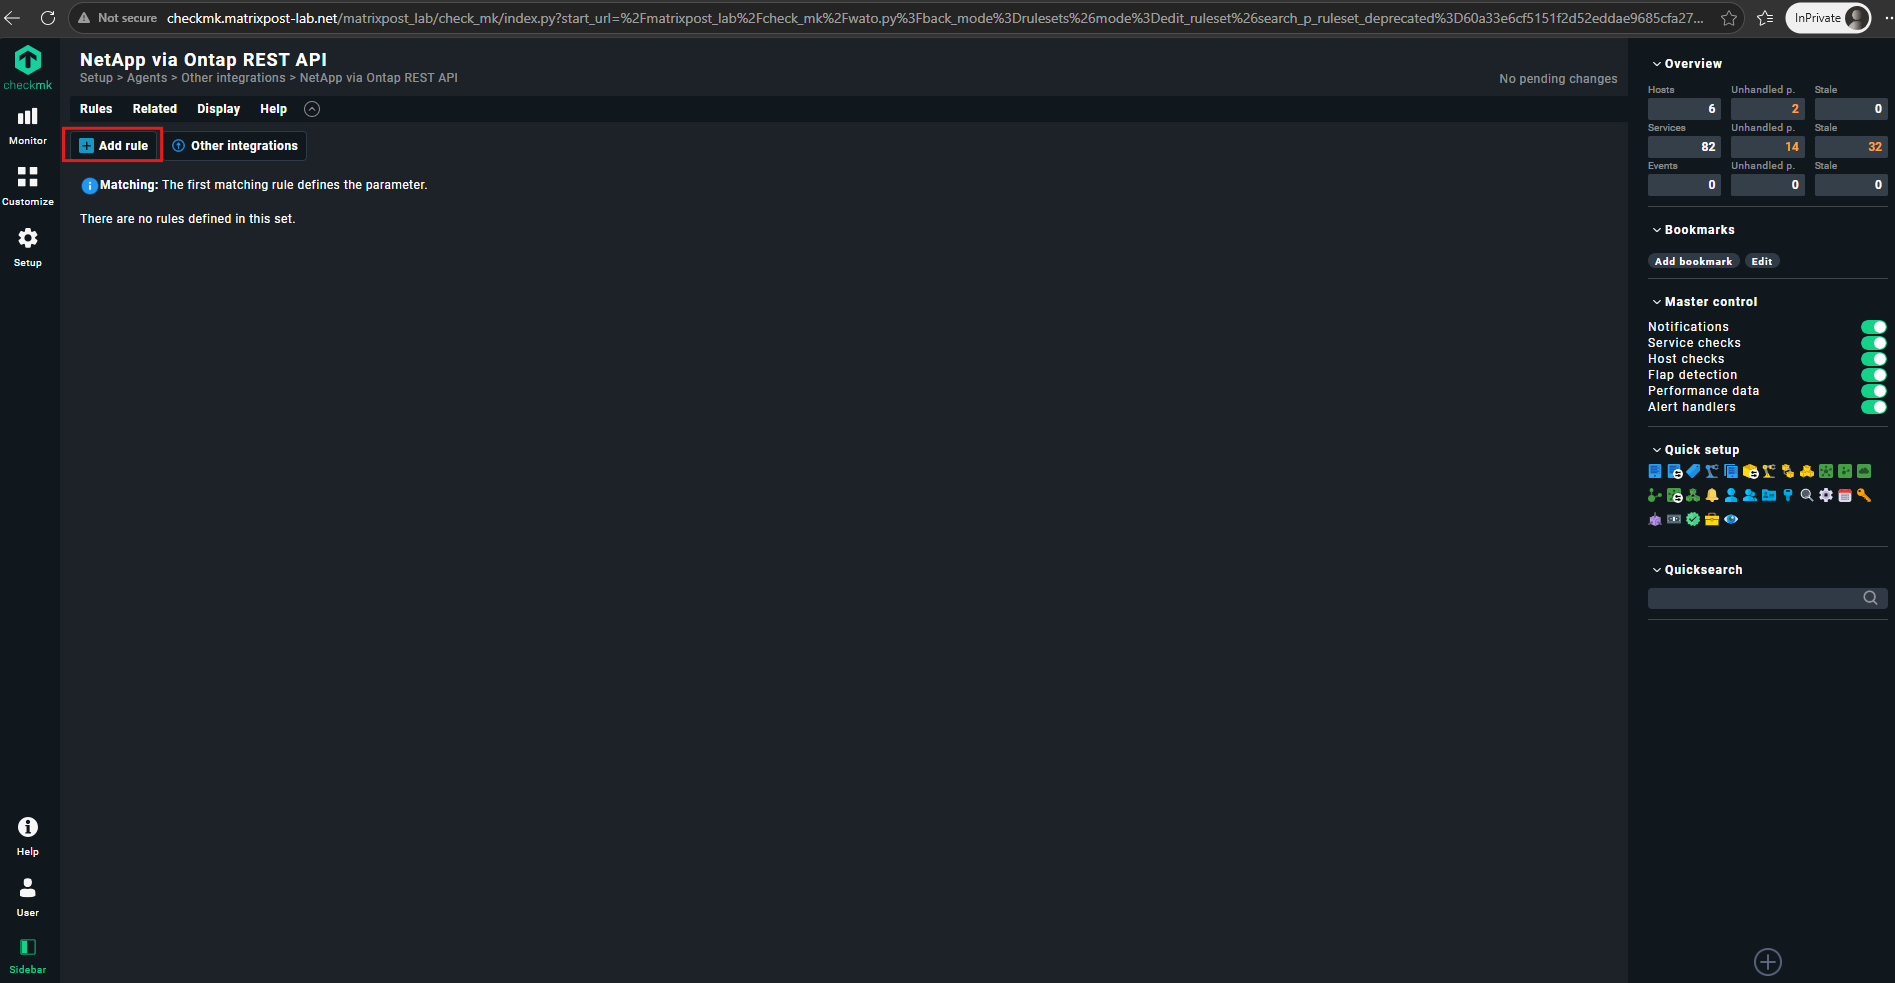
We can now use the newly created checkmk read-only ONTAP user to configure the new NetApp ONTAP REST API integration rule in Checkmk.
Click Add rule to create a new integration rule for the ONTAP cluster.
In the new rule, specify the newly created checkmk ONTAP user and password that Checkmk will use to access the ONTAP REST API.
Because the ONTAP Select lab uses a self-signed certificate, we also enable Skip TLS certificate verification.
Under Conditions, we will restrict the rule to the corresponding ONTAP host so that these credentials and integration settings are applied only to this system.
Before we can restrict the ONTAP REST API integration rule to our cluster, we first need to add the ONTAP cluster as a host in Checkmk.
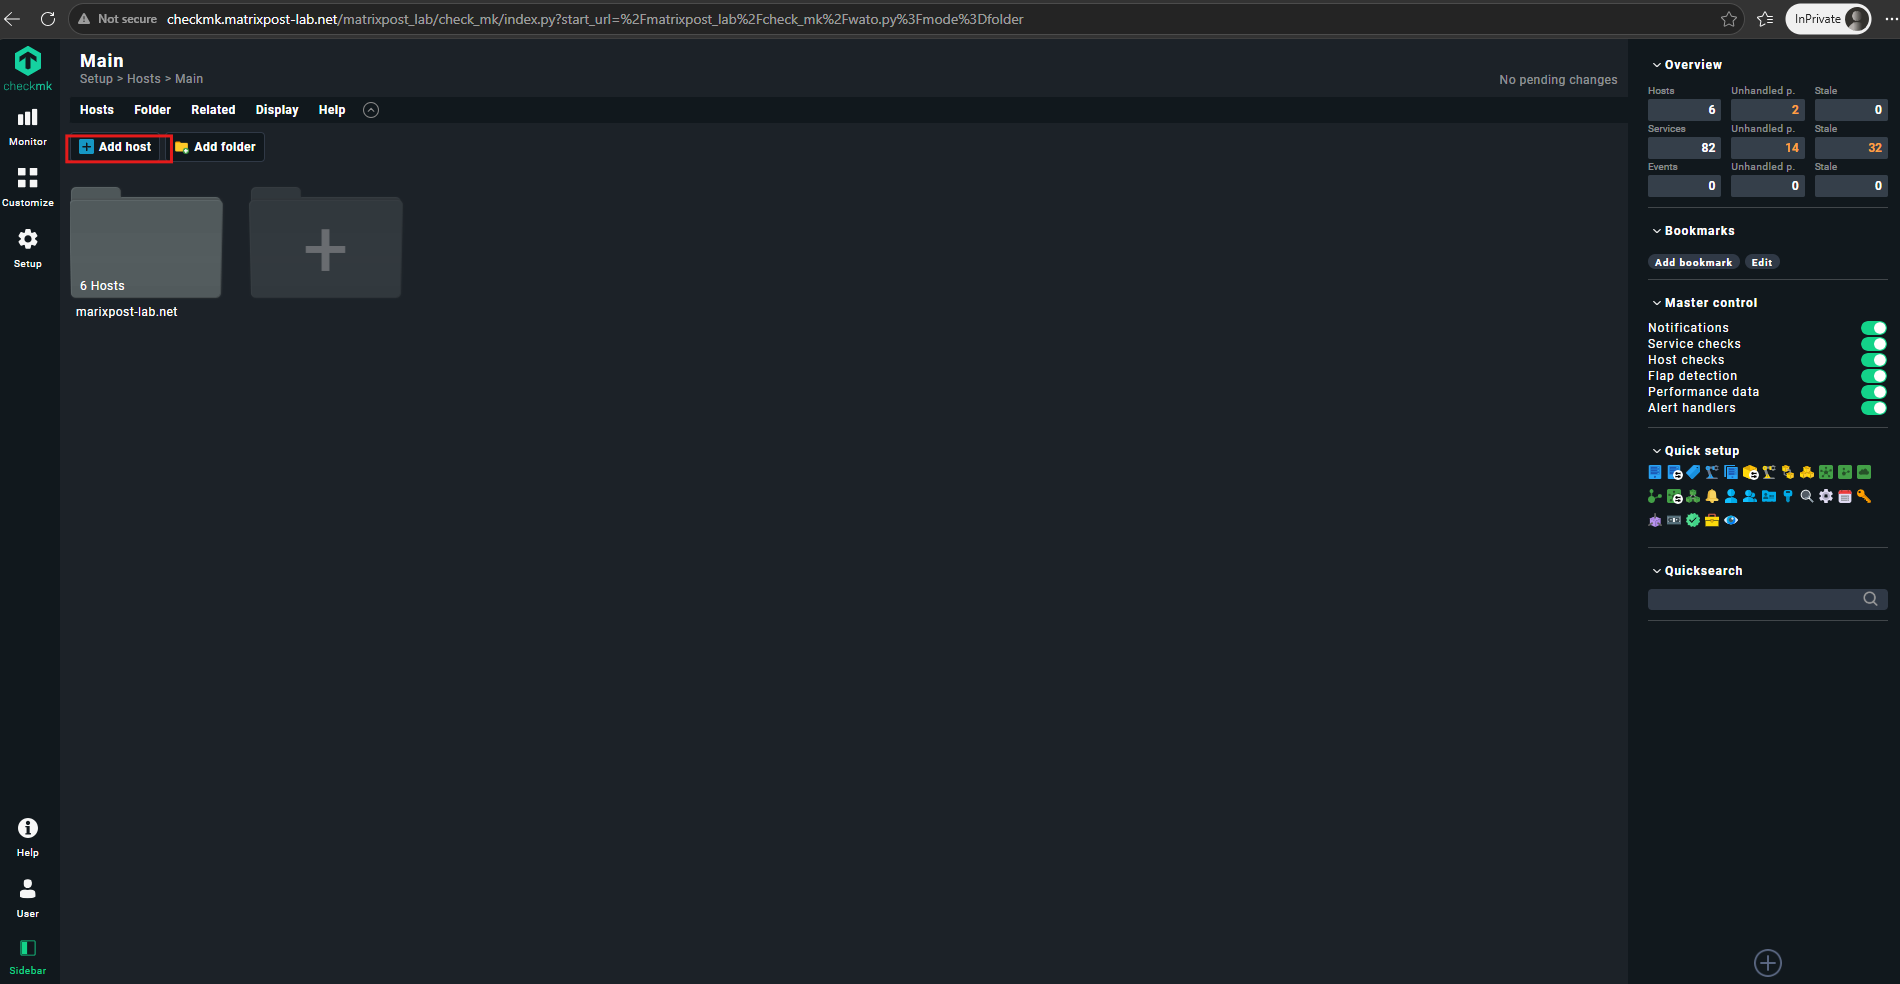
Navigate to Setup → Hosts → Hosts to open the host configuration.
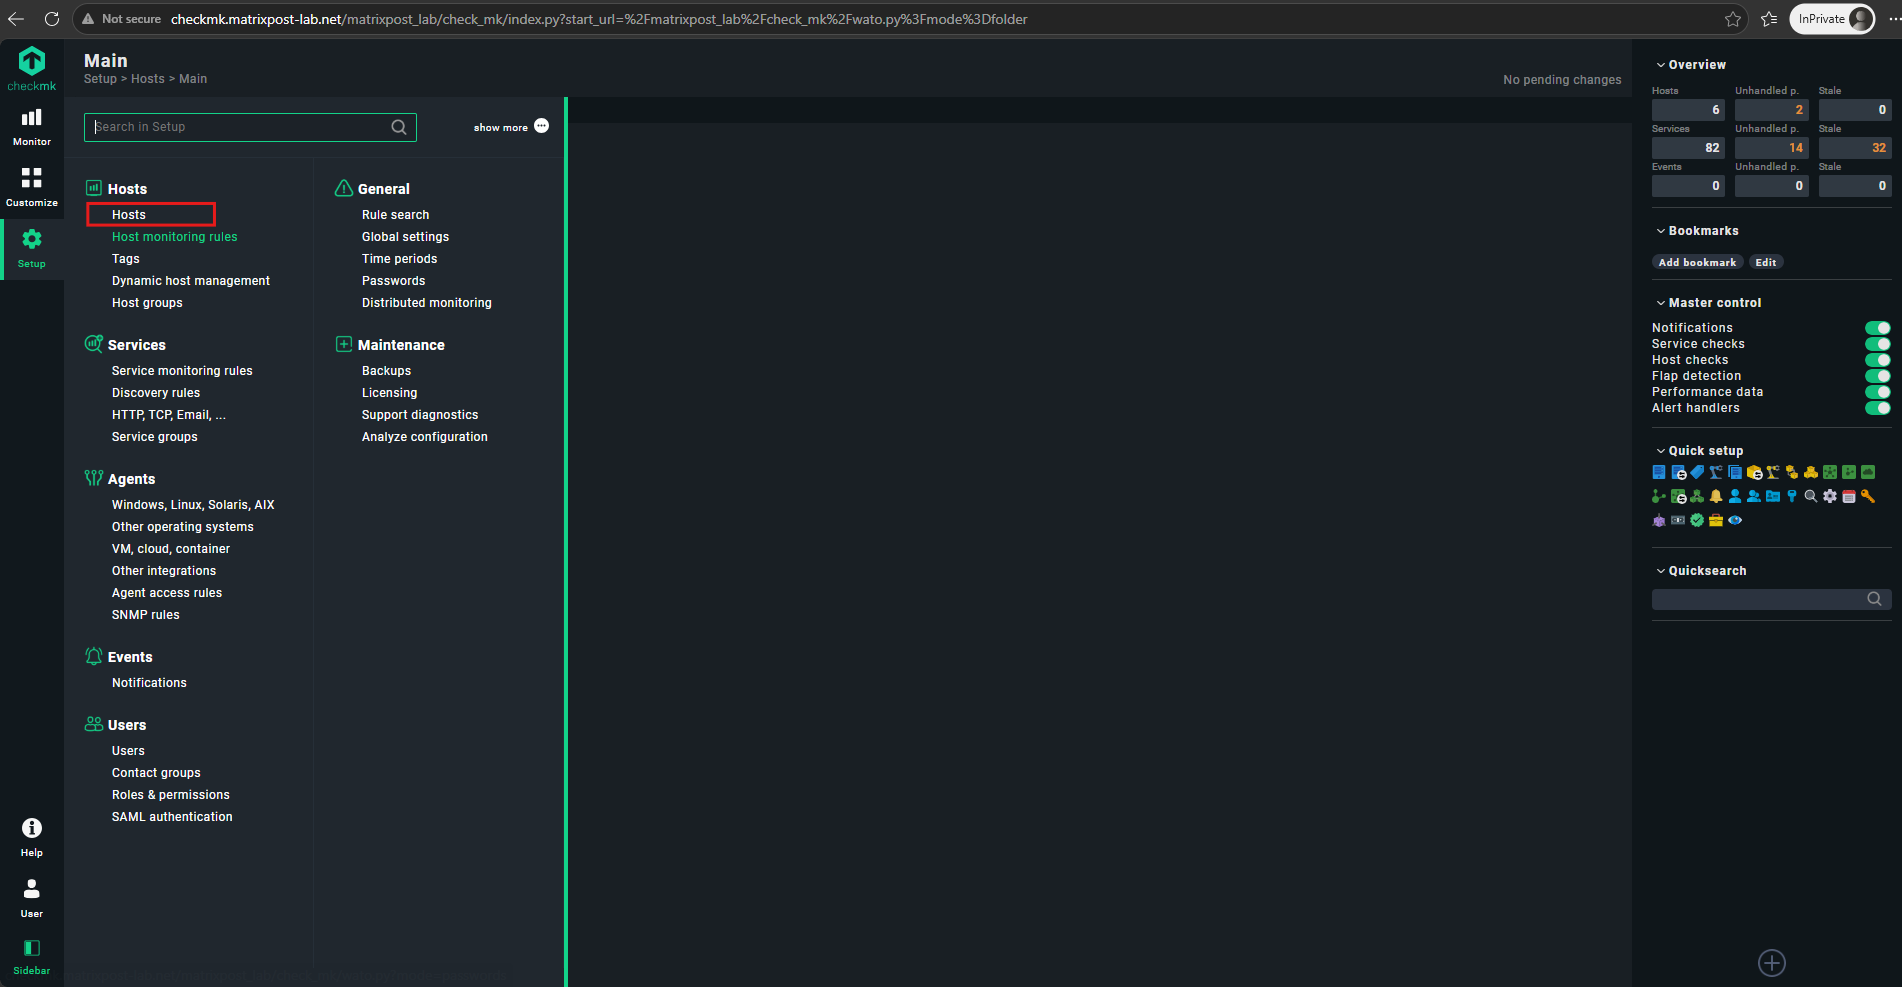
In the host configuration, click Add host to create a new Checkmk host representing our ONTAP Select cluster.
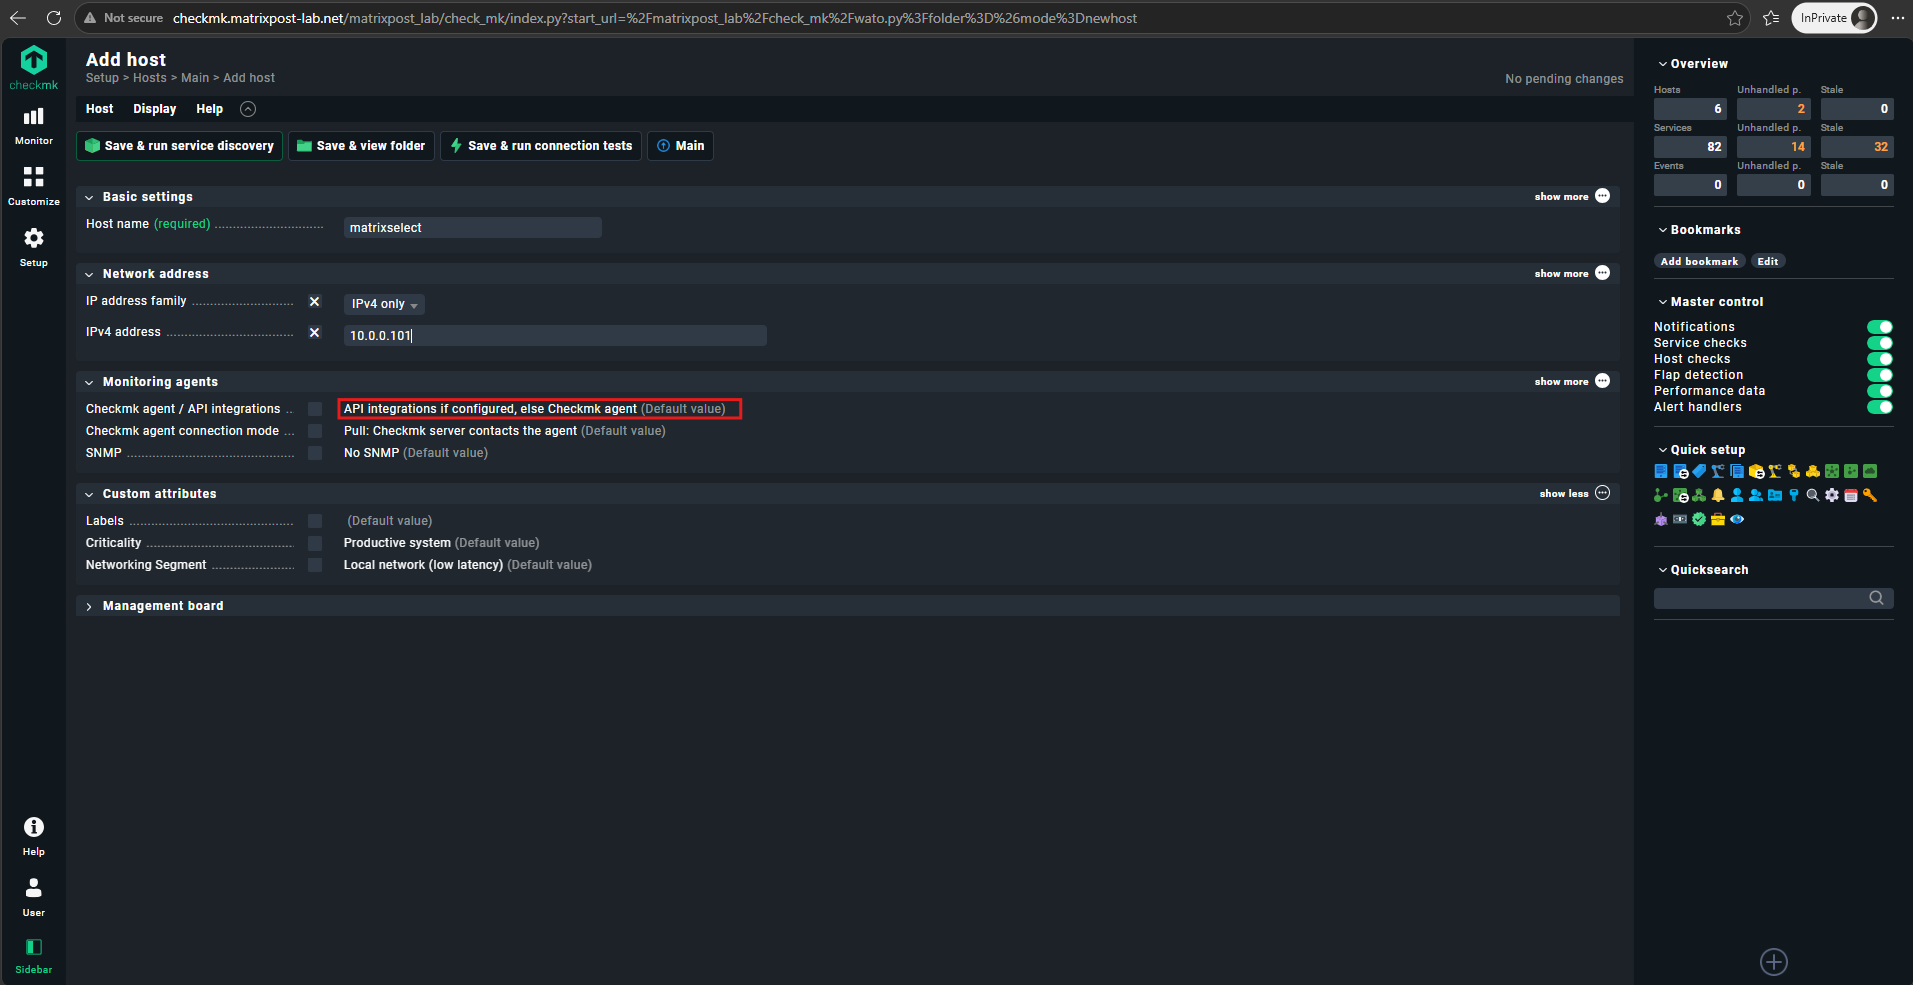
Add the ONTAP cluster as a new host using matrixselect as the host name and the cluster management IP address 10.0.0.101.
The default setting API integrations if configured already, else Checkmk agent can remain unchanged, as the NetApp REST API integration will provide the monitoring data once the corresponding rule is assigned to this host.
Click Save & view folder.
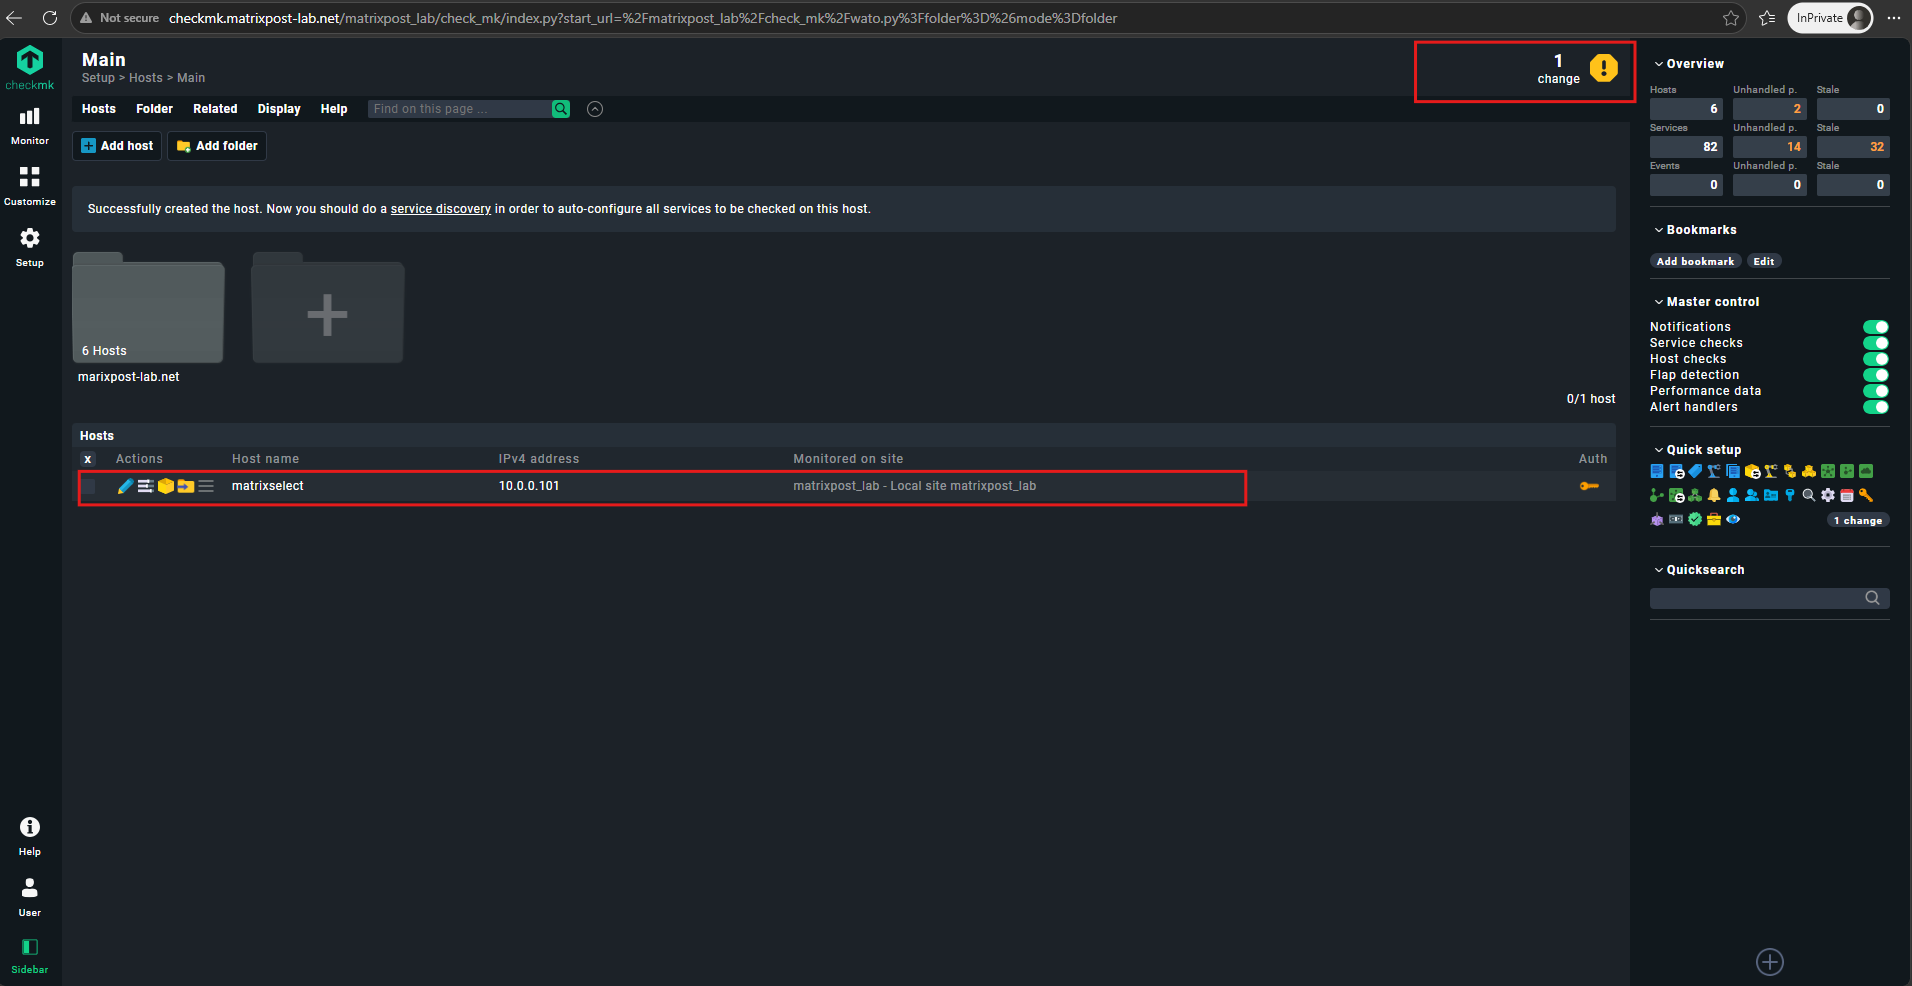
The ONTAP cluster is now configured as the Checkmk host matrixselect using its cluster management IP address 10.0.0.101.
The new host configuration is initially shown as a pending change. Click the exclamation mark in the upper-right corner and activate the pending changes to make the new matrixselect host configuration active on the Checkmk site.
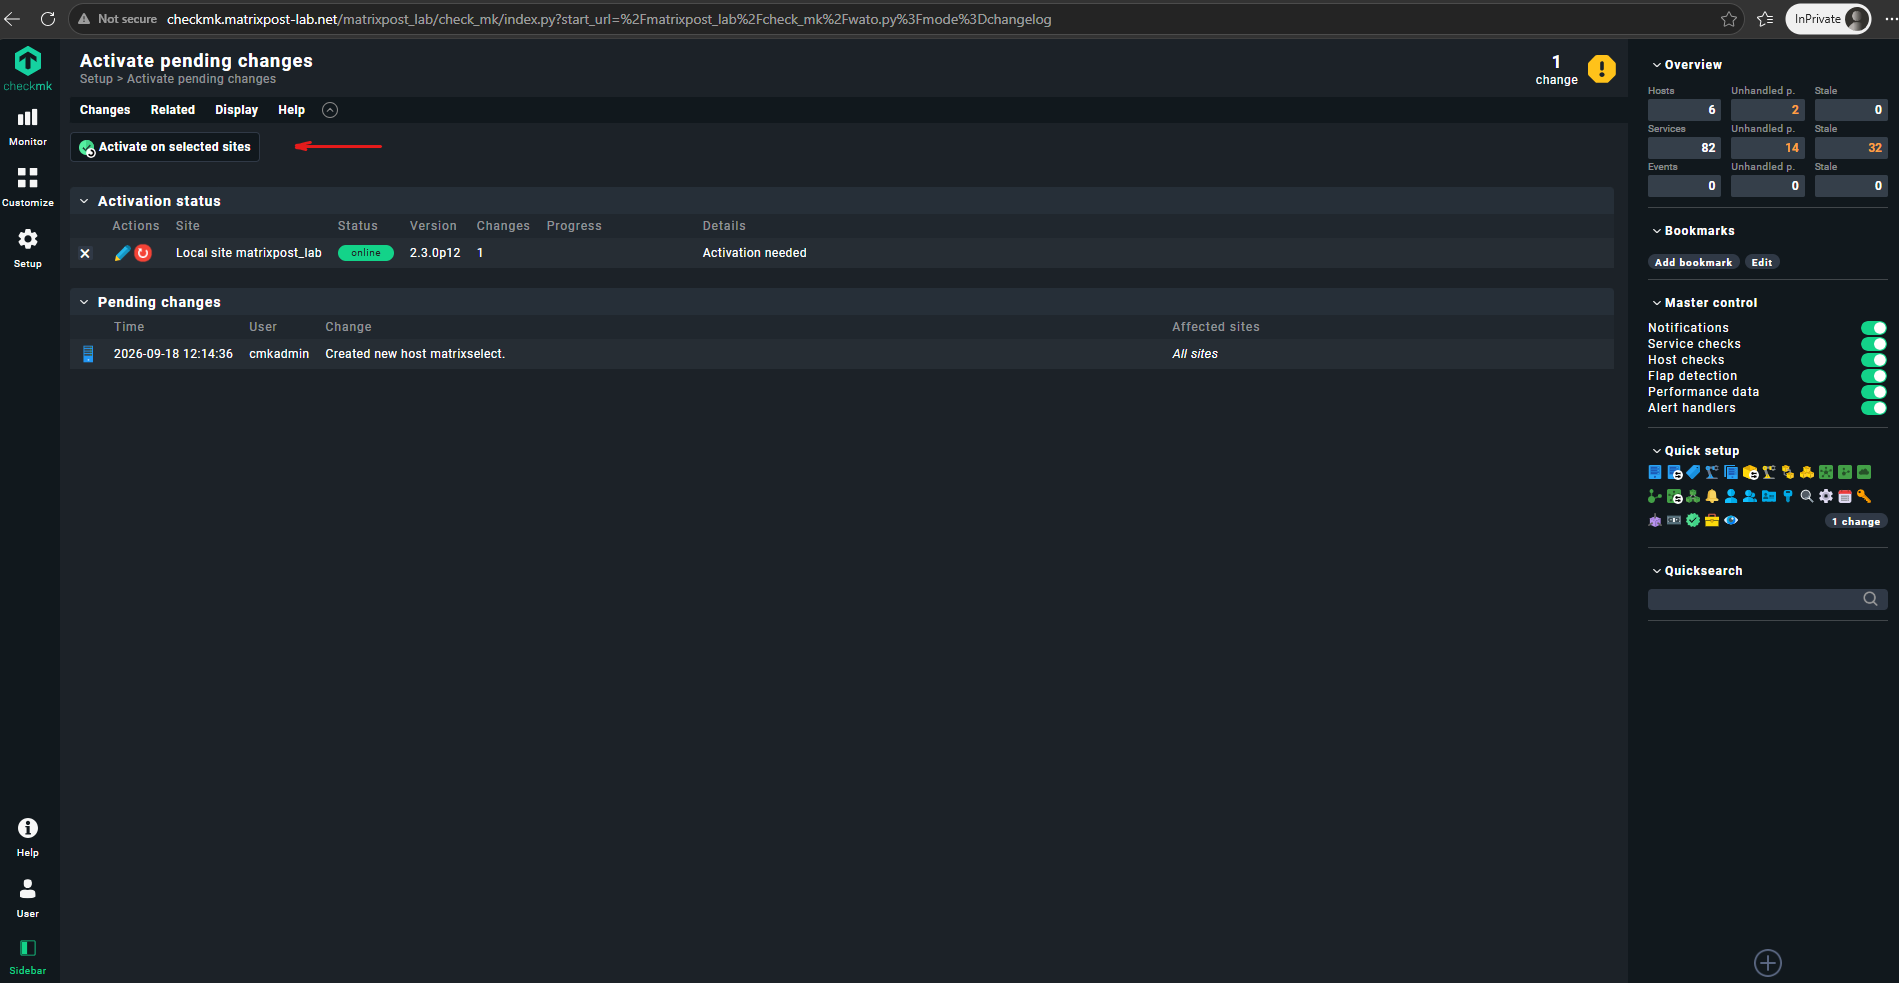
After the matrixselect host has been added and activated, return to the NetApp via Ontap REST API integration rule.
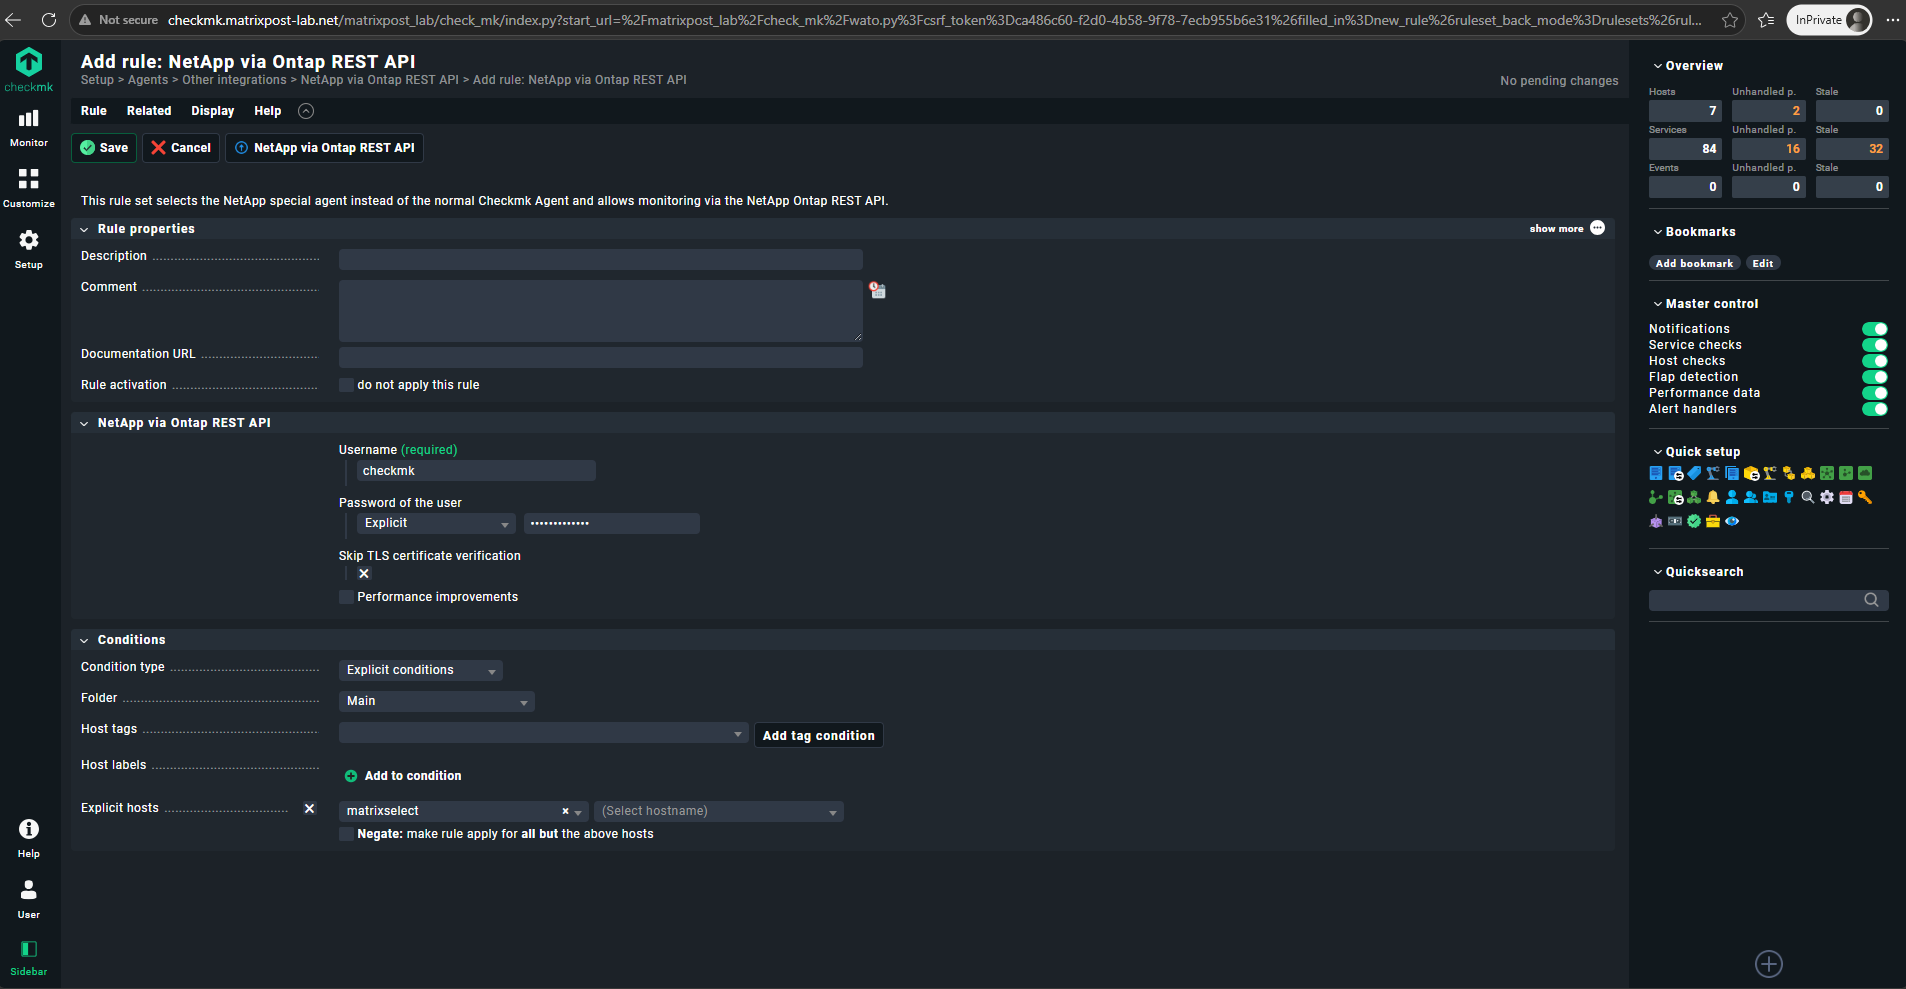
Under Conditions → Explicit hosts, select matrixselect to ensure that this REST API configuration and its credentials are applied only to our ONTAP Select cluster.
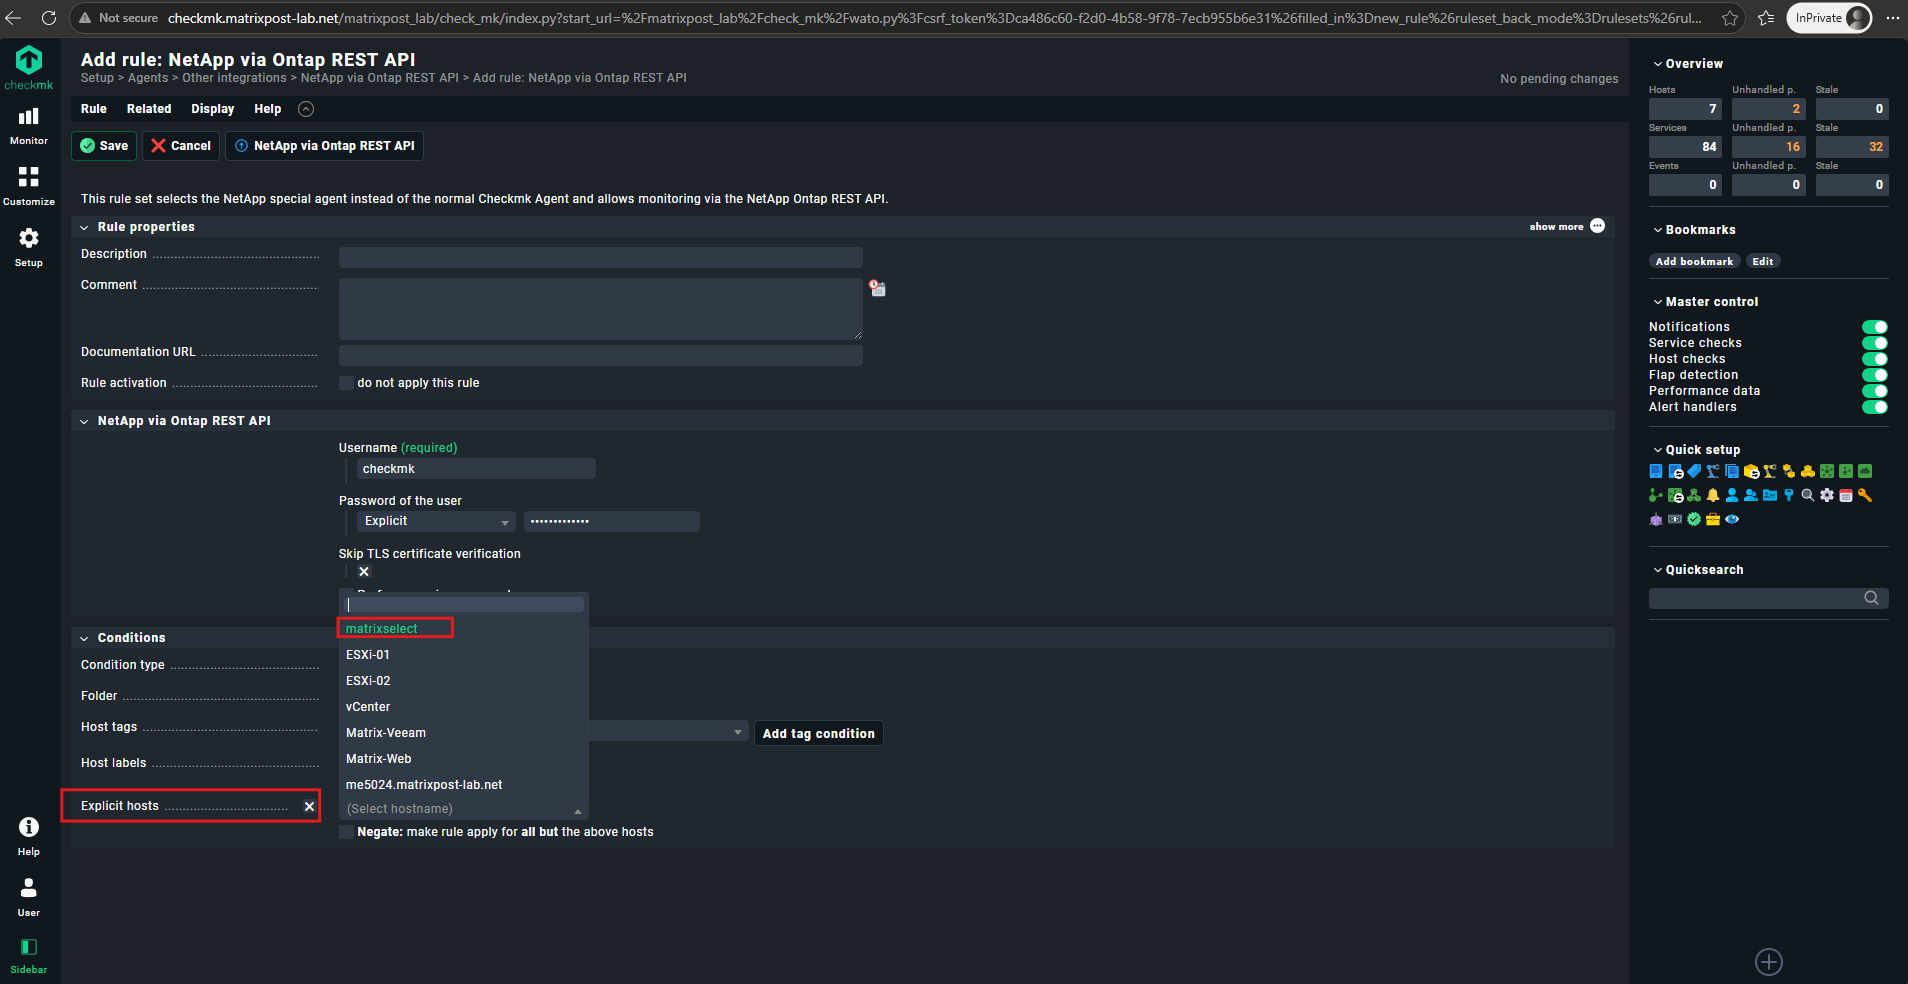
Click Save now. Then activate the pending change, and after that we can finally run service discovery against matrixselect and see what ONTAP services Checkmk pulls through the REST API.
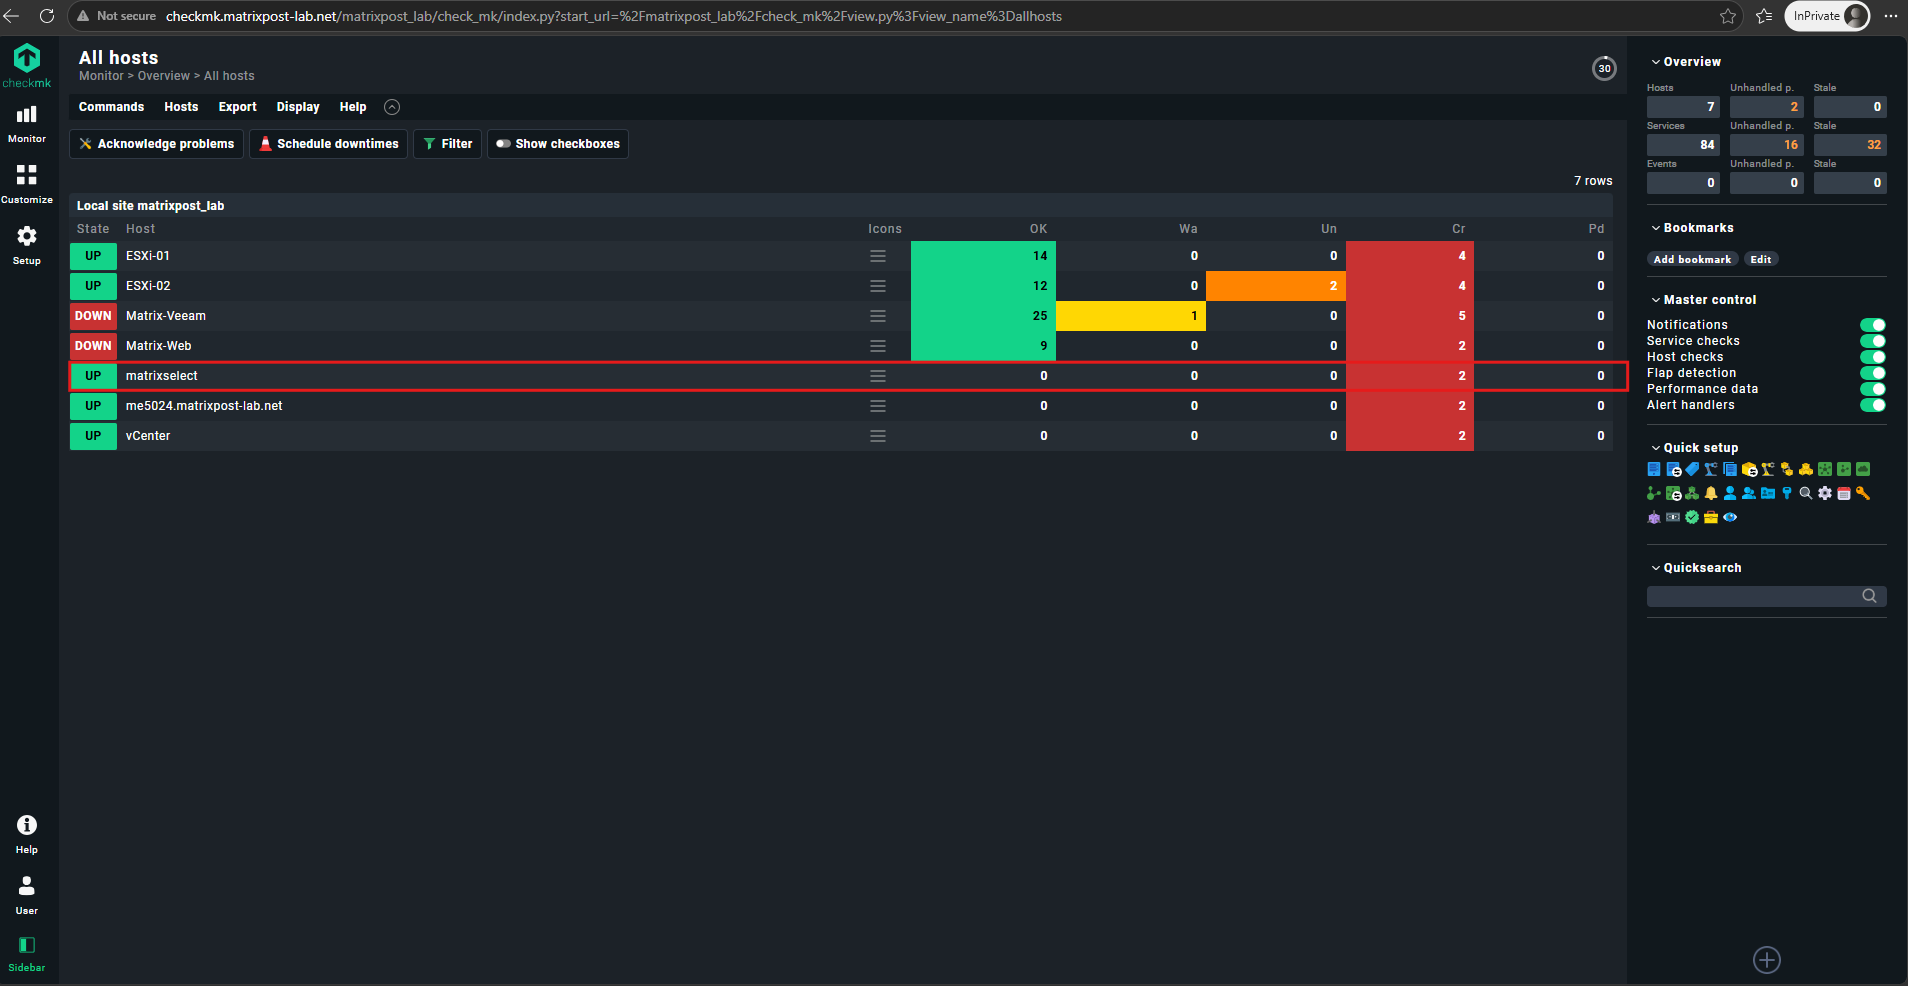
After activating the REST API integration rule, the ONTAP host matrixselect appears as UP in Checkmk.
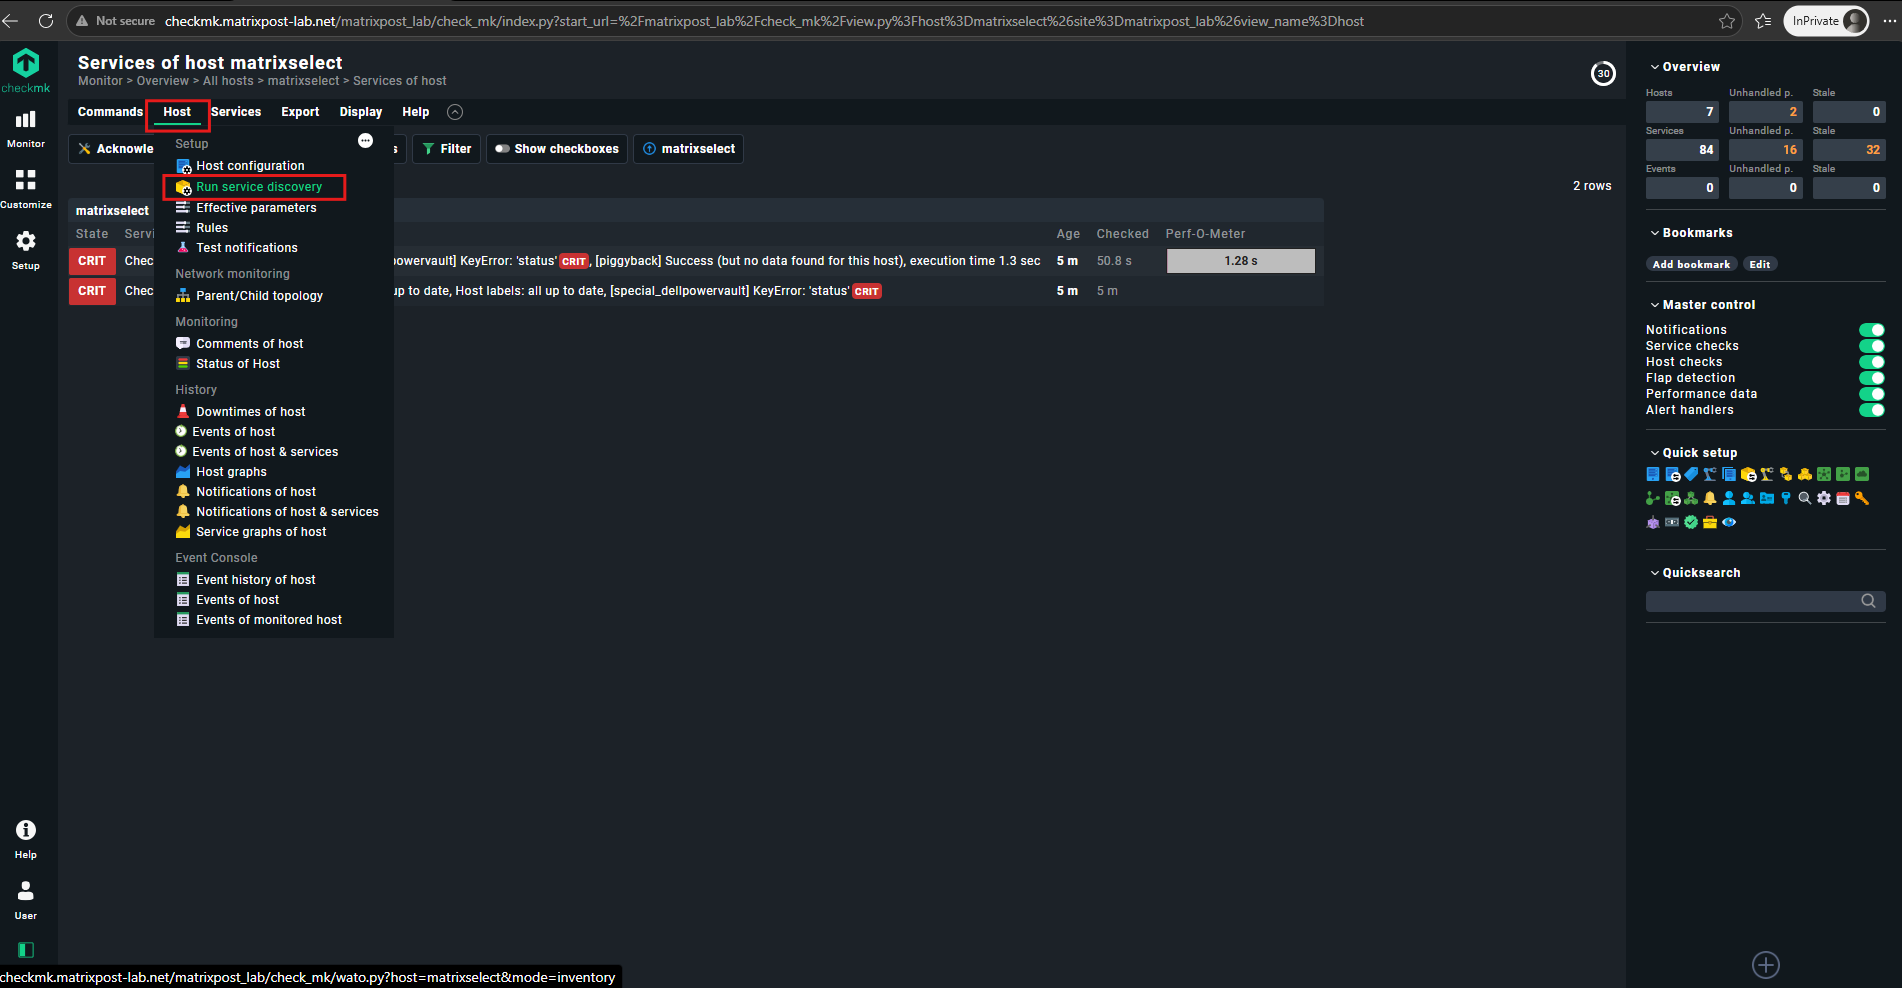
Click the matrixselect host to open its monitoring details and run the service discovery to detect the available ONTAP services and volumes.
From the host details, open the Host menu and select Run service discovery.
Checkmk will then query the ONTAP cluster through the configured REST API integration and discover the available ONTAP monitoring services, including its storage volumes.
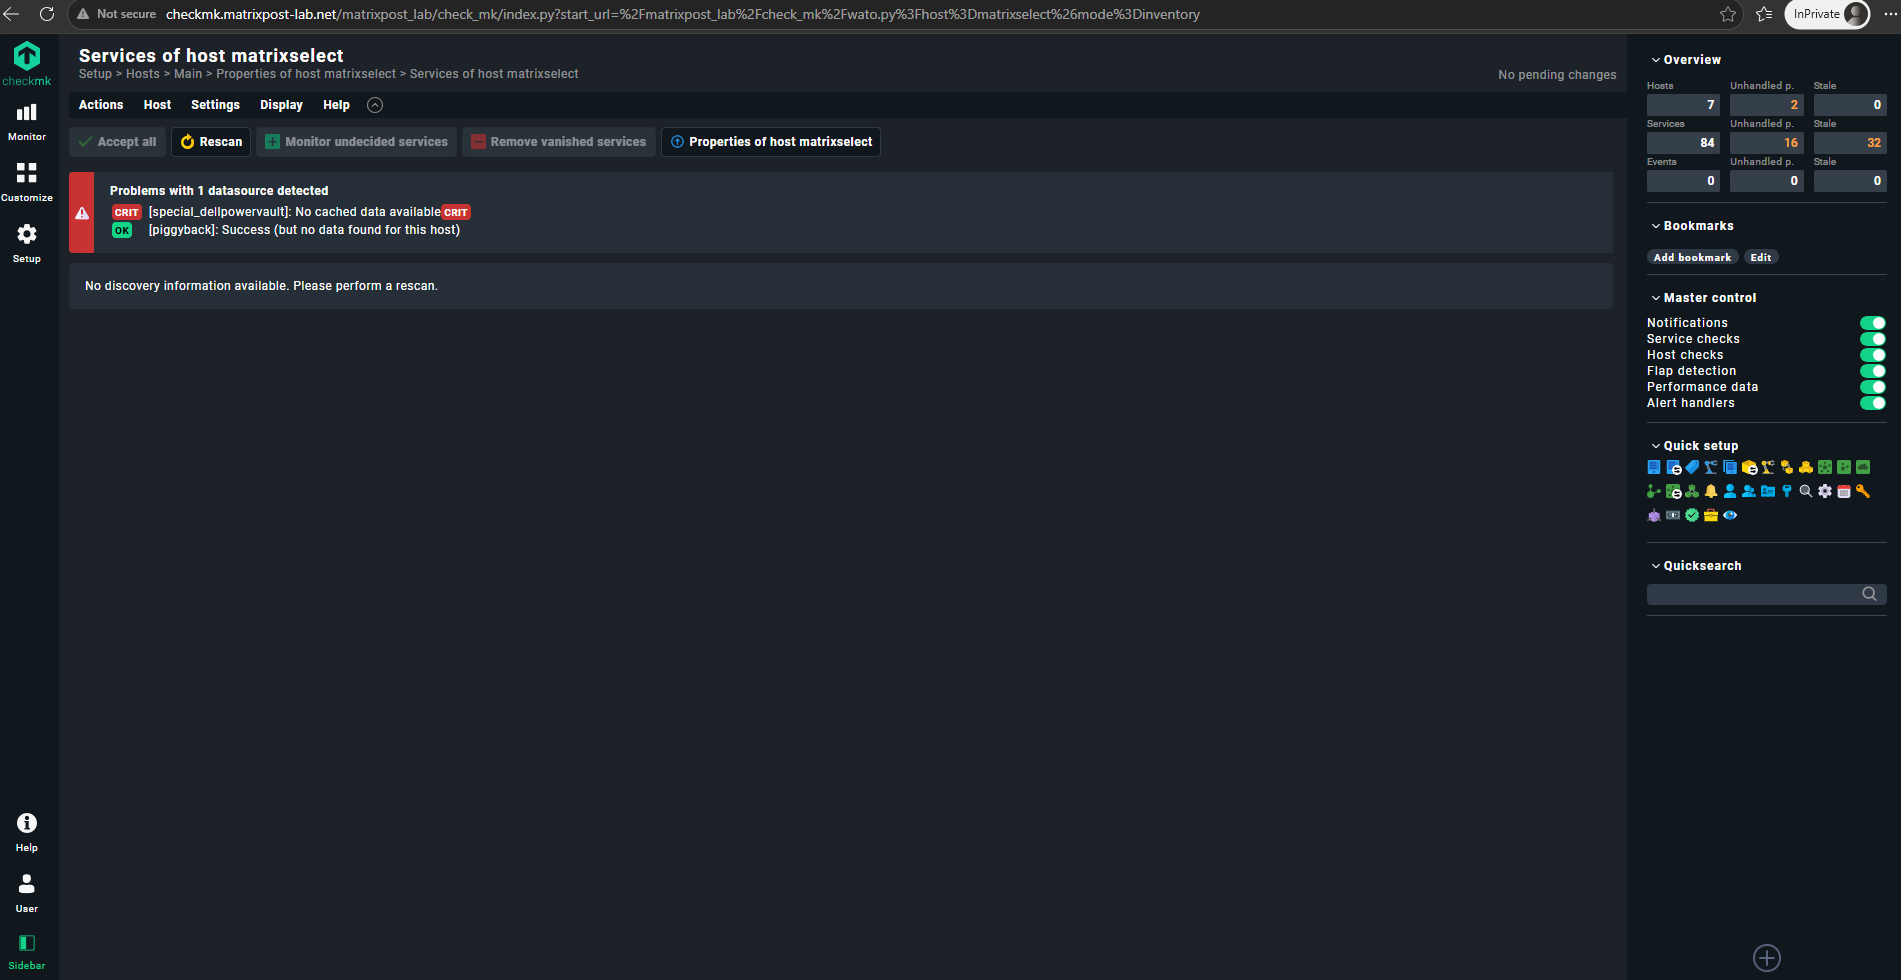
Because no discovery data exists for the newly configured host yet, click Rescan to query the ONTAP cluster through the REST API and discover the available monitoring services.
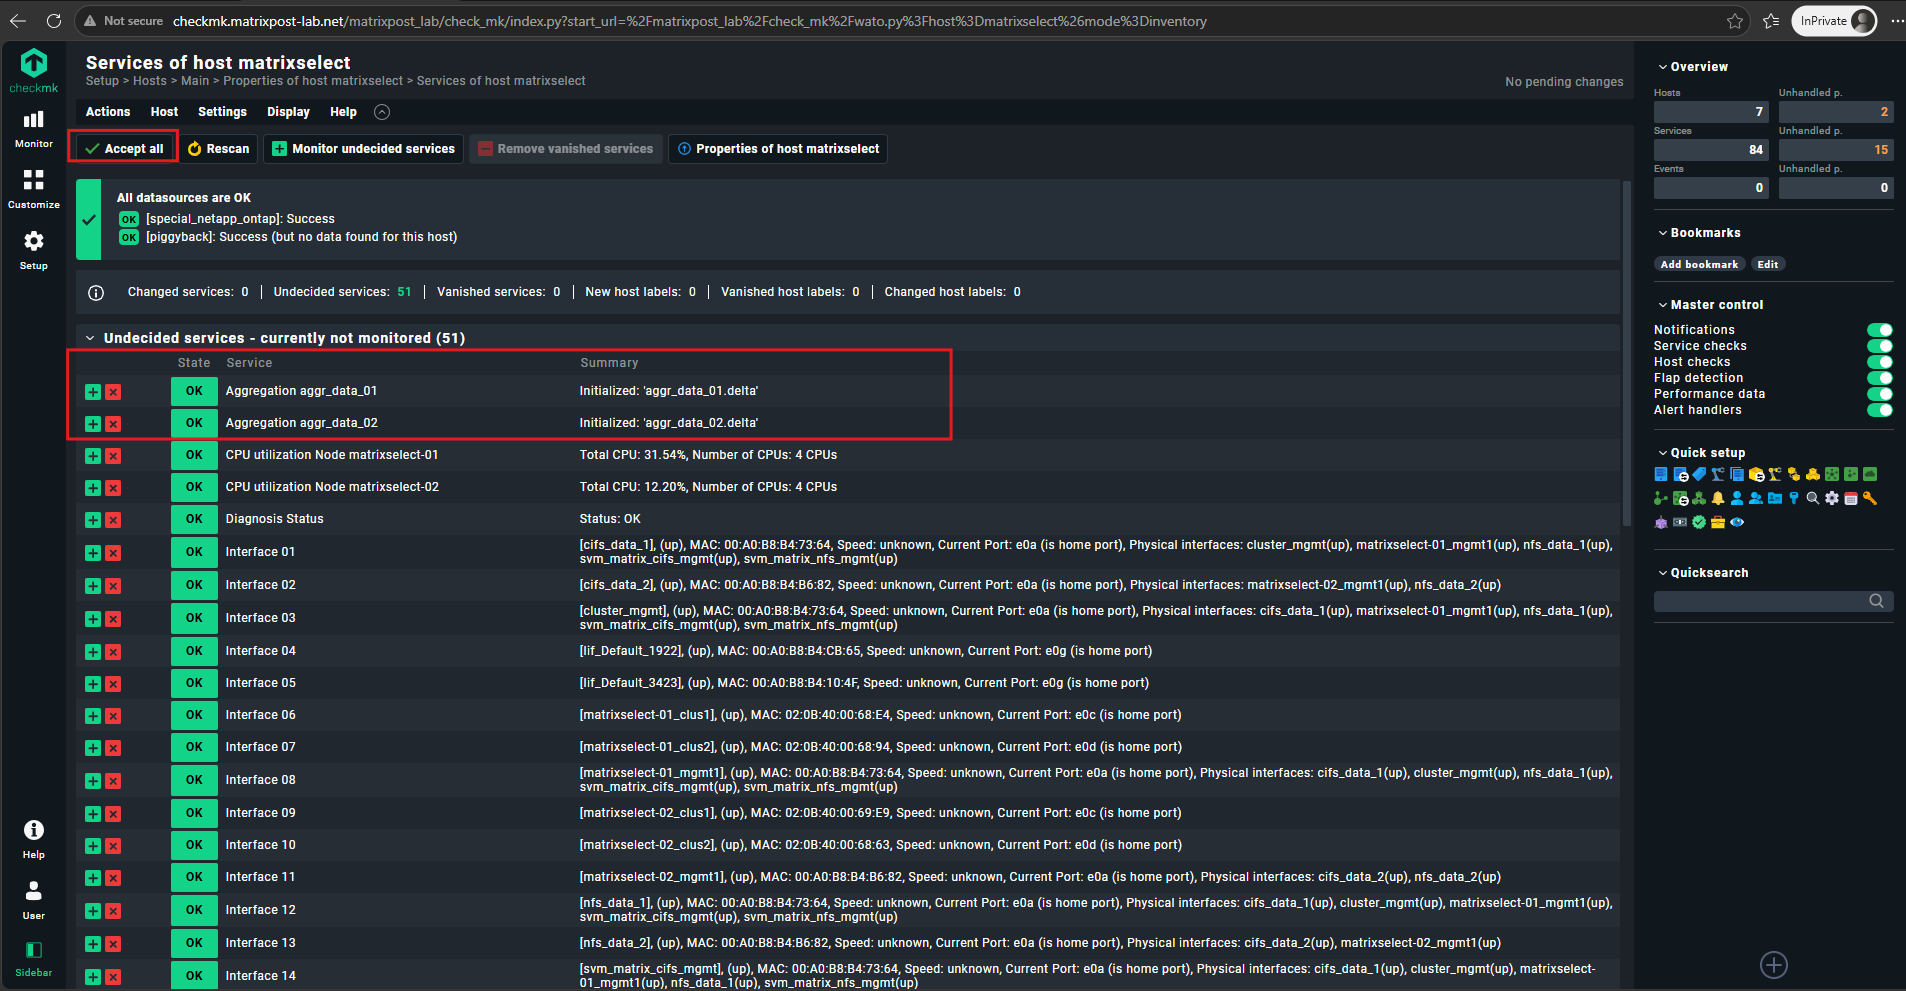
After a successful service discovery, Checkmk lists 51 newly discovered services that are not yet monitored.
We can already see both ONTAP aggregates,
aggr_data_01andaggr_data_02, among the discovered services; click Accept all to add all discovered services to the monitoring configuration.
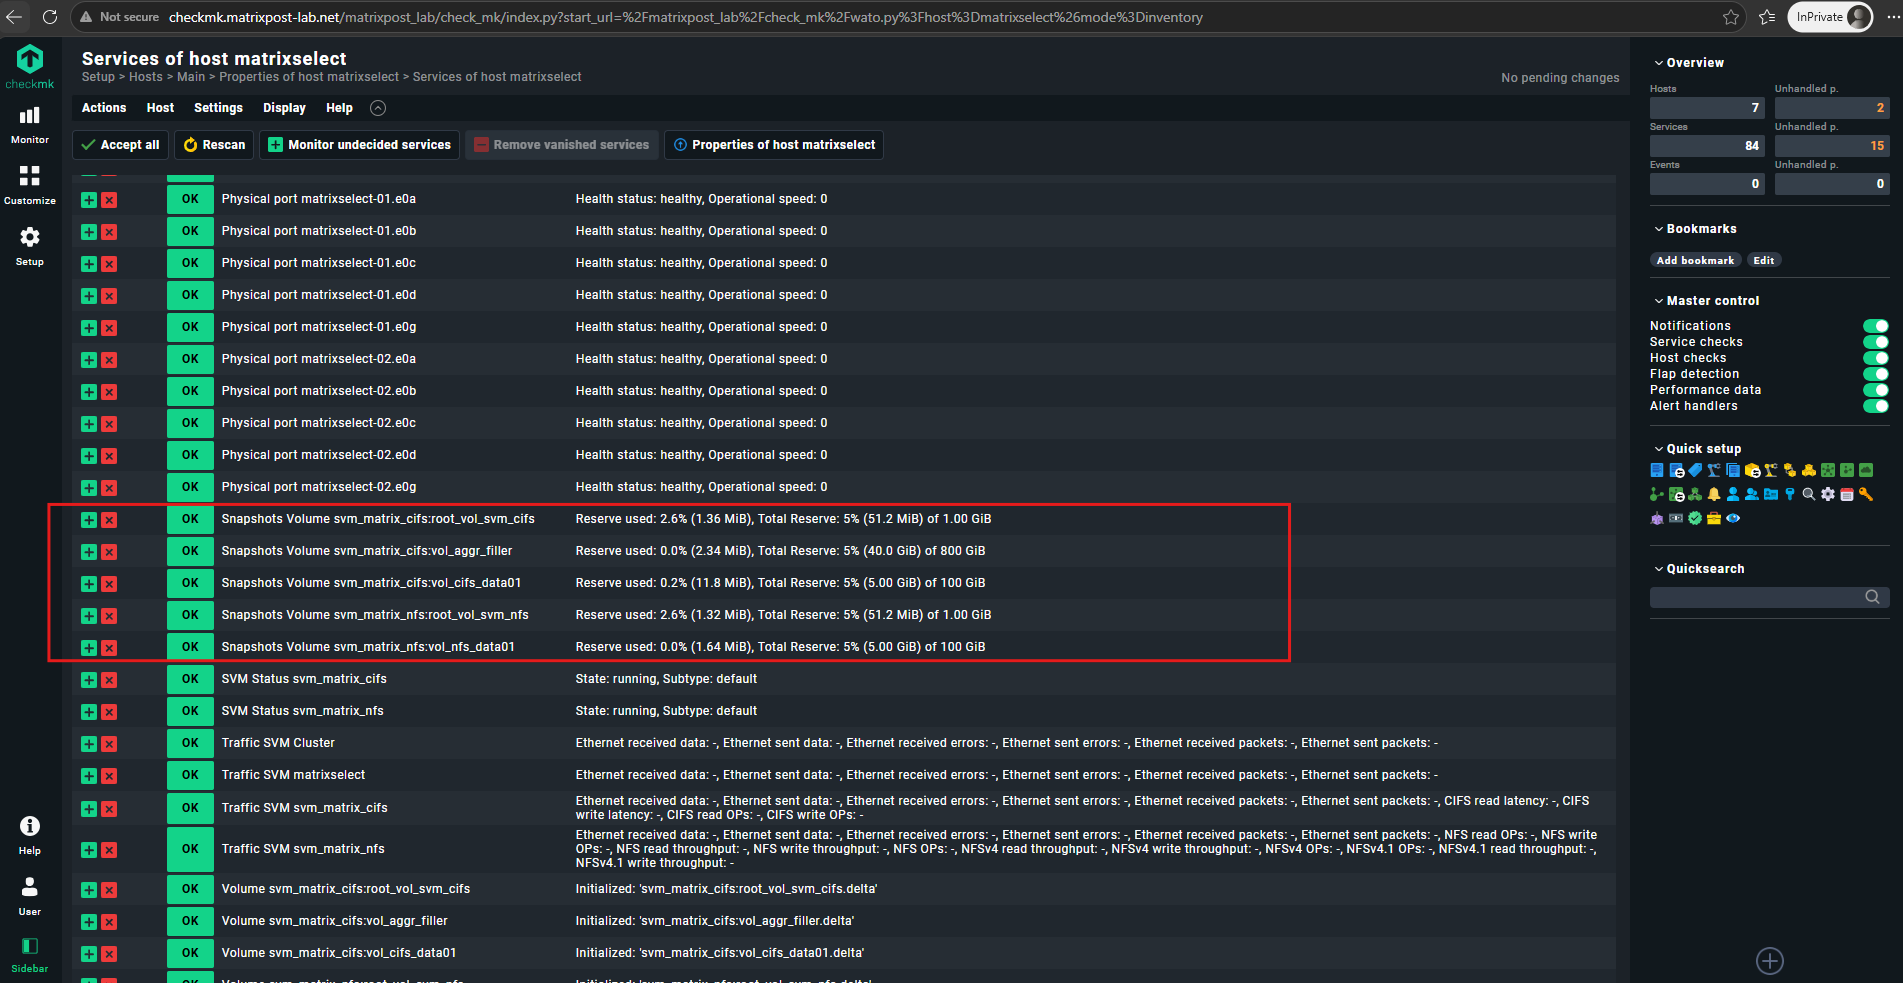
The service discovery also detects the individual ONTAP volumes and their associated snapshot services. This includes our
svm_matrix_cifs:vol_cifs_data01test volume as well as the temporaryvol_aggr_fillervolume used to reduce the available capacity of the local performance tier.
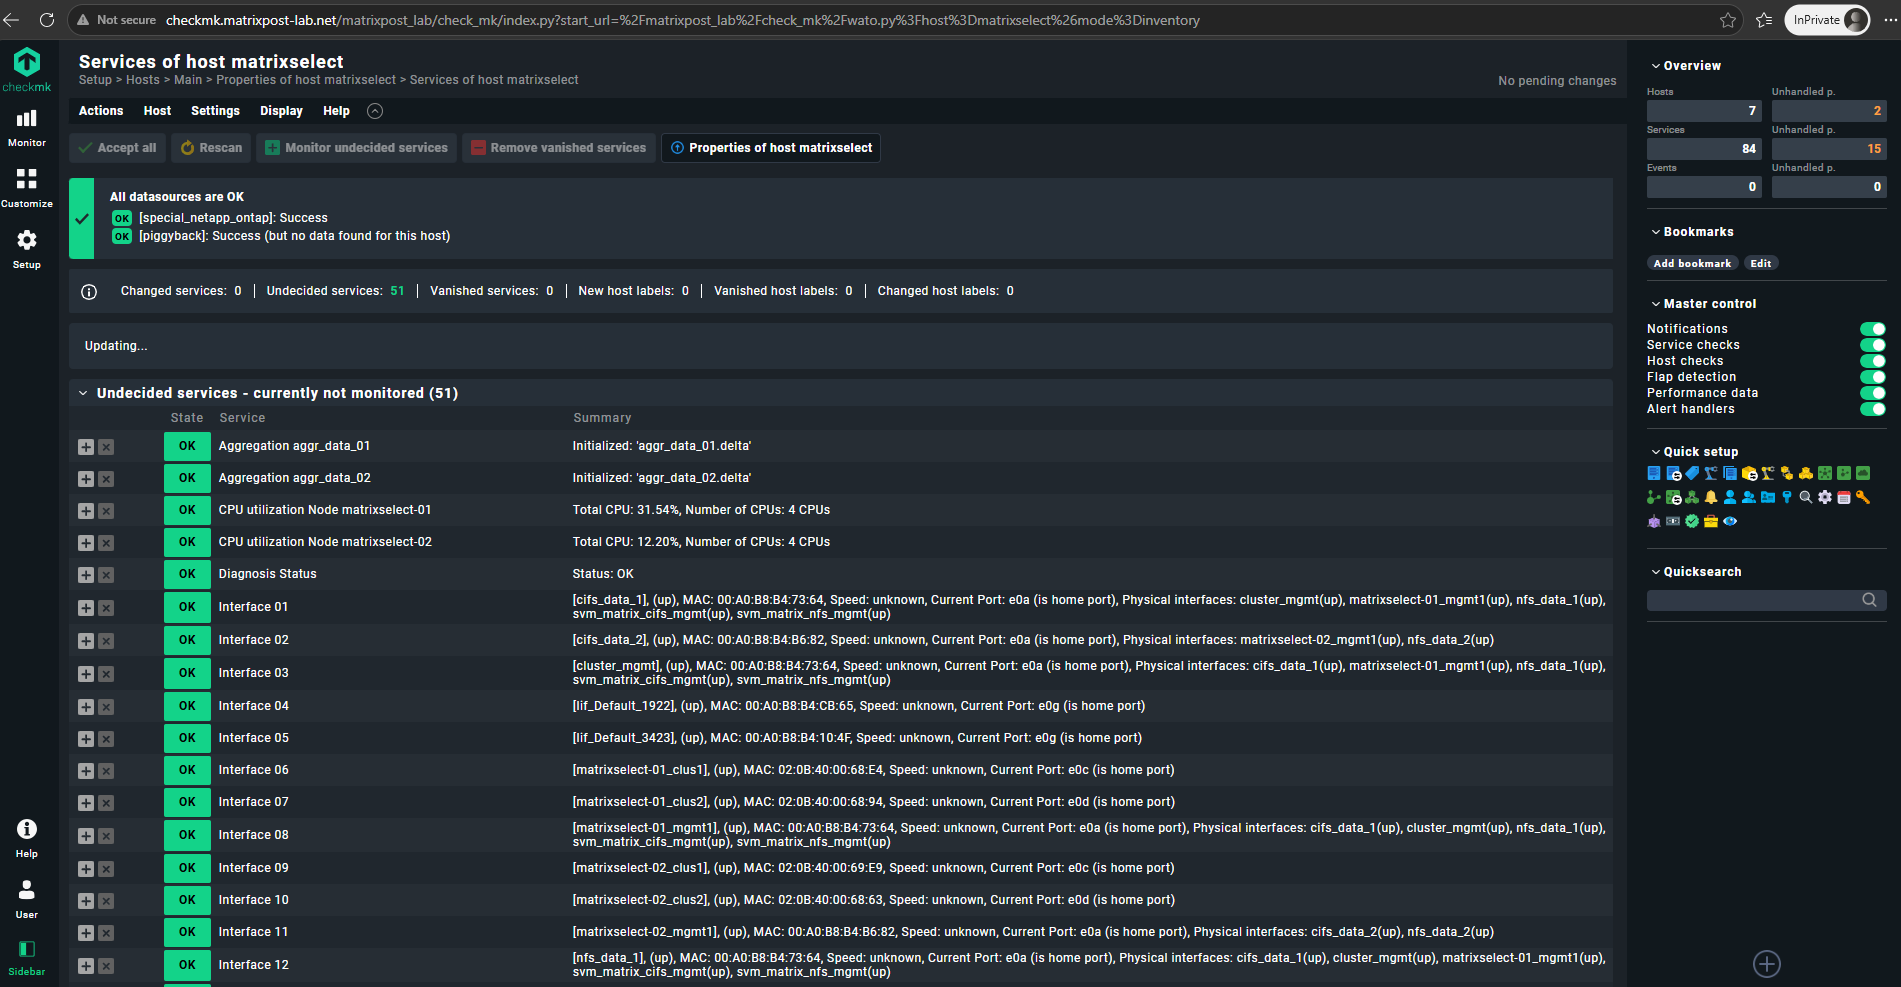
After accepting all discovered services, Checkmk updates the monitoring configuration and adds the newly discovered ONTAP services to the host.
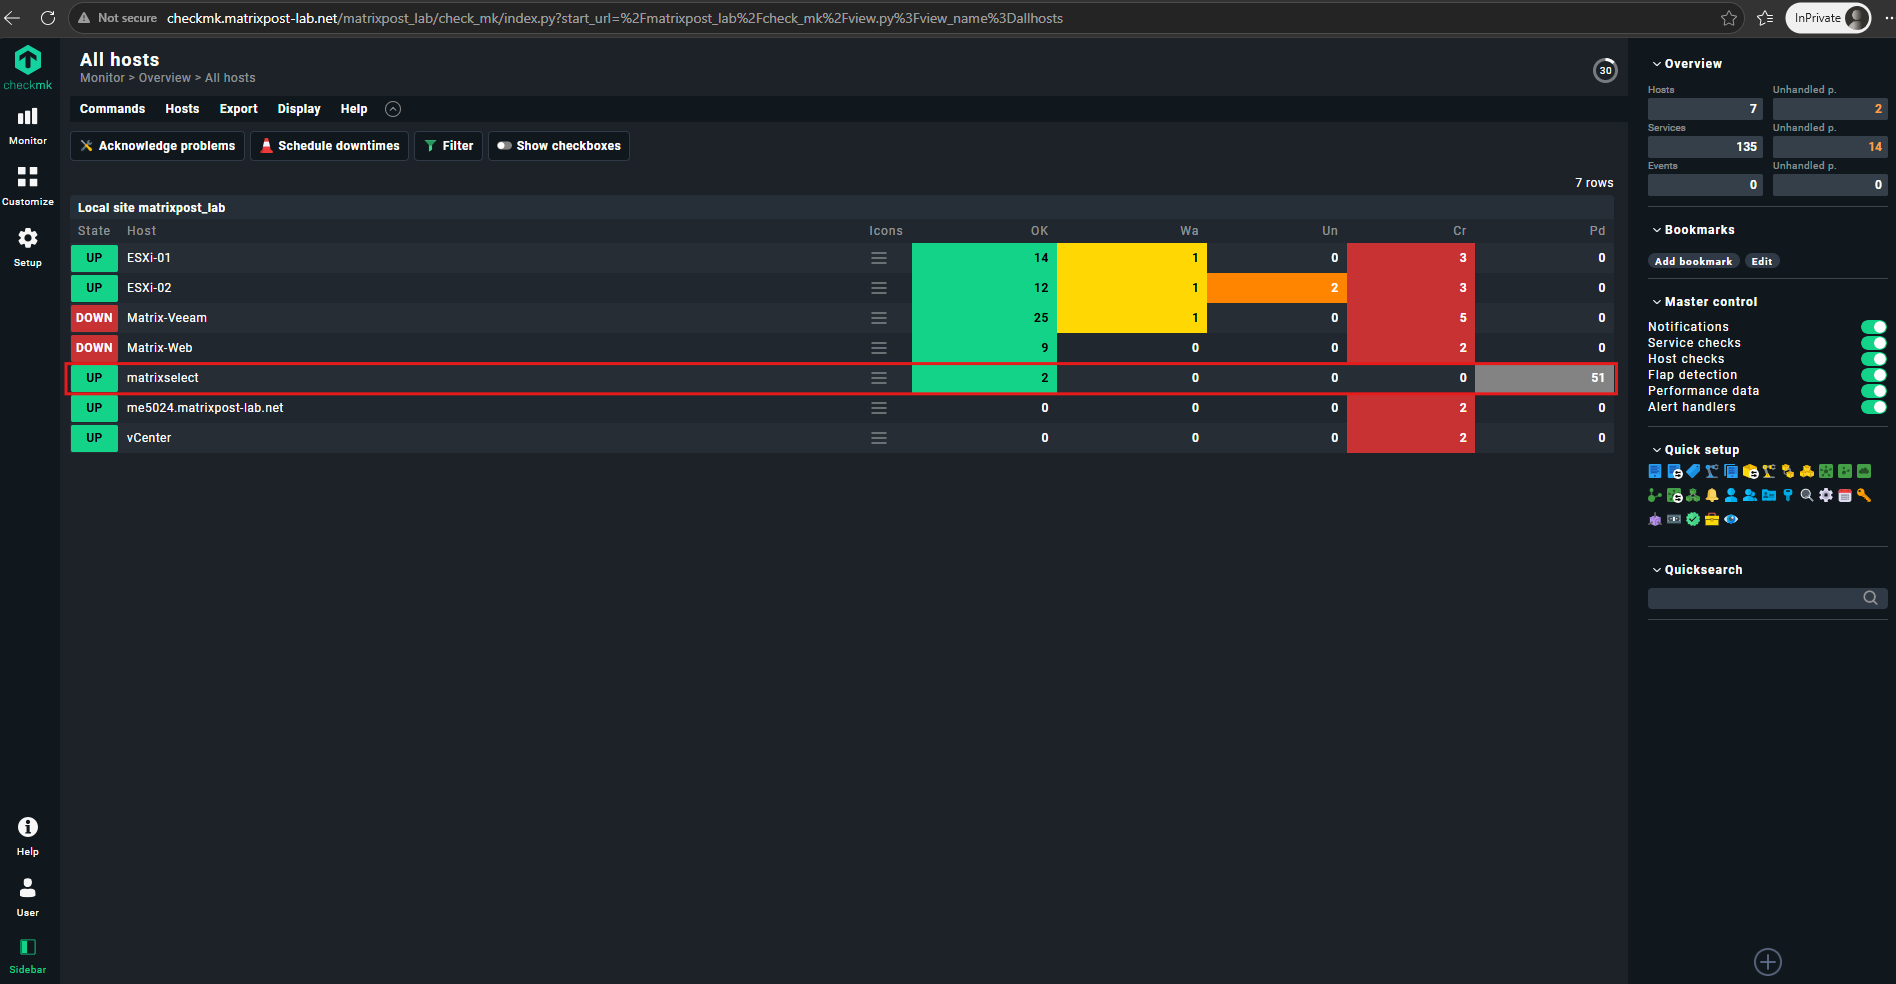
Back in the All hosts view, the ONTAP cluster matrixselect is now shown as UP.
The accepted ONTAP services must also be activated to become part of the active monitoring configuration. In our case, the changes have already been activated and the
matrixselecthost is shown as UP.
Links
volume show
https://docs.netapp.com/us-en/ontap-cli-9171/volume-show.htmlLearn about SAN volume provisioning
https://docs.netapp.com/us-en/ontap/volumes/san-volumes-concept.htmlDetermine space usage in an ONTAP volume or aggregate
https://docs.netapp.com/us-en/ontap/volumes/determine-space-usage-volume-aggregate-concept.htmlvolume create
https://docs.netapp.com/us-en/ontap-cli/volume-create.htmlSpecial agents
https://docs.checkmk.com/latest/en/special_agents.htmlCatalog of Check Plug-ins
https://checkmk.com/integrationsWerk #16767: NetApp via WebAPI: remove deprecated agent and plugin
https://checkmk.com/werk/16767