Capturing Network Packet Traces in NetApp ONTAP for NFS and CIFS Troubleshooting
When an NFS or CIFS/SMB client cannot mount or access a share, basic connectivity tests alone may not reveal where the communication is failing.
NetApp ONTAP provides a built-in network trace facility that allows packet captures directly on the physical network port hosting the SVM data LIF, making it possible to determine whether client traffic actually reaches the ONTAP system and whether ONTAP sends a response.
In this article, we will capture network traffic directly on an ONTAP node, filter the trace for a specific client, and analyze the resulting capture in Wireshark.
This is particularly useful for distinguishing between an ONTAP-side issue and an upstream network, firewall, NSG, routing, or security-appliance problem when troubleshooting failed NFS mounts or CIFS/SMB connections.
Starting a Network Packet Trace on ONTAP
Before starting the packet capture, first identify the ONTAP node and physical port currently hosting the SVM data LIF involved in the communication.
The trace can then be started directly on that interface and optionally filtered by the client IP address, allowing us to capture only the traffic relevant to the NFS or CIFS/SMB connection we want to troubleshoot.
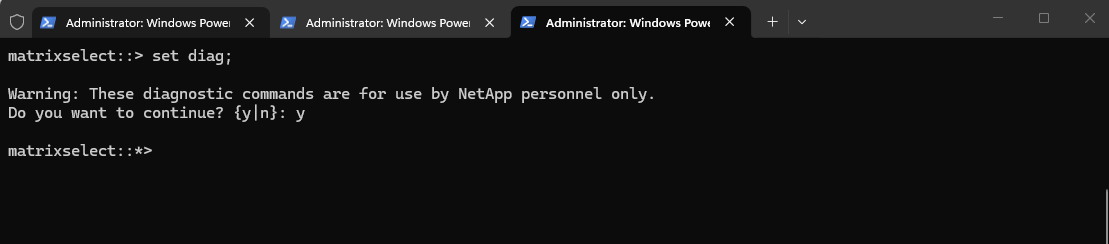
The network trace command is available only at ONTAP diagnostic privilege level. Switch to diagnostic mode using set diag; ONTAP displays a warning because commands at this privilege level are intended primarily for troubleshooting by NetApp personnel.
set diag;
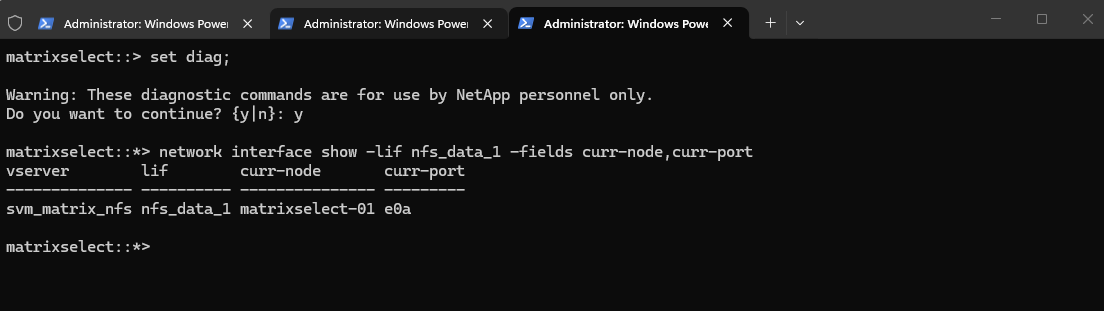
Before starting the trace, identify the current node and physical network port hosting the SVM data LIF involved in the communication. In our example, the NFS data LIF nfs_data_1 is currently hosted on node matrixselect-01 using physical port e0a; these values are required when starting the packet trace.
network interface show -lif nfs_data_1 -fields curr-node,curr-port
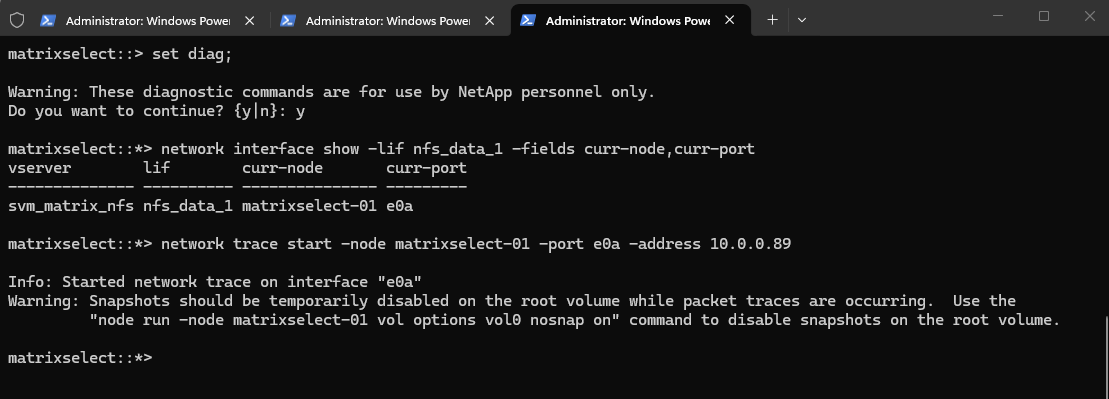
With the hosting node and physical port identified, we can start the packet trace using network trace start. The -address parameter limits the capture to traffic associated with the specified client IP address (10.0.0.89), significantly reducing unrelated traffic in the resulting trace.
Note: ONTAP recommends temporarily disabling snapshots on the node root volume while packet tracing is active, as trace files are stored on the root volume and can generate additional snapshot space consumption. For short, targeted captures, the resulting space consumption is typically minimal.
network trace start -node matrixselect-01 -port e0a -address 10.0.0.89
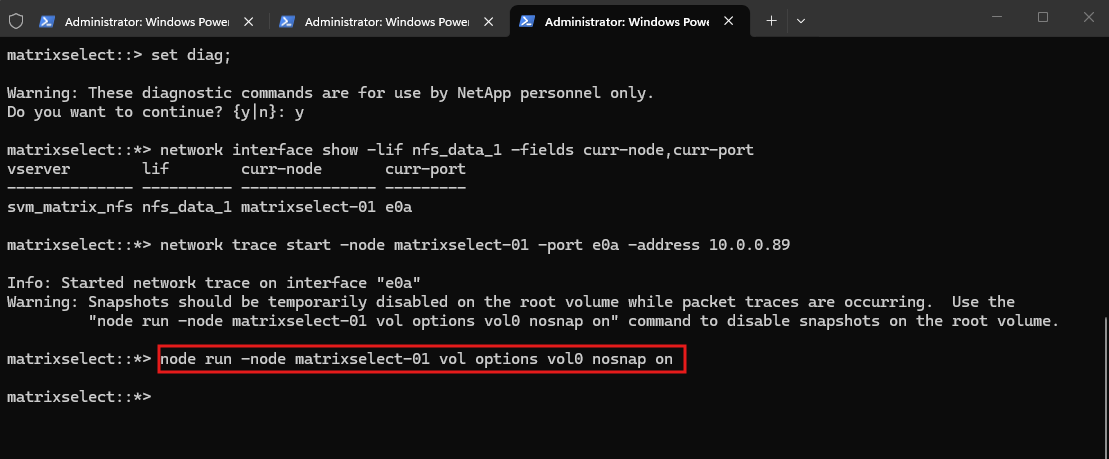
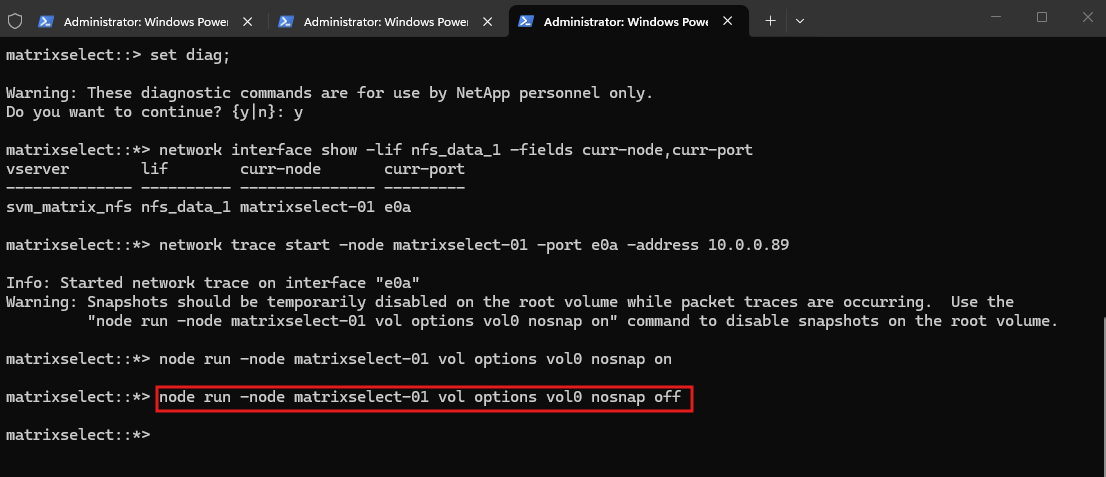
To disable the snapshots temporarily on the node root volume run the command below as shown by ONTAP above when starting the trace.
While the packet trace is running, ONTAP recommends temporarily disabling snapshots on the node root volume.
node run -node matrixselect-01 vol options vol0 nosnap on
To enable it again run:
node run -node matrixselect-01 vol options vol0 nosnap off
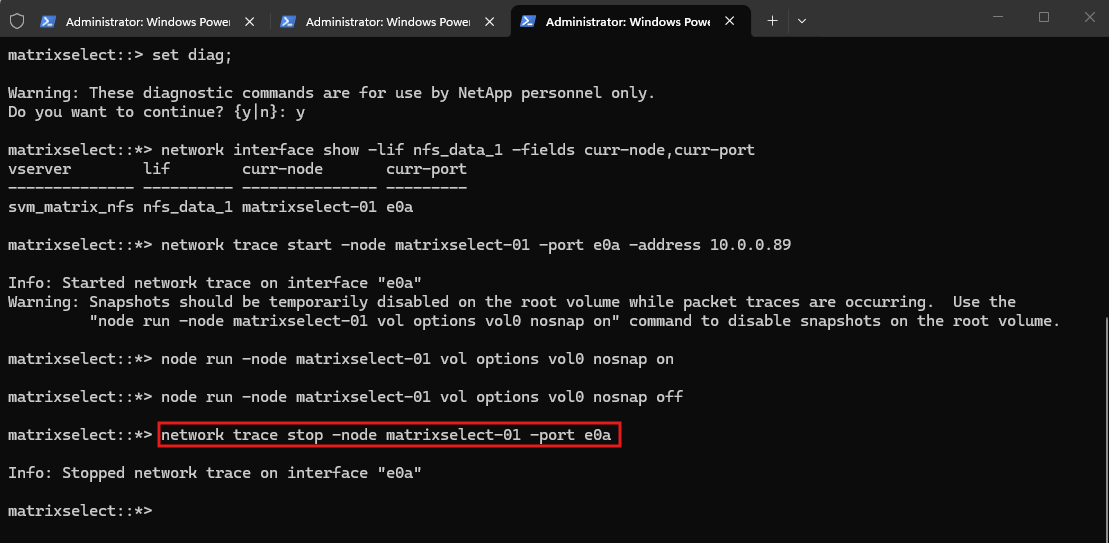
Once the required traffic has been captured, stop the packet trace using network trace stop on the same node and physical port on which it was started. ONTAP then finalizes the trace file for subsequent analysis.
network trace stop -node matrixselect-01 -port e0a
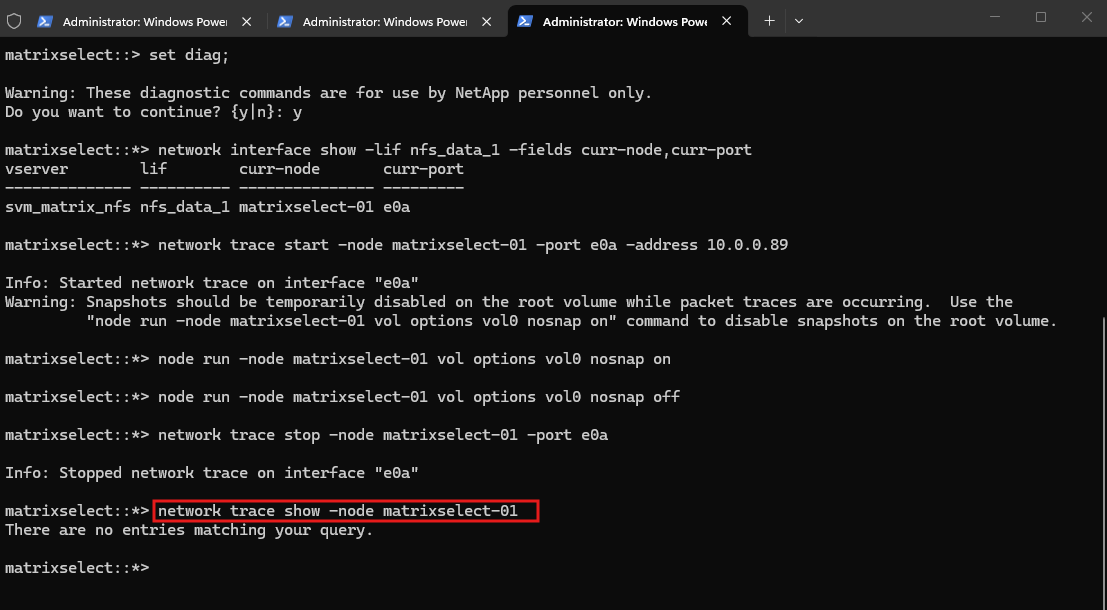
The network trace show command displays only currently active packet traces. After the trace has been stopped, no entry is returned even though the completed trace file remains stored on the node.
network trace show -node matrixselect-01
Downloading the ONTAP Packet Trace
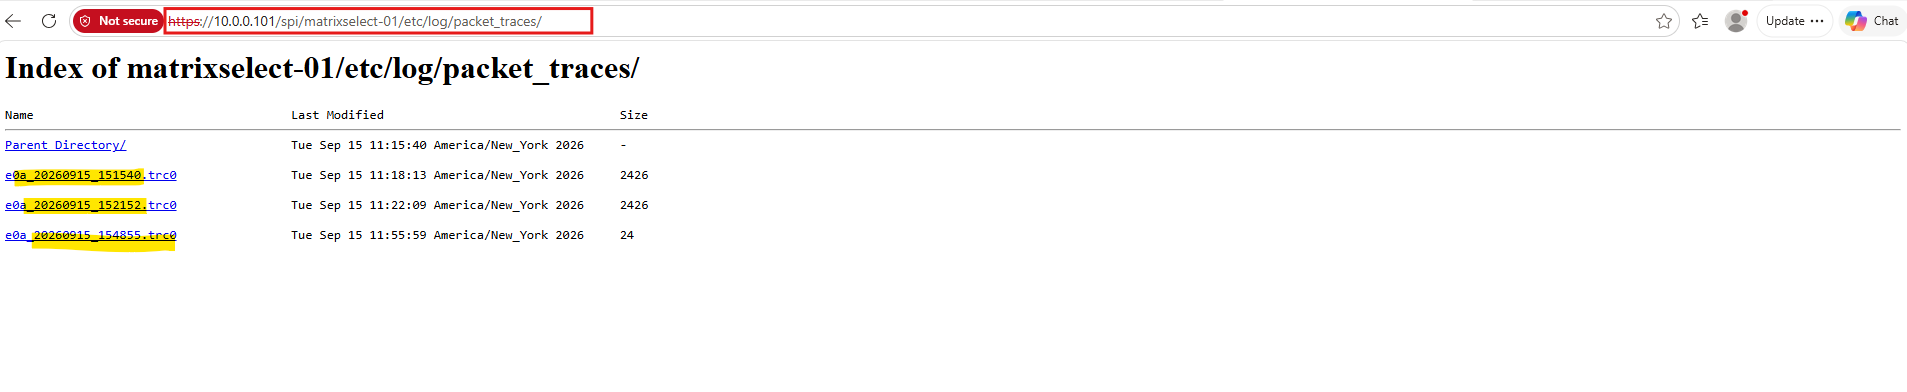
Completed packet traces are stored on the ONTAP node under /etc/log/packet_traces/ and can be downloaded through the node’s SPI web interface.
The generated
.trc0files can then be opened directly in Wireshark for detailed packet analysis.
http(s)://<CLUSTER_MGMT_IP>/spi/<NODE_NAME>/etc/log/packet_traces/
Deleting Packet Trace Files from ONTAP
After downloading and analyzing the packet trace, the trace files should be removed from the node to avoid unnecessarily consuming space on the node root volume. Existing trace files can first be listed with:
set diag;
network trace file show
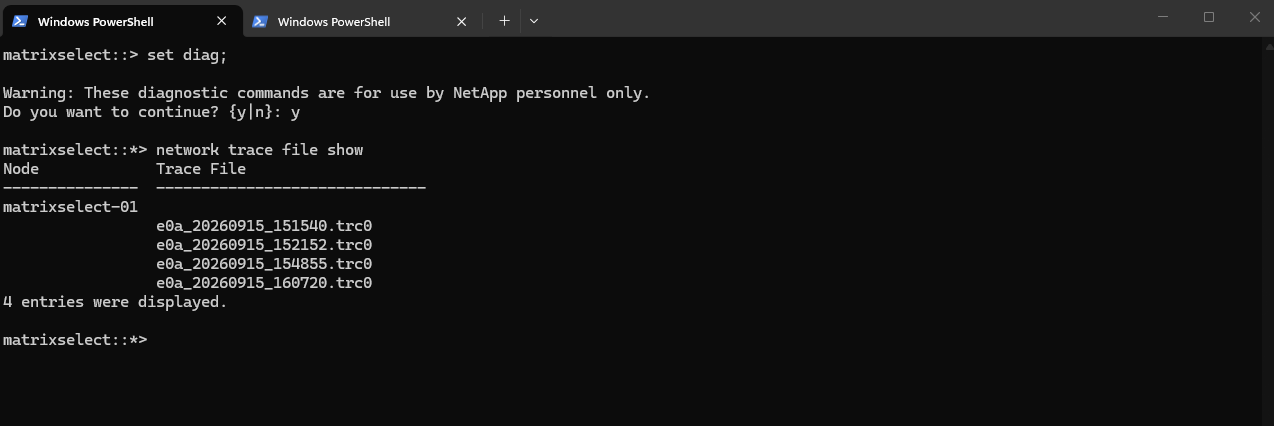
ONTAP lists the files stored in /mroot/etc/log/packet_traces/, which are the same files exposed through the SPI path http(s)://<CLUSTER_MGMT_IP>/spi/<NODE_NAME>/etc/log/packet_traces/.
Then delete a specific trace, for example:
network trace file delete -node matrixselect-01 -trace-file e0a_20260915_160720.trc0
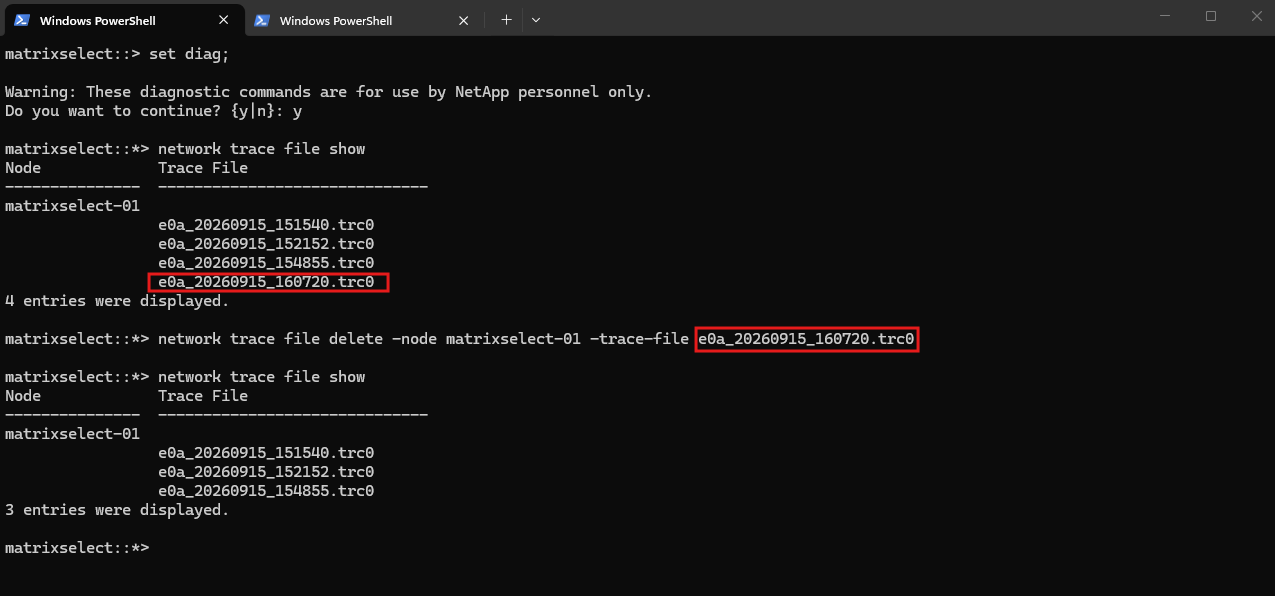
Or delete all packet trace files from that node:
network trace file delete -node matrixselect-01 -trace-file *
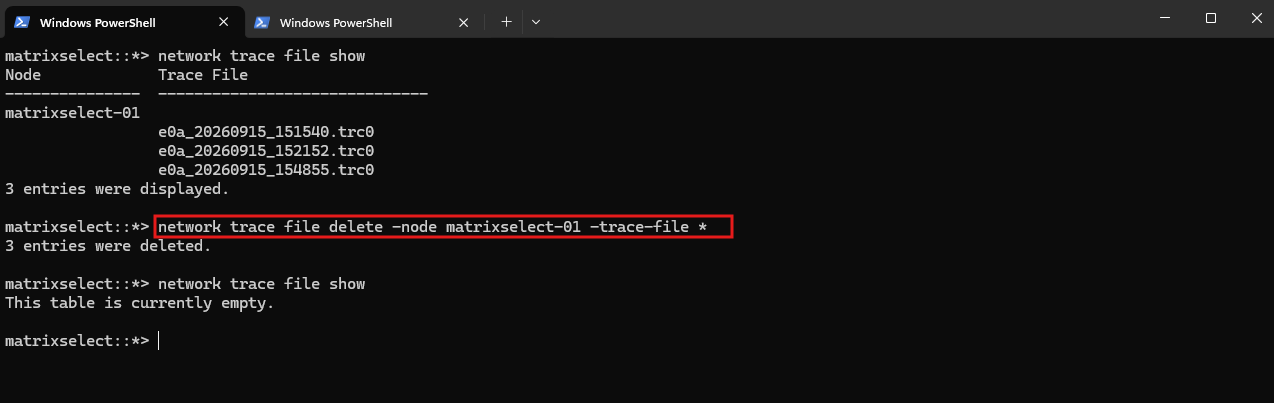
Note: Make sure any required packet traces have been downloaded before deleting them. Packet trace files reside on the node root volume and should not be left there unnecessarily after troubleshooting is complete.
Analyzing the ONTAP Packet Trace in Wireshark
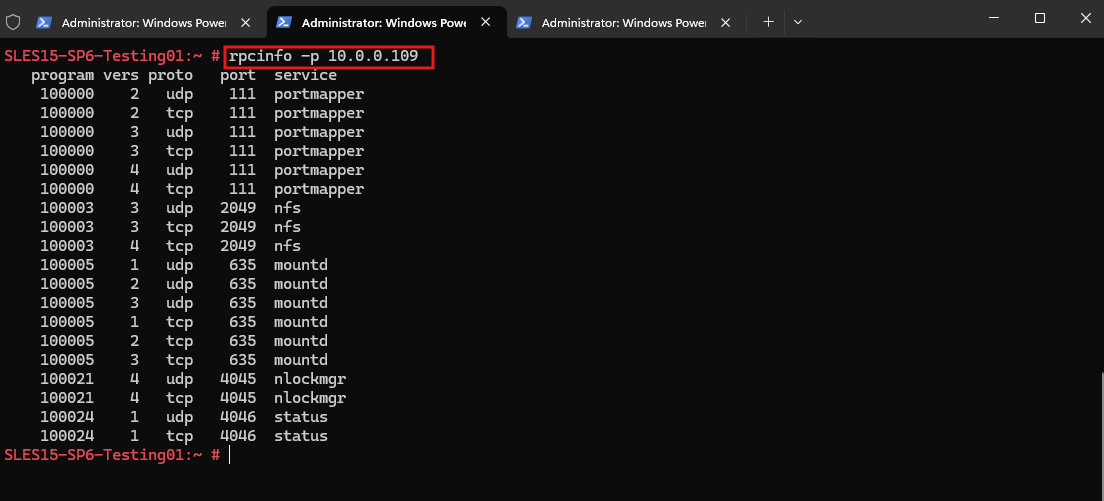
The downloaded .trc0 packet trace can be opened directly in Wireshark for detailed protocol analysis. In this example, the capture clearly shows the RPC Portmapper DUMP request and reply between the client and ONTAP, confirming that the RPC request reached the SVM data LIF and that ONTAP successfully responded.
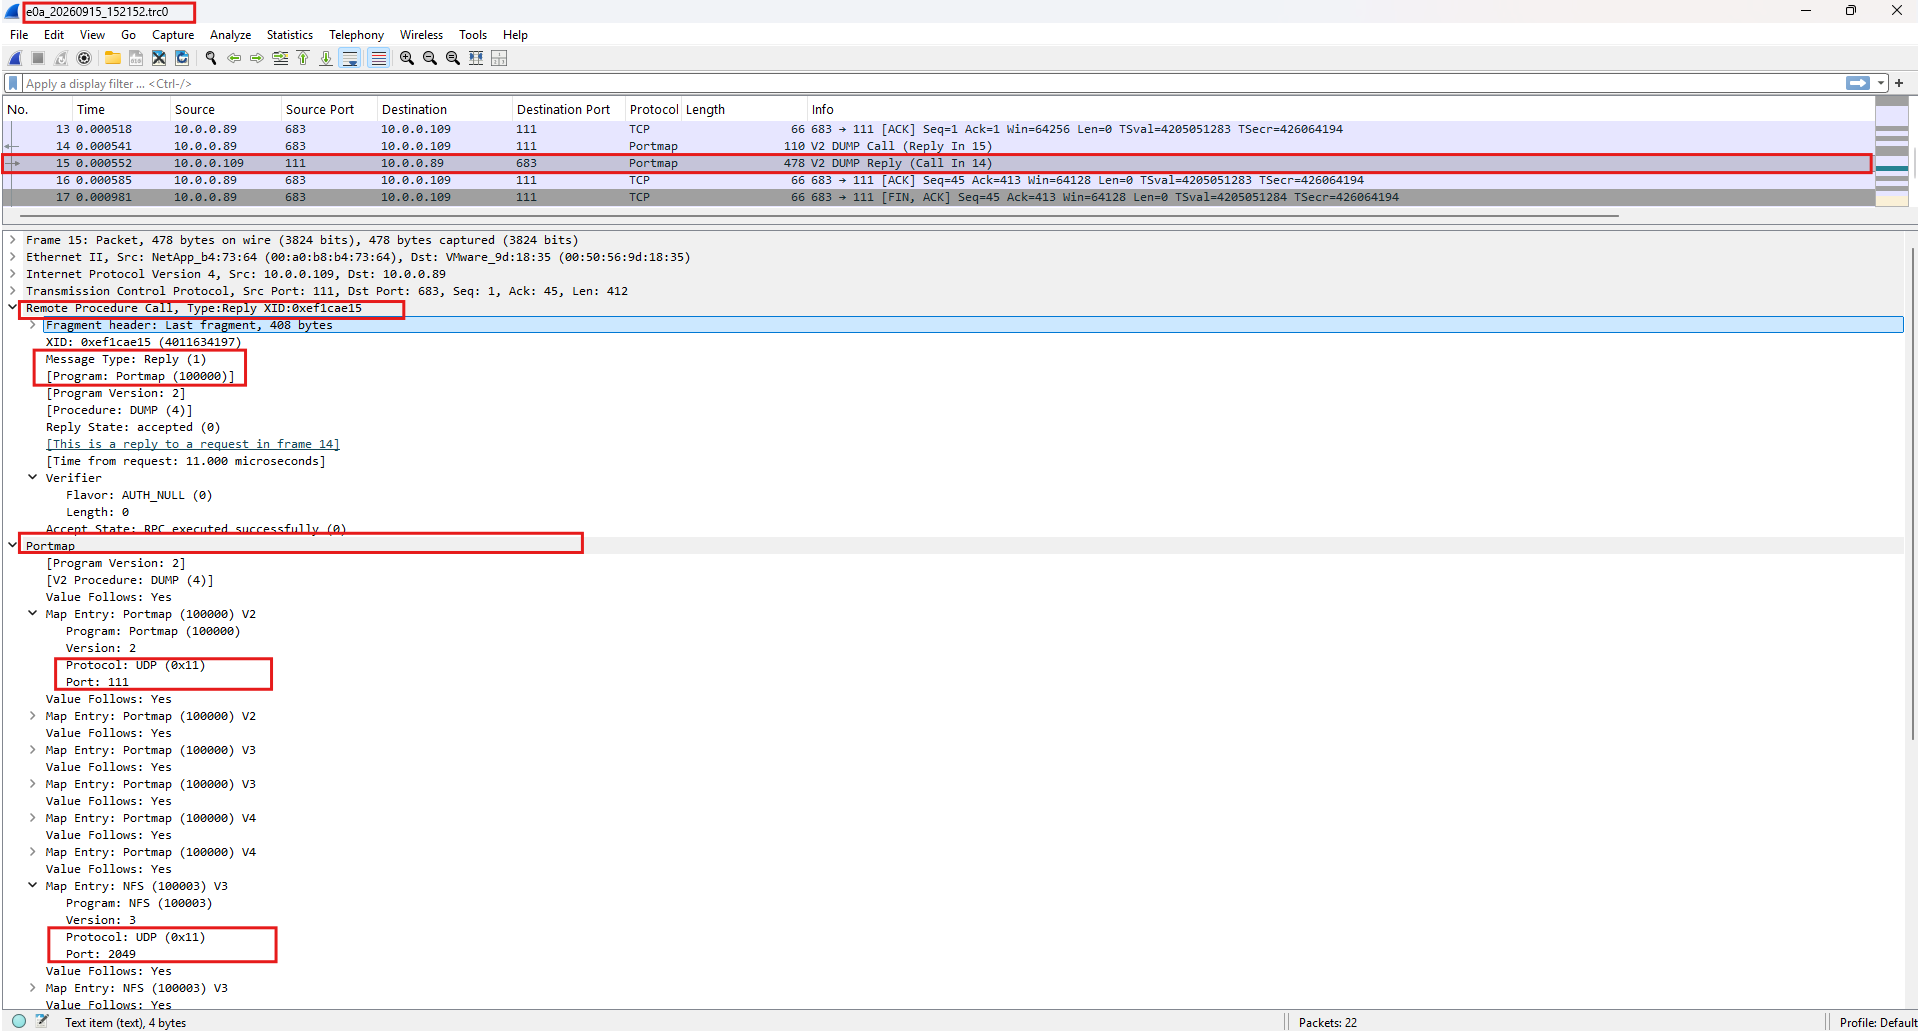
The packet capture above includes the traffic generated by the rpcinfo -p 10.0.0.109 command on the Linux client 10.0.0.89, allowing us to directly correlate the client-side RPC request with the corresponding request and response observed on ONTAP.
rpcinfo -p 10.0.0.109
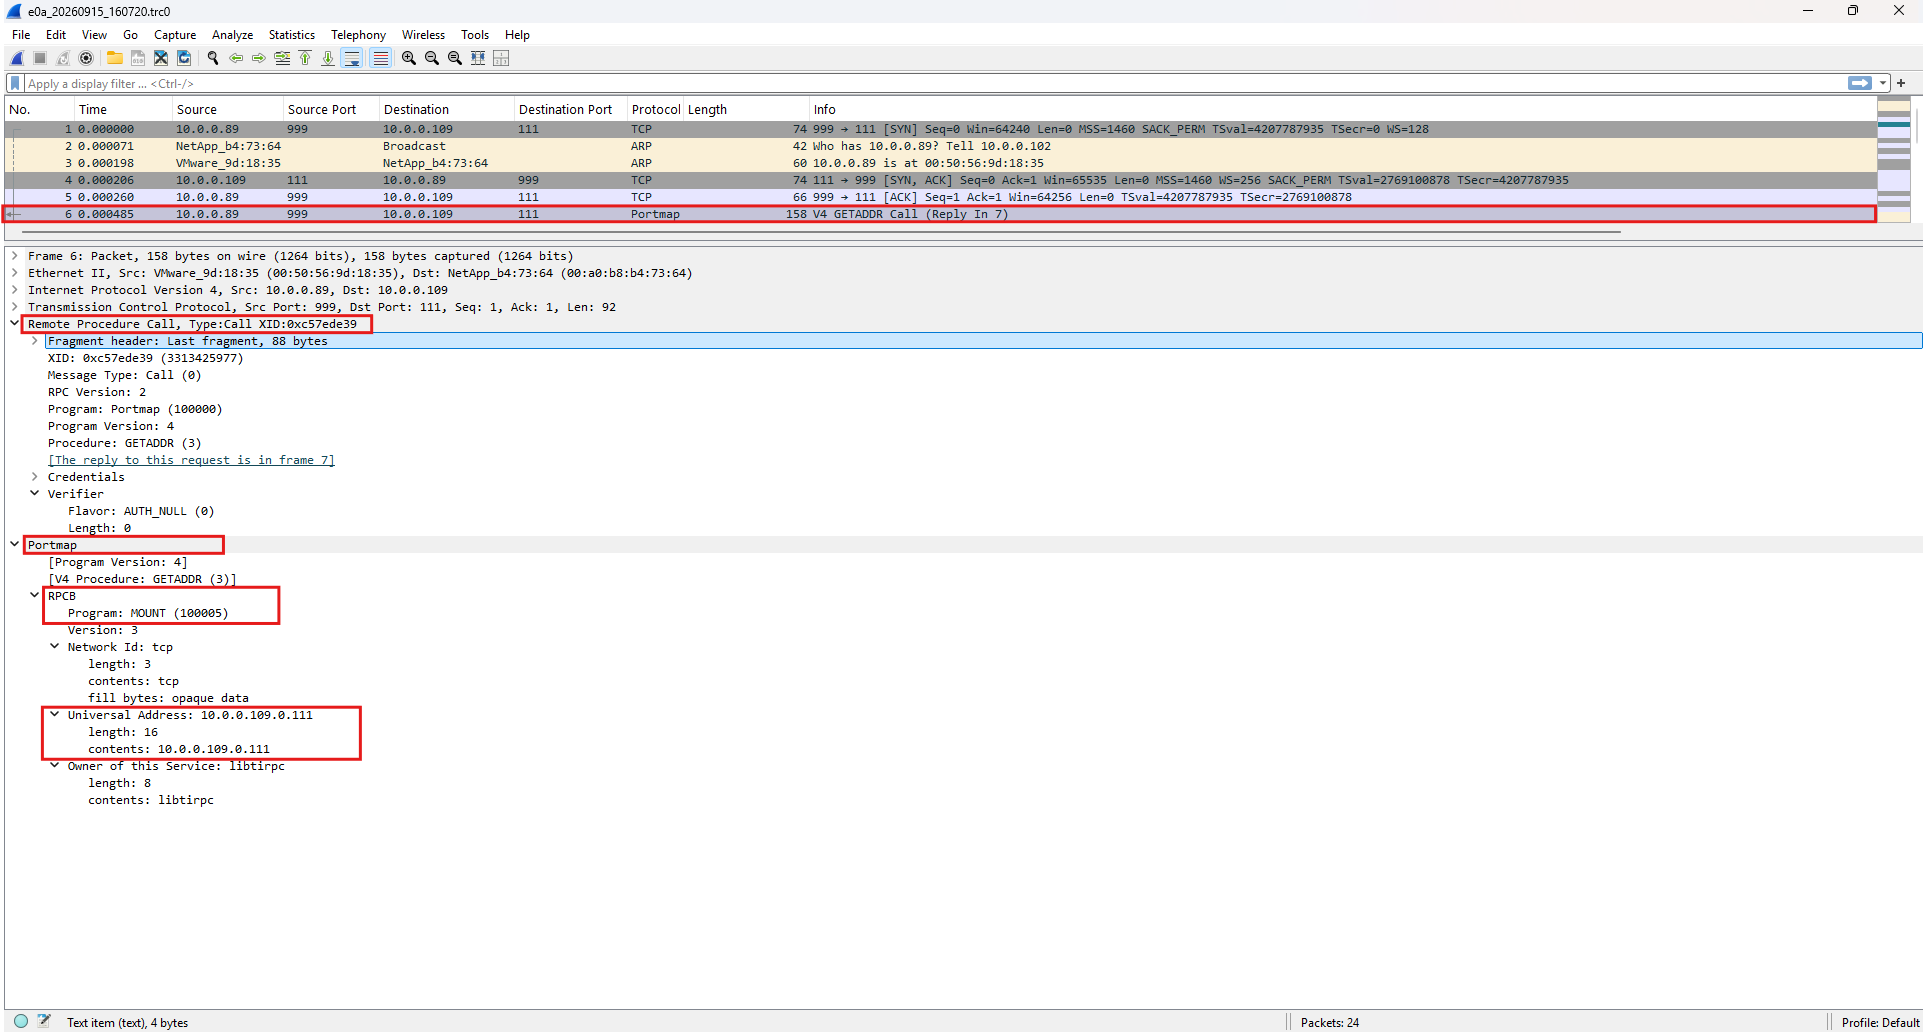
As another example, we can capture the traffic generated by showmount -e, which queries the NFS server for its exported paths.
This allows us to observe both the RPC service discovery and the subsequent MOUNT protocol communication directly in the ONTAP packet trace.
showmount -e 10.0.0.109

This packet shows the RPCBind v4 GETADDR request sent by showmount to ONTAP on TCP/111. The client asks the Portmapper for the network address of MOUNT program 100005, version 3, over TCP, which ONTAP resolves in the following reply.
Note: On Linux,
showmountfirst attempts to communicate with the MOUNT RPC service over TCP and falls back to UDP if the TCP RPC client cannot be established. In our capture, the client therefore queries RPCBind for MOUNTv3 over TCP and subsequently connects to ONTAPmountdon TCP port635.
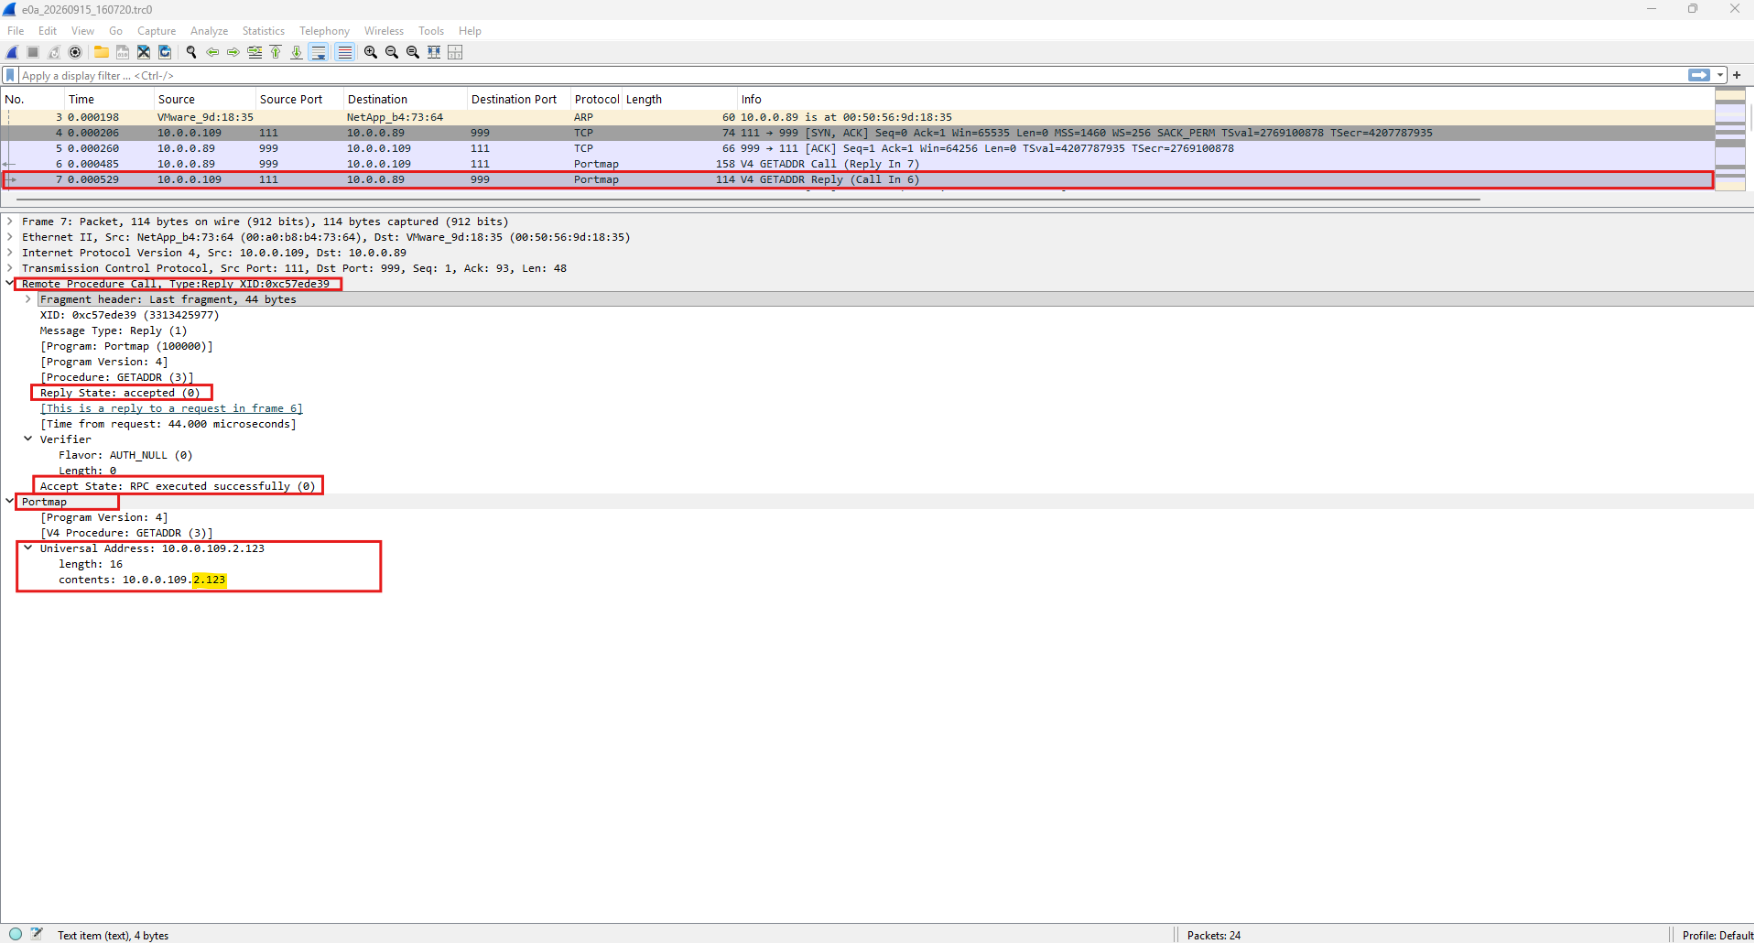
In the RPCBind GETADDR reply, ONTAP confirms that the request was successfully processed and returns the universal address 10.0.0.109.2.123.
Note: The final two values appended to the data LIF IP 10.0.0.109.
2.123and highlighted below encode the TCP port (2 × 256 + 123 = 635), telling the client that the MOUNTv3 service is available on TCP port 635.
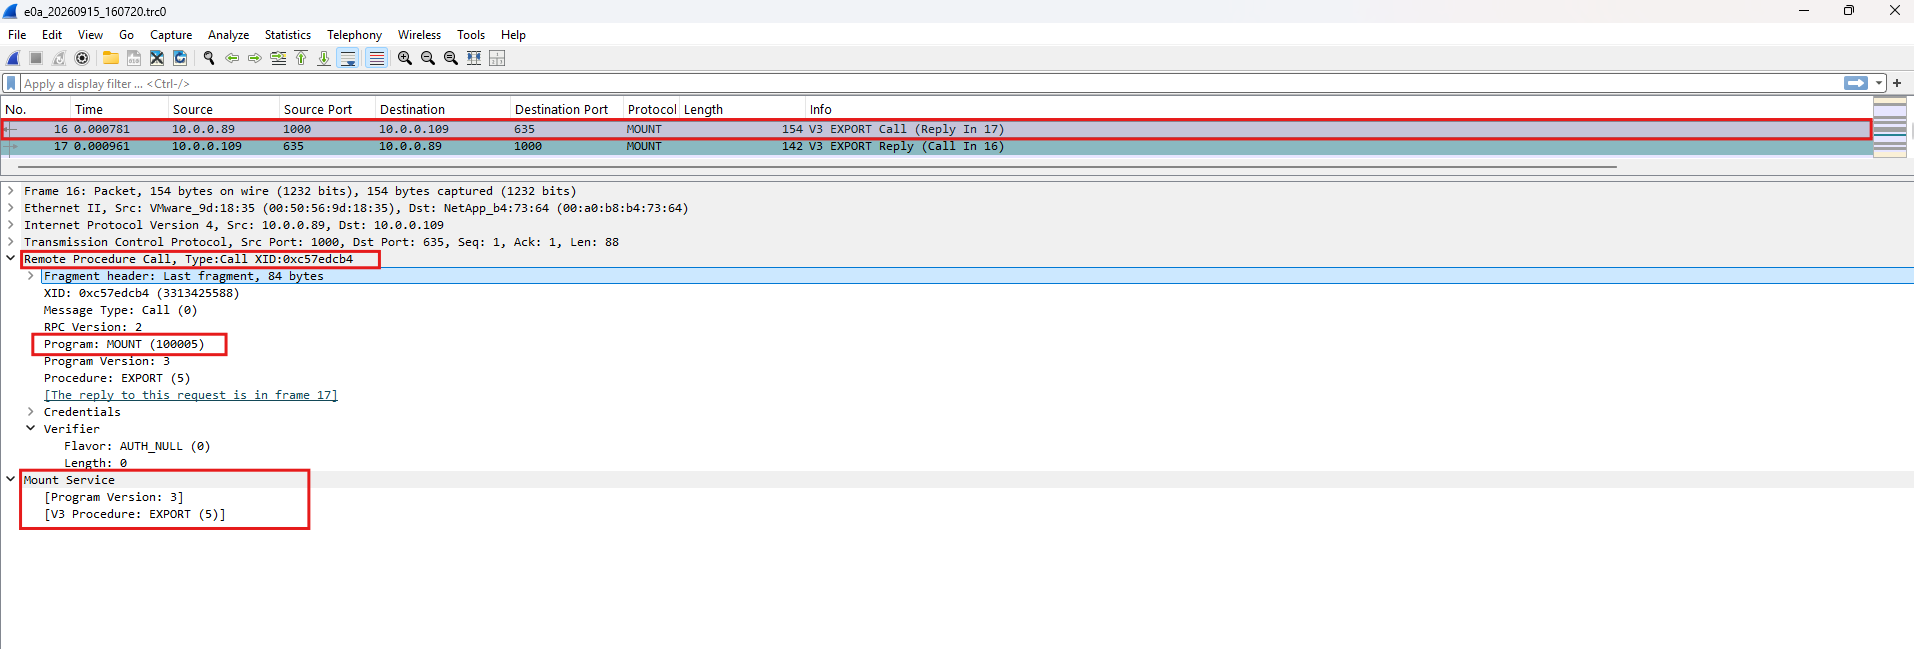
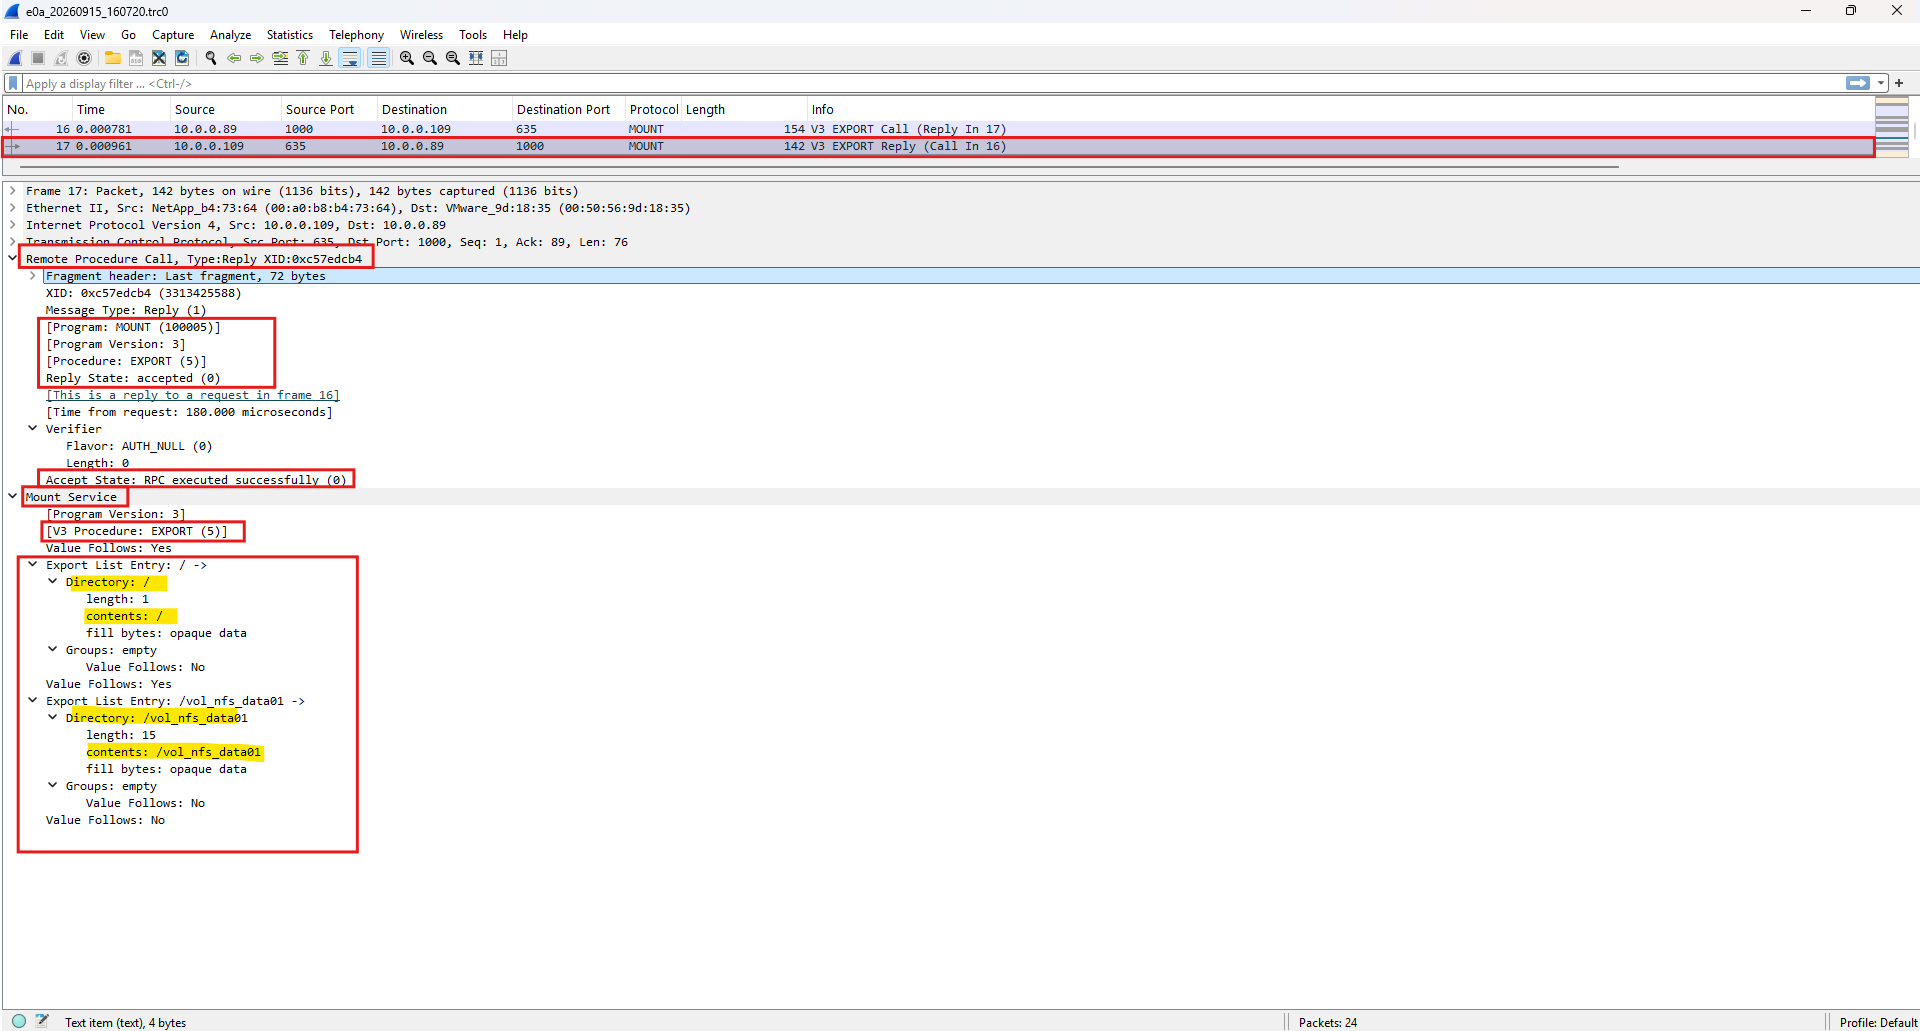
The client now connects to the previously discovered TCP port 635 and sends a MOUNT program (100005), version 3, EXPORT procedure request. The EXPORT procedure asks ONTAP to return the list of NFS exports advertised by the MOUNT service.
ONTAP successfully processes the MOUNTv3 EXPORT request and returns the exported paths / and /vol_nfs_data01 in the EXPORT reply.
These are the same entries that
showmount -esubsequently displays on the Linux client.
Links
How to capture packet traces on ONTAP 9.10+ systems
https://kb.netapp.com/on-prem/ontap/da/NAS/NAS-KBs/How_to_capture_packet_traces_tcpdump_on_ONTAP_910_systemsrpcinfo(8) — Linux manual page
https://www.man7.org/linux/man-pages/man8/rpcinfo.8.htmlshowmount(8) — Linux manual page
https://www.man7.org/linux/man-prpcbind(8) — Linux manual page
https://www.man7.org/linux/man-pages/man8/rpcbind.8.htmlnetwork trace file show
https://docs.netapp.com/us-en/ontap-cli-991/network-trace-file-show.htmlnetwork trace file delete
https://docs.netapp.com/us-en/ontap-cli-991/network-trace-file-delete.html